The Challenges of Tropical Cyclone QPF
Excessive rainfall from tropical cyclones (TCs) can cause extensive flooding and threaten the lives of people living in the affected area. Correct interpretation of the Weather Prediction Center’s (WPC) TC rainfall products is crucial for the accurate and timely issuance of WFO precipitation forecasts.
Quantitative precipitation forecasting, in general, is characterized by major successes and major failures. TC precipitation forecasting is similarly challenging.
Question
Compare the 192-hour quantitative precipitation forecast (QPF) for Hurricane Sandy (2012) from 12 UTC October 24 - 12 UTC November 1 with the observed amounts for the same time period. Drag the circle left or right to compare the two images below.
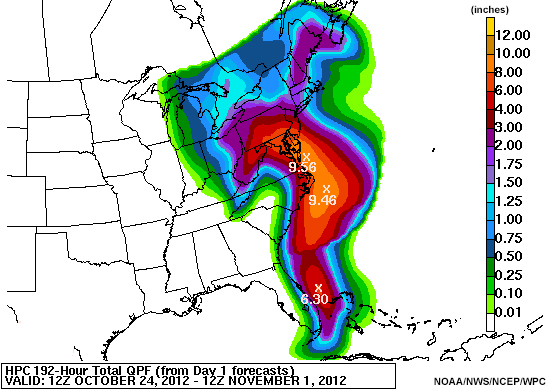
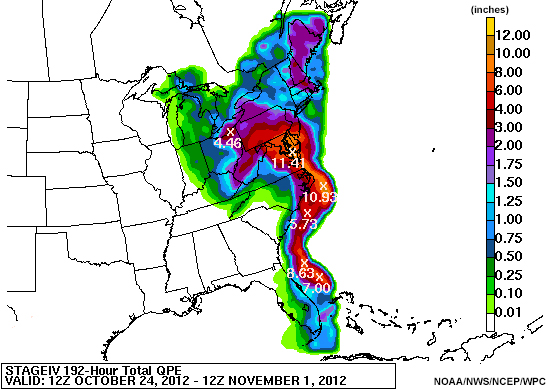
How well did the WPC’s forecast predict the distribution and amount of precipitation across the eastern U.S.? Choose the best answer.
The correct answer is a.
The forecast predicted precipitation over the northeast U.S. and along the U.S. east coast, with higher amounts across the mid-Atlantic. These projections are reflected well in the precipitation analysis, suggesting that WPC produced a very reliable forecast at long lead times. However, depending on the size, track, forward speed, and behavior of the storm, the outcome may have been significantly different. Hurricane Sandy was a large and well-formed TC, and was well forecast with excellent lead time.
In other cases, sudden changes to TC track, timing, or intensity may dramatically increase or decrease the forecast precipitation over a given area. Compare the 48-hour QPF for Hurricane Isaac (2012) from 12 UTC August 28 - 12 UTC August 30 with the observed amounts for the same time period. Drag the circle left or right to compare the two images below.
Question
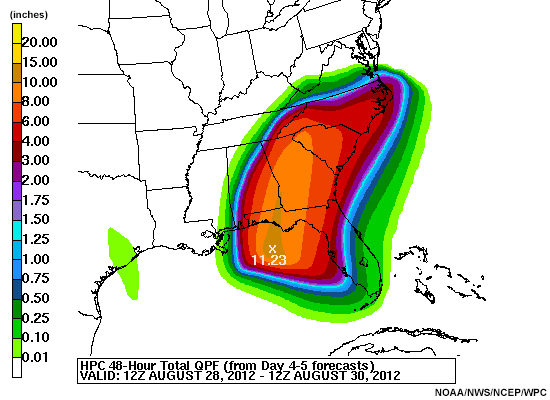
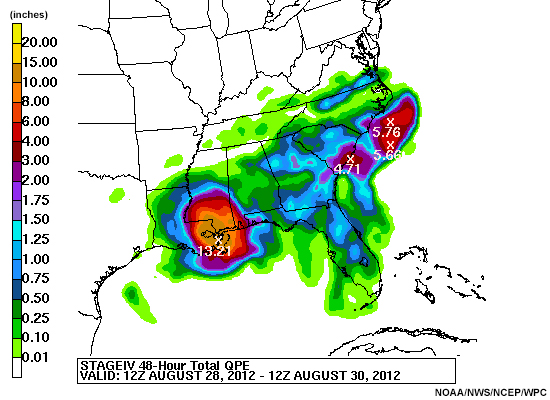
How well did the WPC’s forecast predict the distribution and amount of precipitation across the southeast U.S.? Choose the best answer.
The correct answer is c.
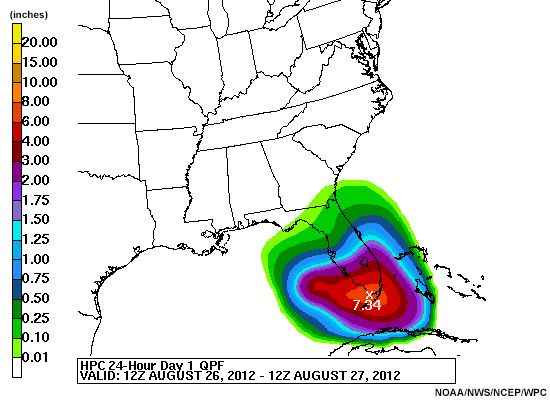
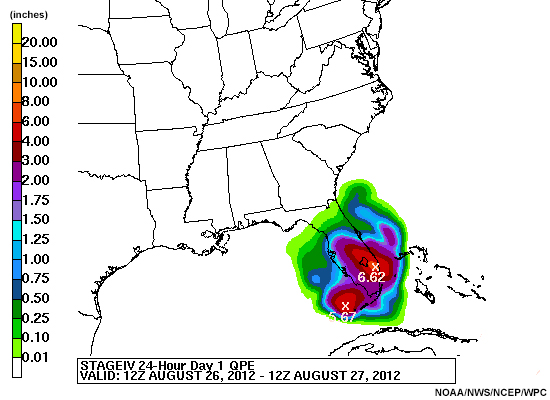
The track forecast kept shifting westward, so some of the Day 4-5 QPFs from WPC had particularly large errors (showing heavy amounts over Georgia). Those forecasts also did a poor job of accounting for uncertainty and the potential for dry air entrainment after landfall. WPC has since made strides in this area with the Day 1 forecast performing much better. This is shown in the example below of a Day 1 QPF and observations. Drag the circle left or right to compare the two images.
Even when the TC track is well forecast, small-scale banded structures can lead to extreme variability in locally observed rain amounts, as seen in the image below. Tropical Storm Allison (2001) produced significant gradients in precipitation across southeast Texas. The precipitation ranged from ~10-20 inches over the southwest side of Houston to >40 inches in a few local spots.
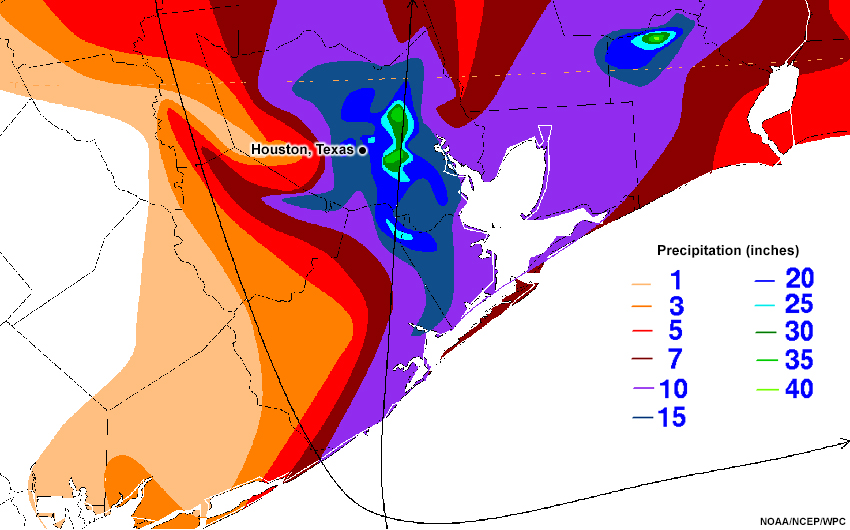
Tropical cyclone rainfall data across Houston, TX during Tropical Storm Allison from June 4-18, 2001.