Media elements used in this module are protected by a variety of copyright licenses. Please use the "copyright terms" link associated with each item below for more information.
Description:
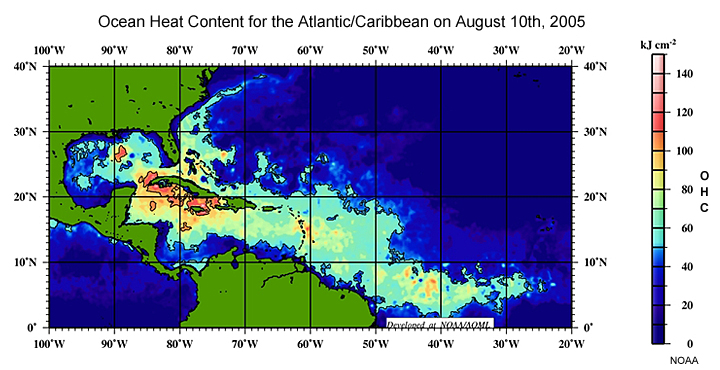
Ocean heat content for the Atlantic/Caribbean on August 10th, 2005
File Name:
2005222at.jpg
Credits:
NOAA
Copyright Terms:
COMET Standard Terms of Use
Description:
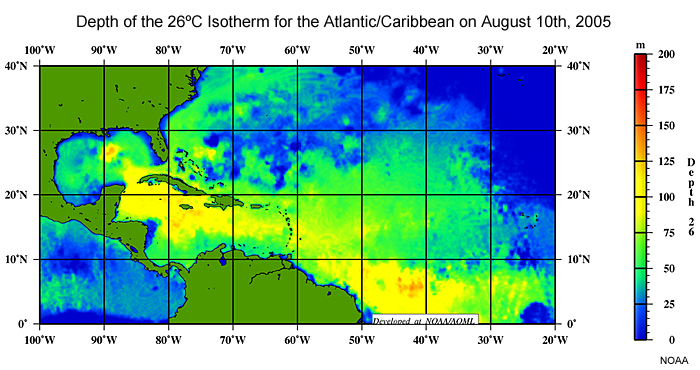
Depth of the 26ºC isotherm for the Atlantic/Caribbean on August 10th, 2005
File Name:
2005222atd26.jpg
Credits:
NOAA
Copyright Terms:
COMET Standard Terms of Use
Description:
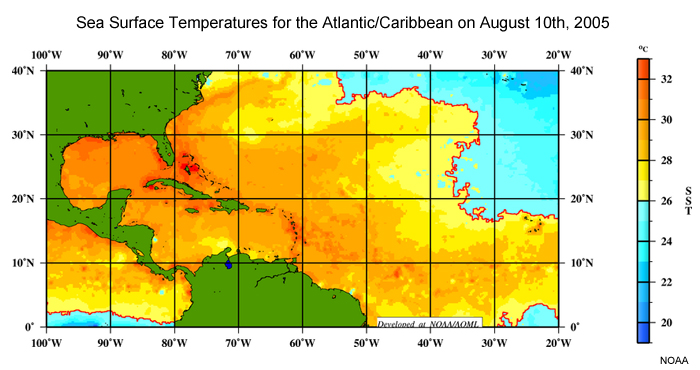
Sea surface temperatures for the Atlantic/Caribbean on August 10th, 2005
File Name:
2005222atsst.jpg
Credits:
NOAA
Copyright Terms:
COMET Standard Terms of Use
Description:
September Climatology 700 hPa winds (m/s) (contours) for Tropical northern Atlantic, 1971-2000
File Name:
aej_700winds_sept.gif
Credits:
NCAR/NCEP/NOAA
Copyright Terms:
COMET Standard Terms of Use
Description:
September Climatology 700 hPa winds (m/s) (contours) for Tropical northern Atlantic, 1971-2000
File Name:
aej_700winds_sept_noxsect.gif
Credits:
NCAR/NCEP/NOAA
Copyright Terms:
COMET Standard Terms of Use
Description:
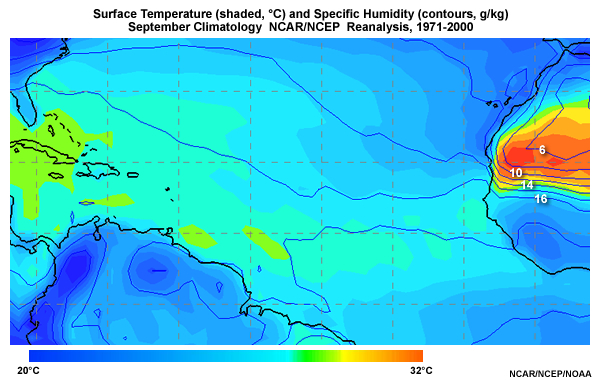
September Climatology Surface Temp and Specific Humidity, North Central Atlantic 1971-2000
File Name:
aej_srf_tempshum_sept.jpg
Credits:
NCAR/NCEP/NOAA
Copyright Terms:
COMET Standard Terms of Use
Description:
August and September African Easterly Jet in Average, Inactive, and Active Hurricane Seasons (Zonal Wind and Vorticity)
File Name:
aej_study_f42.gif
Credits:
NOAA/NWS/CPC
Copyright Terms:
COMET Standard Terms of Use
Description:
August and September African Easterly Jet in Average, Inactive, and Active Hurricane Seasons (Wind Shear and Vorticity)
File Name:
aej_study_f43.gif
Credits:
NOAA/NWS/CPC
Copyright Terms:
COMET Standard Terms of Use
Description:
September Climatology Winds Cross-Section (m/s) 0-20
File Name:
aej_windsxsect_sept.gif
Credits:
NCAR/NCEP/NOAA
Copyright Terms:
COMET Standard Terms of Use

Description:
Conceptual illustration of ocean mixing caused by tropical cyclone.
File Name:
cyclone_mixing_cross_1_1.mp4
Credits:
©The COMET Program
Copyright Terms:
COMET Standard Terms of Use
Description:
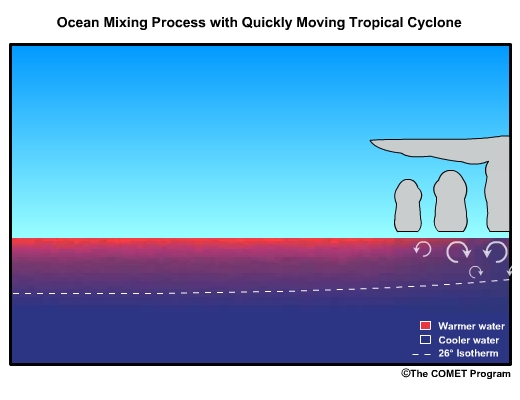
Conceptual illustration of variation on ocean mixing caused by rapidly moving tropical cyclone.
File Name:
cyclone_mixing_cross_2_1.mp4
Credits:
©The COMET Program
Copyright Terms:
COMET Standard Terms of Use

Description:
Conceptual illustration of variation on ocean mixing caused by slowly moving tropical cyclone.
File Name:
cyclone_mixing_cross_3_1.mp4
Credits:
©The COMET Program
Copyright Terms:
COMET Standard Terms of Use

Description:
Map of Average Sea Surface Salinity (parts per thousand)
File Name:
global_sss_map.jpg
Credits:
NASA
Copyright Terms:
COMET Standard Terms of Use
Description:
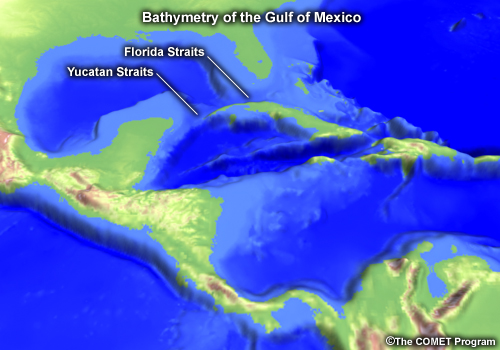
shaded relief bathymetry for the Gulf of Mexico showing the Yucatan Strait and Florida Strait.
File Name:
loop_bathymetry.jpg
Credits:
©The COMET Program
Copyright Terms:
COMET Standard Terms of Use
Description:
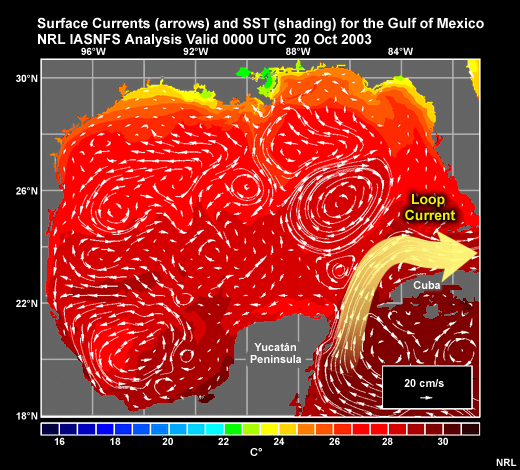
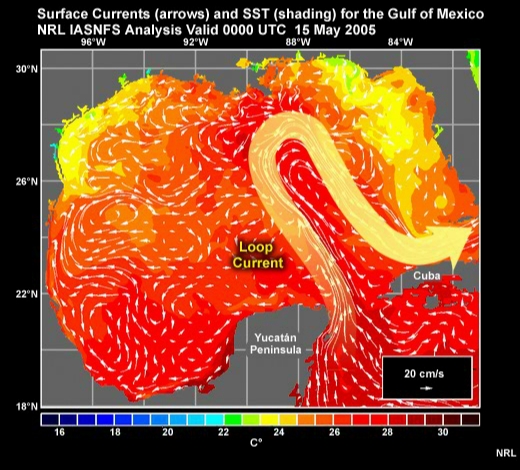
Surface currents (arrows) and SST (shading) for the Gulf of Mexico.
NRL IASNFS Analysis valid 00 UTC 20 Oct 2003
File Name:
loop_current_direct.jpg
Credits:
NRL
Copyright Terms:
COMET Standard Terms of Use

Description:
Surface currents (arrows) and SST (shading) for the Gulf of Mexico.
NRL IASNFS Analysis valid 00 UTC 1 Aug 2007
File Name:
loop_current_sst.gif
Credits:
NRL
Copyright Terms:
COMET Standard Terms of Use
Description:
Ocean Heat Content for the Gulf of Mexico 1 Aug 2007
File Name:
loop_ohc.gif
Credits:
RASMAS
Copyright Terms:
COMET Standard Terms of Use
Description:
Loop of Surface currents (arrows) and SST (shading) for the Gulf of Mexico.
NRL IASNFS Analysis valid 00 UTC 15 May to 1 Aug 2005
showing formation of a Loop Current ring and its subsequent westward drift
File Name:
loop_ring_form_0001.htm
Credits:
NRL
Copyright Terms:
COMET Standard Terms of Use
Description:
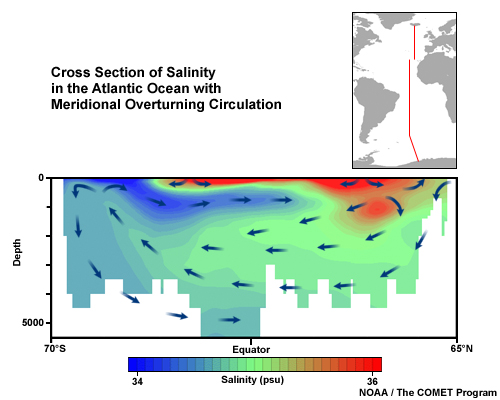
North-south cross section of salinity in the Atlantic Ocean with meridional overturning circulation.
File Name:
moc_atlantic_salinity.jpg
Credits:
NOAA / The COMET Program
Copyright Terms:
COMET Standard Terms of Use
Description:
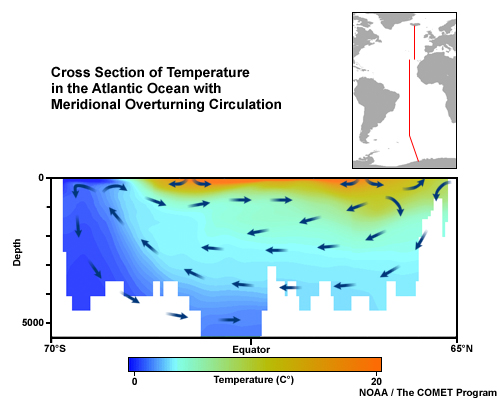
North-south cross section of temperature in the Atlantic Ocean with meridional overturning circulation.
File Name:
moc_atlantic_temp.jpg
Credits:
NOAA / The COMET Program
Copyright Terms:
COMET Standard Terms of Use
Description:
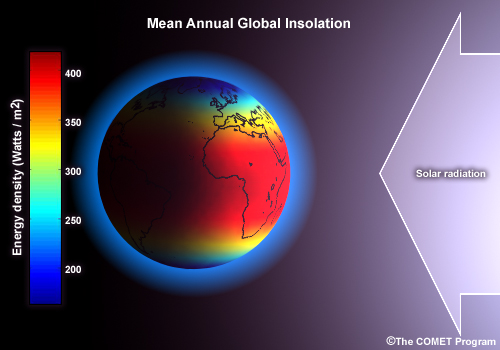
mean annual global insolation
File Name:
moc_insolation.jpg
Credits:
©The COMET Program
Copyright Terms:
COMET Standard Terms of Use

Description:
Time Series of North Atlantic MOC and SST from Global Circulation Model (ECHAM5/MPI-OM1) showing correlation of SST and MOC and multidecadal oscillation.
File Name:
moc_sst_timeseries.gif
Credits:
Latif et al. 2004
Copyright Terms:
COMET Standard Terms of Use

Description:
Global ocean surface currents with Gulf Stream and Kuroshio Currents highlighted
File Name:
nw_currents.jpg
Credits:
NGA/The COMET Program
Copyright Terms:
COMET Standard Terms of Use
Description:
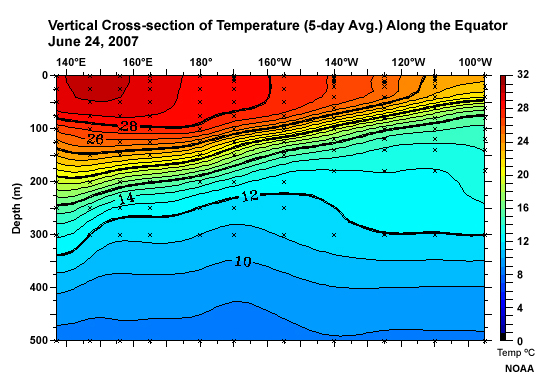
Vertical Cross-section of Temperature (5-day Avg.) Along the Equator
File Name:
ohc-sub_surf_tao.jpg
Credits:
TAO Project Office / NOAA
Copyright Terms:
COMET Standard Terms of Use

Description:
A temperature-depth profile example.
File Name:
ohc-temp_depth_profile_grab.jpg
Credits:
©The COMET Program
Copyright Terms:
COMET Standard Terms of Use

Description:
Schematic comparing ocean convection under SAL and non-SAL conditions. Under influence of dry air of SAL downdraft disruptions cause active cell to be less organized.
File Name:
SAL_convection.jpg
Credits:
©The COMET Program
Copyright Terms:
COMET Standard Terms of Use
Description:
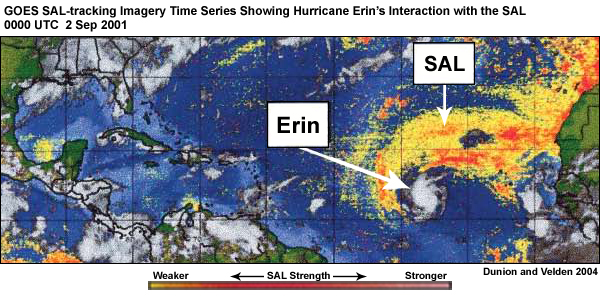
GOES SAL-tracking imagery time series showing Hurricane Erin?s interaction with the SAL at (top to bottom) 0000 UTC 2 Sep 2001, 0000 UTC 4 Sep 2001, 1800 UTC 5 Sep 2001, 1200 UTC 8 Sep 2001, and 1800 UTC 9 Sep 2001. The yellow?red shading indicates likely SAL regions with increasing amounts of dust content and dry lower-tropospheric air, as detected by the GOES imagery.
File Name:
SAL_Erin_GOES_1.htm
Credits:
Dunion and Velden 2004
Copyright Terms:
COMET Standard Terms of Use
Description:
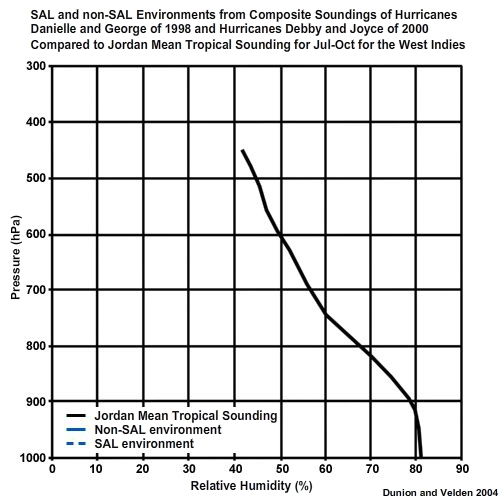
Composite GPS sonde profiles from sondes launched in the environments of Hurricanes Danielle and Georges of 1998 and Hurricanes Debby and Joyce of 2000. SAL and non-SAL environments were determined using GOES SAL-tracking imagery (see, e.g., Fig. 1). The Jordan mean tropical sounding for the area of the West Indies for Jul?Oct is presented for reference.
File Name:
SAL_Jordan_Soundings.mp4
Credits:
Dunion and Velden 2004
Copyright Terms:
COMET Standard Terms of Use
Description:
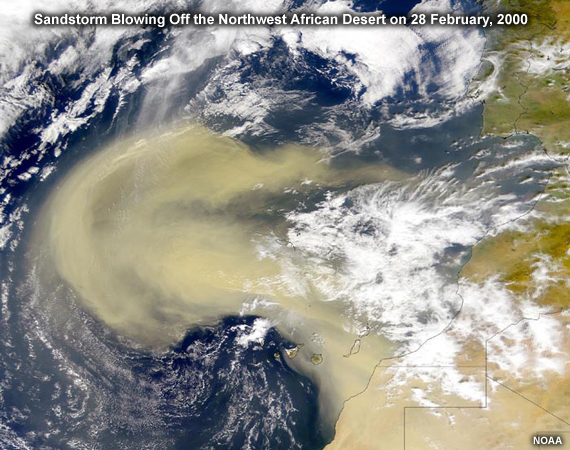
Satellite photo of massive sandstorm blowing off the northwest African desert on 28 February, 2000.
File Name:
SAL_Sat_image.jpg
Credits:
NOAA
Copyright Terms:
COMET Standard Terms of Use
Description:
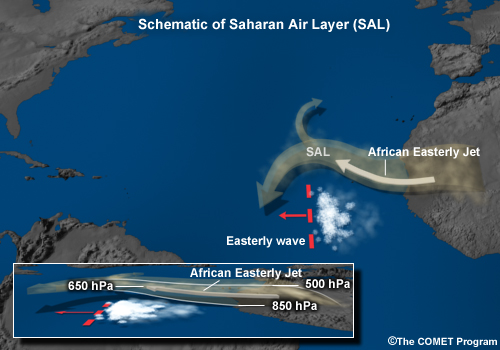
Schematic of Saharan Air Layer
File Name:
SAL_schematic.jpg
Credits:
©The COMET Program
Copyright Terms:
COMET Standard Terms of Use
Description:
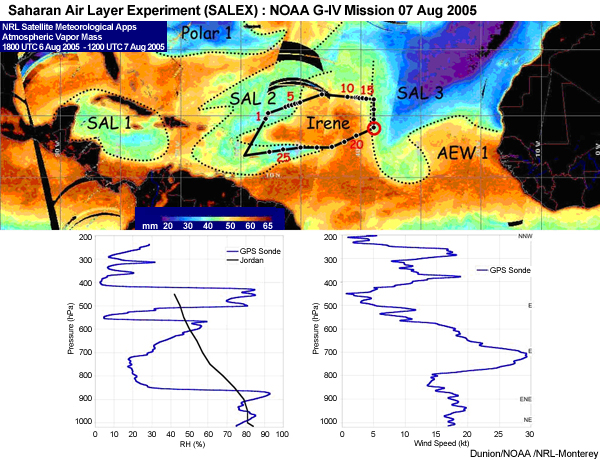
Sounding data showing wind speed and relative humidity taken at dropsonde location #19 on the Saharan Air Layer Experiment (SALEX) 7 August 2005.
File Name:
SAL-SALEX-soundings.jpg
Credits:
Dunion / NOAA / NRL-Monterey
Copyright Terms:
COMET Standard Terms of Use
Description:
Sounding data showing wind speed and relative humidity taken at dropsonde location #19 on the Saharan Air Layer Experiment (SALEX) 7 August 2005. Zoom in on sounding showing wind speed and pressure.
File Name:
SAL-SALEX-soundings.jpg
Credits:
Dunion / NOAA / NRL-Monterey
Copyright Terms:
COMET Standard Terms of Use
Description:
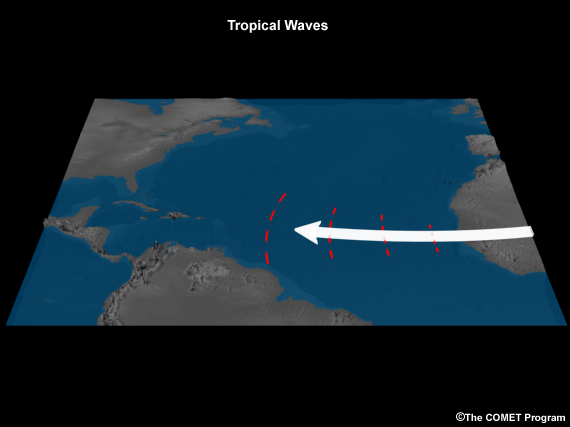
Tropical Waves and AEJ
File Name:
tropical_waves.jpg
Credits:
©The COMET Program
Copyright Terms:
COMET Standard Terms of Use
Description:
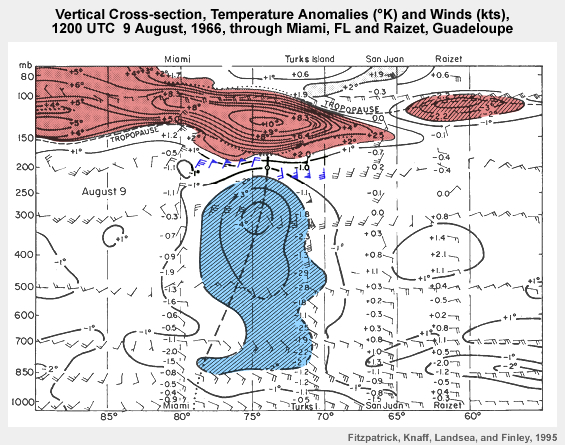
Vertical Cross-section, Temperature Anomalies (
File Name:
tutt_3d.jpg
Credits:
Fitzpatrick, Knaff, Landsea, and Finley, 1995
Copyright Terms:
COMET Standard Terms of Use
Description:
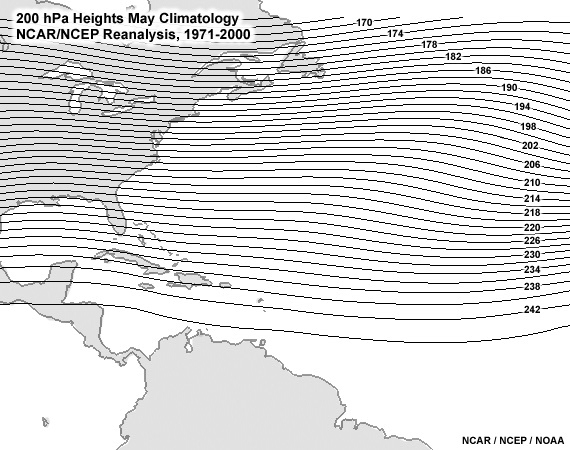
May-November Climatology 200 mb heights (contours) for the northern Atlantic, 1971-2000
File Name:
tutt_climatology_0001.htm
Credits:
NCAR/NCEP/NOAA
Copyright Terms:
COMET Standard Terms of Use
Description:
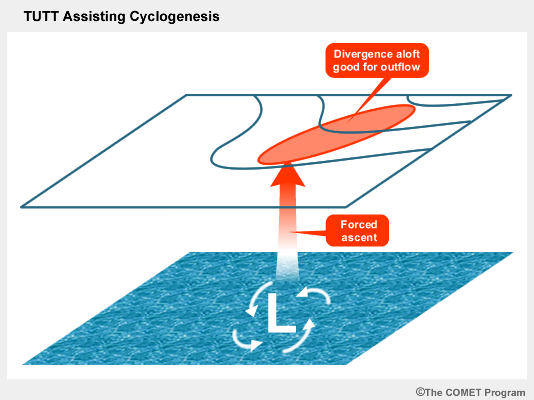
TUTT mechanism for assisting cyclogenesis
File Name:
tutt_cyclogenesis.jpg
Credits:
©The COMET Program
Copyright Terms:
COMET Standard Terms of Use
Description:
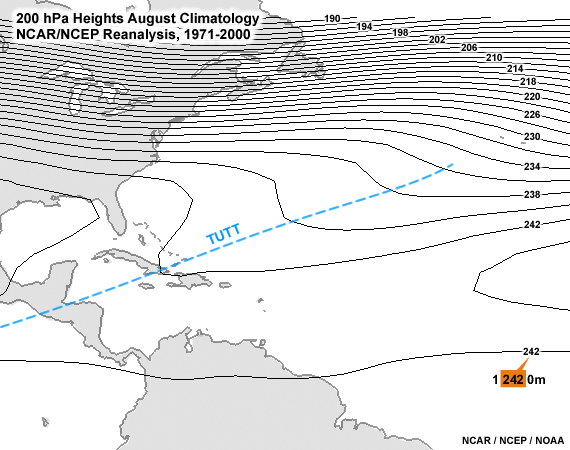
TUTT evident in August Climatology 200 mb heights (contours) for the northern Atlantic, 1971-2000
File Name:
tutt_definition.jpg
Credits:
NCAR/NCEP/NOAA
Copyright Terms:
COMET Standard Terms of Use
Description:
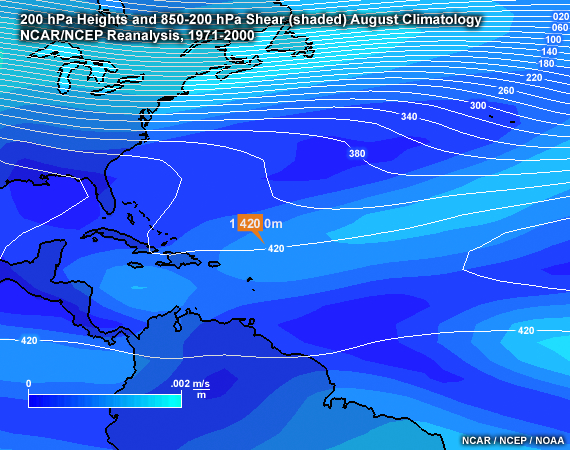
August Climatology 200 mb heights (contours) and 850mb-200mb shear (shading) for the northern Atlantic, 1971-2000
File Name:
tutt_shear_august.jpg
Credits:
NCAR/NCEP/NOAA
Copyright Terms:
COMET Standard Terms of Use
Description:
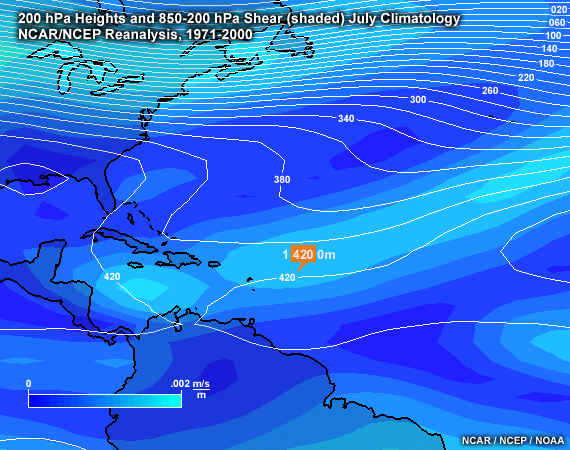
July Climatology 200 mb heights (contours) and 850mb-200mb shear (shading) for the northern Atlantic, 1971-2000
File Name:
tutt_shear_july.jpg
Credits:
NCAR/NCEP/NOAA
Copyright Terms:
COMET Standard Terms of Use