About the Lesson
This lesson introduces the VIIRS imager on board the Suomi NPP and upcoming JPSS satellites. The lesson briefly describes the capabilities, improvements, and benefits that VIIRS brings to operational meteorology. Numerous images are shown that demonstrate a variety of applications available in the AWIPS display system.
On completing the lesson, you should be able to:
- Identify the VIIRS' 5 Imagery (resolution) and 16 Moderate (resolution) spectral bands and the phenomena that can be detected in the spectral regions they cover
- Describe the VIIRS imaging strategy and its advantages
- Identify some key applications of VIIRS imagery (including advancements to analysis, forecasting, numerical weather prediction, and climate and environmental monitoring)
- Describe the benefits and some uses of the VIIRS day night band
Introduction
VIIRS (or Visible Infrared Imaging Radiometer Suite) is a better suited low earth orbiting imager for weather forecasting than MODIS (Earth Observation System Moderate Resolution Imaging Spectroradiometer), to which it is often compared because of similar spectral imaging capabilities. MODIS was initially a NASA research and development sensor, later adapted for operational use, but VIIRS is designed for operational use. It was initially launched on the Suomi National Polar-orbiting Partnership (Suomi NPP) polar-orbiting satellite and now continues its imaging mission on board the JPSS (Joint Polar Satellite System) environmental satellites. With a robust multispectral capability, VIIRS represents the next generation replacement for the operational Advanced Very High Resolution Radiometer (AVHRR) on the NOAA series of satellites.
Both MODIS and VIIRS imagers have high resolution solar bands capable of producing spectacular red, green, blue (RGB) composites. Both produce a variety of environmental products. Beyond those similarities, the improvements with VIIRS are stunning: infrared bands at 2 to 3 times higher spatial resolution for eye-catching images, a wider imaging swath that eliminates gaps between orbits, much more detailed imaging at the edge of swath, and a special band for nighttime visible imaging.
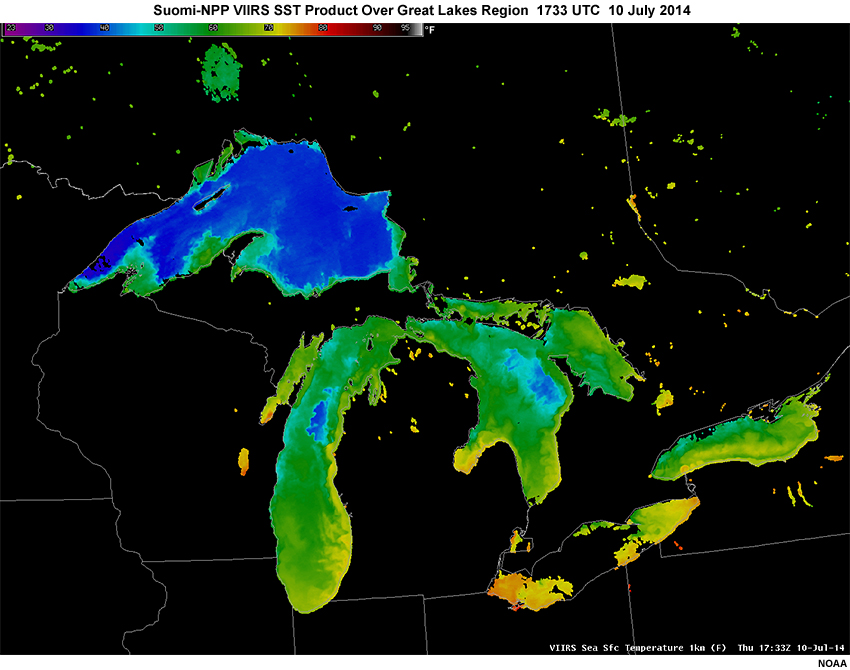
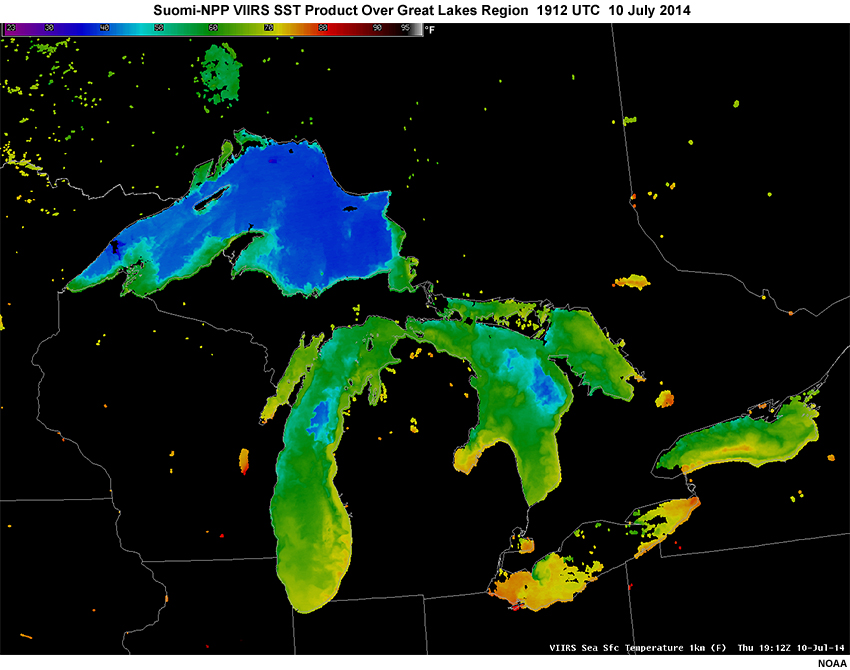
The wide overlapping swath of SNPP VIIRS allows two consecutive views of sea surface temperature over the Great Lakes on the same afternoon.
VIIRS Compared to MODIS
What capabilities of MODIS does VIIRS carry forward, what are the improvements, and what are the limitations?
Continuity
- Same equatorial crossing times as Aqua MODIS (0130 and 1330 local time)
- High resolution solar (daytime) bands
- High quality images and Red/Green/Blue (RGB) composites
- A product suite for monitoring land, sea, snow and ice cover, climate, and atmosphere
- A continuation of many of the same visible and infrared spectral bands as on MODIS
Improvements
- Much higher spatial resolution infrared bands
- Image quality improvement across the entire scan (6.5 times less spatial degradation)
- Wider 3000 km swath, thus better spatial coverage and elimination of gaps between orbits
- Has a Day Night Band; see the 15-minute SatFC-J: VIIRS Day/Night Band lesson, or the more recently updated and more comprehensive COMET lesson, Advances in Space-Based Nighttime Visible Observation, 2nd Edition.
Limitations
- No water vapor or carbon dioxide bands
- Fewer bands for ocean color applications
VIIRS Compared to GOES-R/16 ABI
Let’s for a moment compare VIIRS to the next generation ABI imager flying on board the GOES-R series geostationary satellites. VIIRS strength lies in its ability to image at high spatial resolution, whereas the GOES-R ABI can image at high refresh rates over the same area. What are some of the other notable differences as well as potential synergies between the two imagers?
VIIRS Advantages
- More bands at higher spatial resolution
- VIIRS extends high resolution imaging poleward into regions where GOES satellite resolution degrades; VIIRS high-spatial resolution is preserved and overlapping orbits allow for looping
- VIIRS has a true color capability; GOES-16 lacks a green band and offers simulated true color
- VIIRS has a Day/Night Band; GOES-16 does not
- VIIRS offers the best imaging of small-scale features such as fires, river discharge, ice cover, and flooding
GOES-R Series Advantages
- Much more frequent temporal refresh rate
- Three water vapor bands; VIIRS has none
- A powerful high spatial and temporal looping capability in the tropics and midlatitudes
- Over CONUS, GOES-R series has the advantage as an operational imager
- Best platform for monitoring of tropical cyclones, oceanic storms, severe weather, and other transient features outside of polar regions
Synergies
- Similar spectral band suites allow for similar products and often nearly identical interpretation
- Intercomparison of VIIRS and GOES-R ABI can add value to the forecast process
- Training for either VIIRS or GOES-R ABI can serve as training for the other, especially regarding spectral capabilities
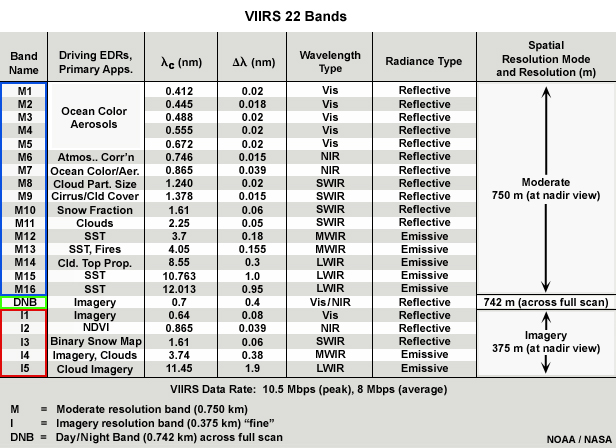
VIIRS Spectral Bands
VIIRS has 22 bands in total, including 16 Moderate Resolution bands (or M bands at 750 m on a side), 5 Imagery bands (or I bands at 375 m), and one Day Night Band (DNB). The DNB is such a powerful new addition to forecasting, that it has its own introduction, covered in the SatFC-J lesson, SatFC-J: VIIRS Day/Night Band.
The VIIRS bands exploit wavelengths from the visible into the longwave infrared. The M bands replicate bands familiar from MODIS, making it capable to produce Red-Green-Blue (RGB) composites. The I bands constitute the next generation high resolution toolkit pioneered by the AVHRR imager still operating on legacy NOAA satellites. See the following table for more details.
VIIRS Swath Width
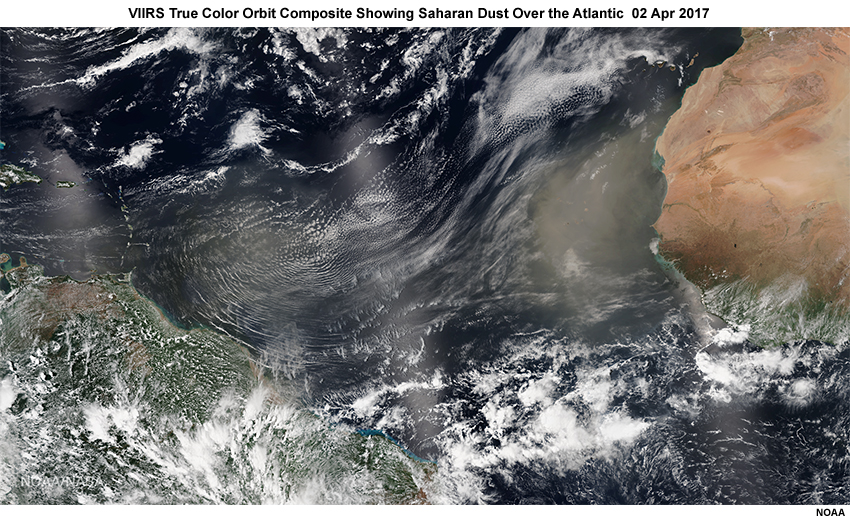
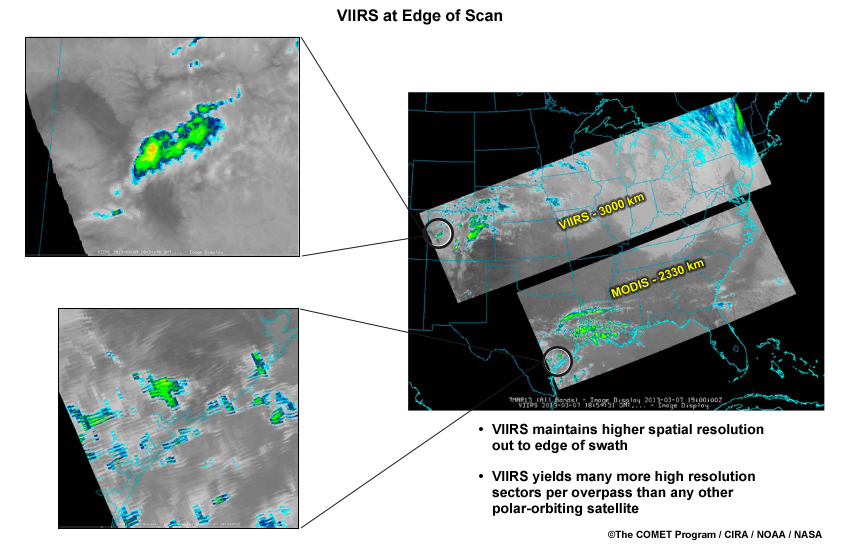
MODIS has a swath width of 2330 km, often leaving gaps between orbits. VIIRS has a wider swath width of 3000 km, eliminating orbital gaps.
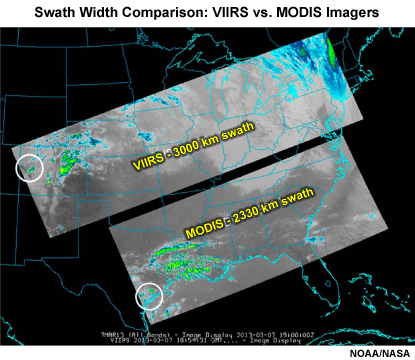
Note: The two white circled areas are used for comparison of spatial resolution at swath edge which will be discussed later in the section titled Edge of Scan Improvements.
Look at this seamless True Color view of African dust moving across the Atlantic Ocean, made possible because of the overlap between consecutive satellite overpasses.
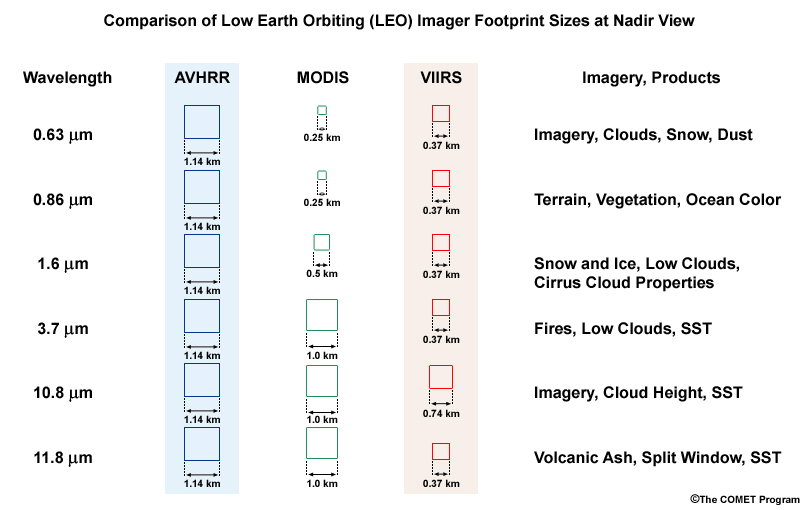
VIIRS High Resolution
High spatial resolution gives VIIRS imagery a special advantage over previous polar-orbiting imagers. Here are the VIIRS I bands (high resolution bands) in contrast to comparable bands from the predecessor operational AVHRR imager. The smaller the boxes, the higher the spatial resolution and the more detailed the products. VIIRS is particularly improved for the middle and far infrared bands (bottom three rows). For example, the pixels for these bands are about a third of a km on a side vs. roughly 1 km for MODIS and AVHRR. Next, an example of why high resolution in the infrared is so important.
Improved IR Resolution
High spatial resolution VIIRS IR data confers a quantitative advantage as shown by this comparison. GOES-13 longwave IR imagery, panels (a) and (b), shows a thunderstorm complex on the East Coast of Mexico. The coldest cloud top temperature is -79.7 °C. A MODIS IR view (panel c) zooms in further on the same complex with a minimum temperature of -86.9 °C. A VIIRS IR view (panel d) at about the same time, is composed of many more pixel elements and indicates a minimum of -90.6 °C. The smaller the pixel element, the smaller the area sampled, the less the spatial averaging, and the more accurate the measurement.
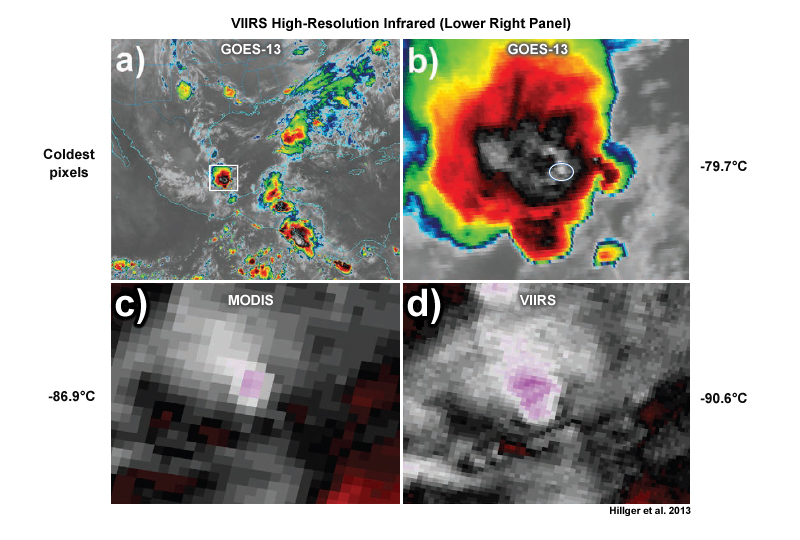
Cloud tops associated with deep convection as seen by (a) GOES-13 10.7 μm IR, (b) zoomed-in GOES-13 10.7 μm IR, (c) MODIS 11.0 μm IR, and (d) VIIRS 11.45 μm IR, at about 0815 UTC, June 6, 2012. An extreme close-up covering the white circled region (seen in the GOES-13 image (b)) from MODIS is shown in (c), and a similar close-up from VIIRS is shown in (d).
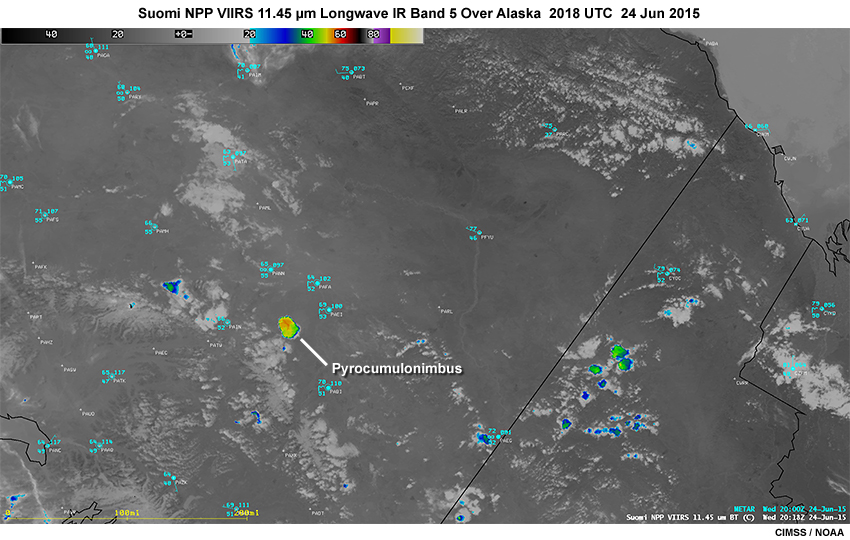
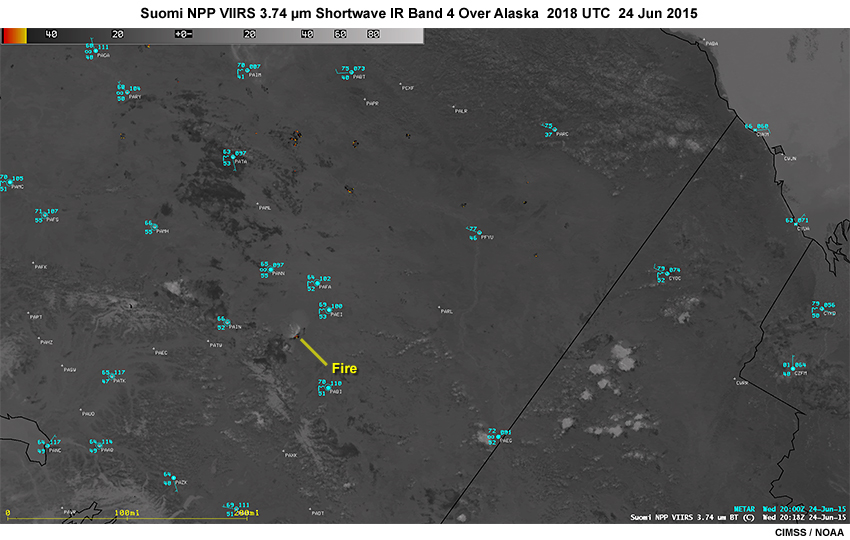
Improved IR Resolution » Pyrocumulonimbus Example
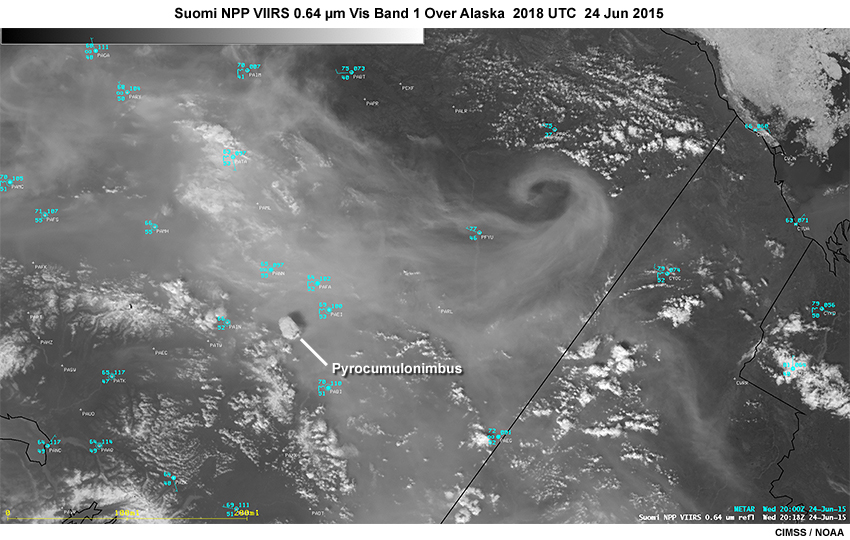
A timely overpass of VIIRS on board the Suomi NPP satellite captures a fire-induced pyrocumulonimbus cloud very soon after formation.
Click the tab corresponding to the 0.64 micrometer I1 visible imager band.
Mouse over the area of interest to zoom into the imagery.
In the visible image the pyroCb casts a large shadow on top of the dense smoke layer on the visible image. Considerable smoke from recent fires surrounds the pyroCb, confirmed by nearby surface reports (visibility at Fairbanks [PAFA] was reduced to 3/4 of a mile).
Click the tab corresponding to the 11.45 micrometer I5 longwave IR imagery band.
The longwave IR shows the elevated pyroCb cloud tops in color. The coldest brightness temperature of the cloud top is -56 °C, corresponding to a an elevation of about 10.8 km.
Click the tab corresponding to the 3.74 micrometer I4 shortwave IR imagery band.
The high resolution fire band image shows hot spots with pixels in black, yellow and red. It’s this ability to display features at high resolution, particularly for the IR bands, that distinguishes VIIRS from predecessor imagers.
VIIRS I1 0.64 μm Vis Band
VIIRS I5 11.45 μm Longwave IR Band
VIIRS I4 3.74 μm Shortwave IR Fire Band
Edge of Scan Improvements
VIIRS has an additional advantage that ensures high resolution imagery across an entire data swath. Traditional polar orbiter imaging data swaths are high resolution only at nadir (directly below the satellite) where pixel size is smallest. As the viewing angle increases toward the edge of scan, pixels grow and the resolution degrades.
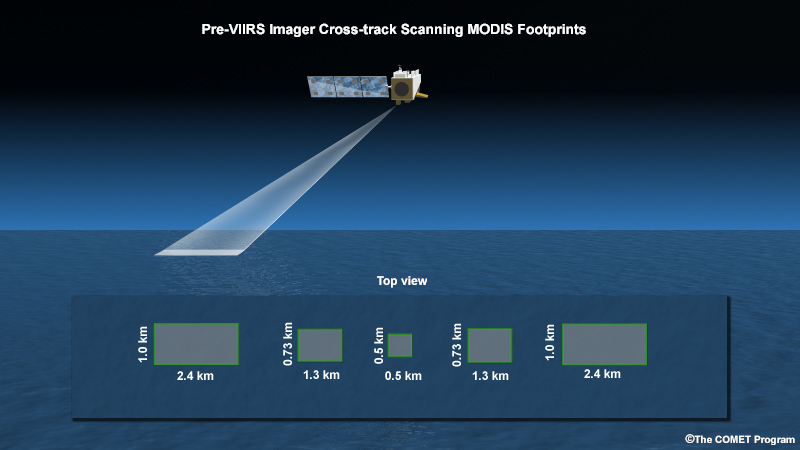
Notice in this figure that both the blue AVHRR and green MODIS pixels at the edge of the scan have expanded greatly compared to the nadir view. The VIIRS pixel size and shape (in red) however, are conserved as we look toward the edge of the scan.
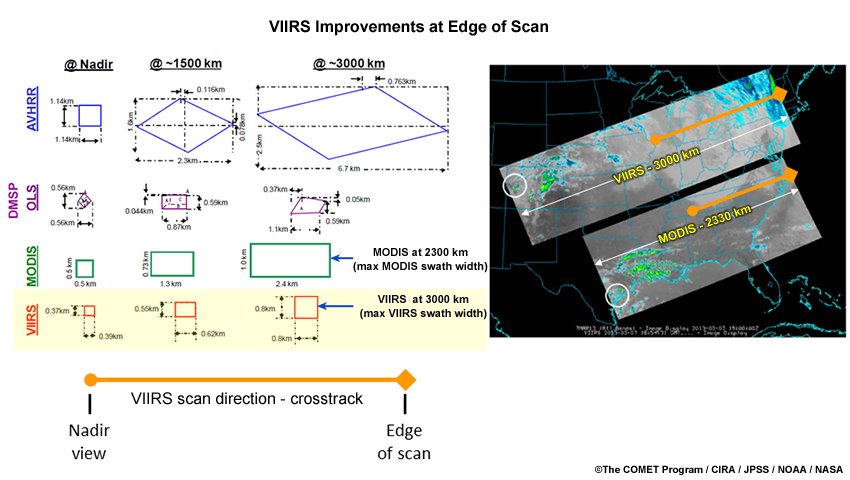
What is the effect on image quality in the VIIRS and MODIS swaths we just examined? If we zoom within the black circled area on the VIIRS swath, we see a crisp rendering of cloud features. But for MODIS, clouds have a pixelated, distorted appearance at the edge of the swath. The broader swath width and pixel size preservation means that a VIIRS swath can be sectorized into many more high resolution scenes than from MODIS or any other previous polar-orbiting weather satellite imager. VIIRS allows you to resolve smaller features like new convection, cloud top features, new fires and hot spots, swollen rivers, volcanic eruptions, SST features, city landscapes, and ice floes to name a few.
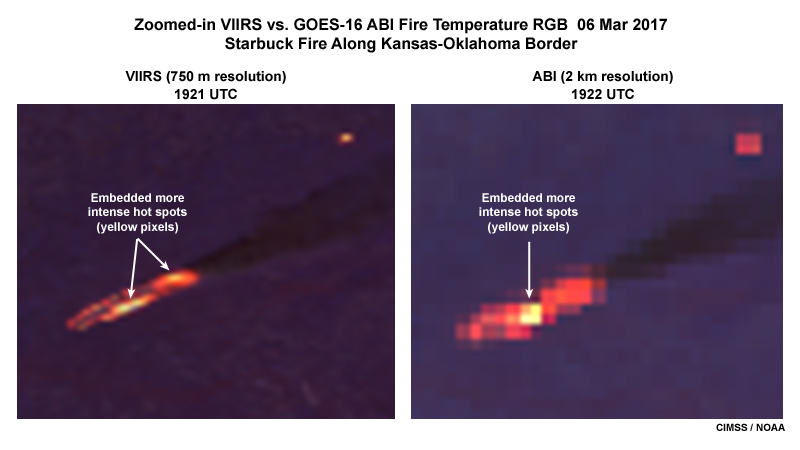
Comparison to GOES Imagery
With its high spatial resolution, VIIRS provides an important reality check on geostationary imagery, especially when imaging smaller features. We’ll compare both at the same time using the fire temperature product, a Red/Green/Blue (RGB) composite, based on the heat sensitive bands at 1.6, 2.5 and 3.7 micrometers. It does not provide actual flame or terrain temperature, but distinguishes fires which are relatively cool in red (e.g., smoldering), fires of medium intensity in yellow, and the hottest in white.
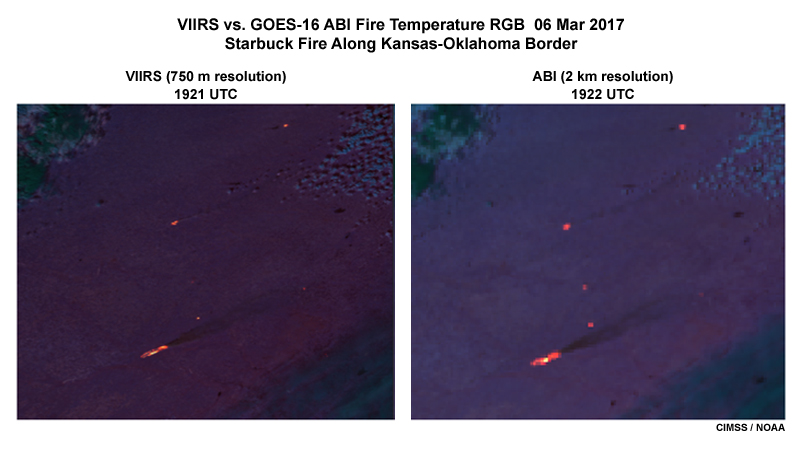
Fires regions are so small that considerable zooming is often required to view hotspots.
In this comparison of fire temperature along the Kansas-Oklahoma border, notice how the higher resolution VIIRS product better delineates the fire compared to the lower resolution GOES-16 ABI product. In particular, the larger GOES pixels make the fire seem larger than it is. Notice that the VIIRS product has several yellow pixels indicating hotter fire regions, including one embedded in a fire in the upper right portion of the image. But GOES-16 shows only one concentrated region of yellow pixels within the main complex, and none in the fire seen in the upper right.
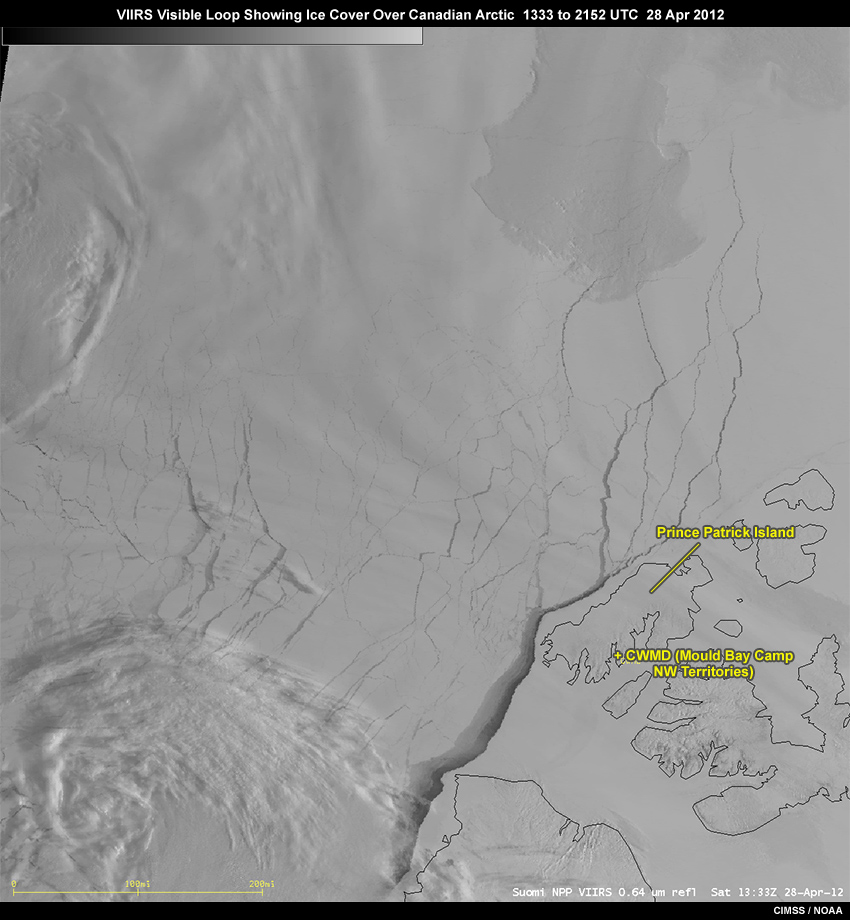
VIIRS at High Latitudes
High resolution VIIRS images are especially effective at higher latitudes over ice and snow. Clouds are often semi-transparent near the Poles allowing ice features to be seen through them. Over a period of nine hours, a lead widens dramatically to the west of Prince Patrick Island in the Canadian Arctic Archipelago. Notice that a fresh lead also opens to the north of the island. The lead openings are apparently forced by strong easterly winds over the region.
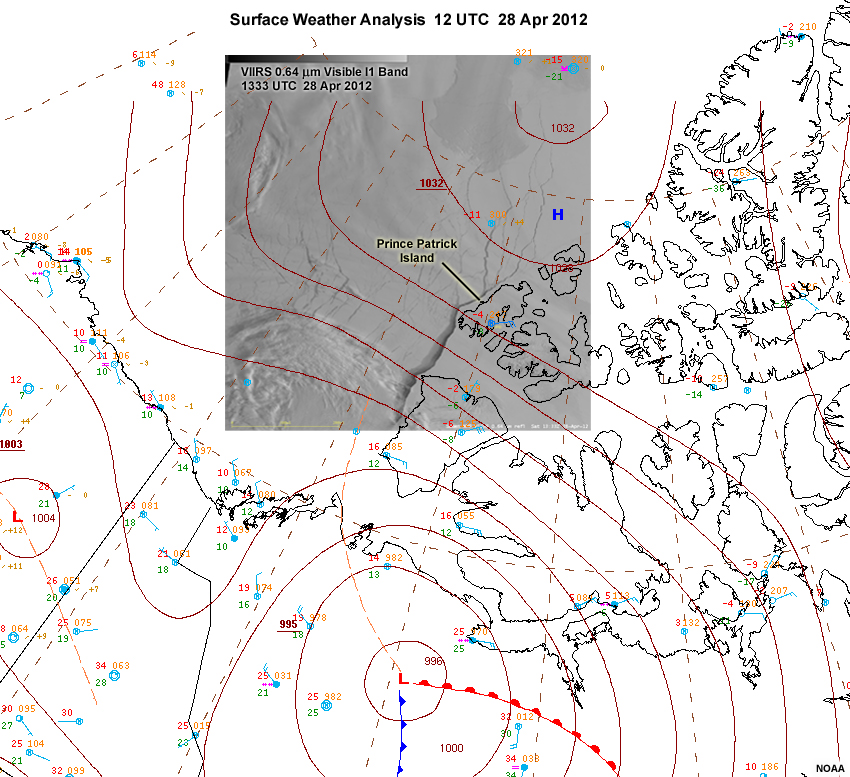
High temporal refresh, available at high latitudes due to overlapping orbits, means that loops can show important changes in cloud and surface features. High resolution scanning across the VIIRS swath also means that all images in a loop will appear sharp and detailed. This animation comes from just one VIIRS imager on a single day. Imagine when more than one VIIRS imager is orbiting; the loop can be longer and populated with even more frequent imagery.
RGB Products
RGB Products » Overview
Red-Green-Blue (RGB) products consolidate information from different spectral bands into a color composite that provides more information than any one band can provide. In many ways, an RGB image still looks like a single-channel image, but different colors now emphasize features a user finds important to interpret. RGBs have been developed to help with detection and monitoring of a number of phenomena, including sea and land surface features, microphysical cloud properties, deep convection, volcanic ash, airborne dust, fire and smoke, cloud vs. snow cover, low clouds at night, and air mass properties. Some RGBs use only daytime solar bands, some work only at night, while others work around the clock.
VIIRS, with its high spatial resolution and strategically placed spectral bands, offers unique opportunities for building many different RGBs. While RGBs may become more standardized in forecast offices for specific applications, display systems also allow forecasters to experiment independently to arrive at a product optimal for their region. In this section we’ll show a few examples of popular choices.
For more information on creating and using RGBs, see the COMET module, Multispectral Satellite Applications: RGB Products Explained.
RGB Products » Volcanic Eruptions
The Pavlof volcano erupted on March 27, 2016 in the Aleutian Islands and spread ash plumes northward across much of Alaska, canceling or re-routing many air flights.
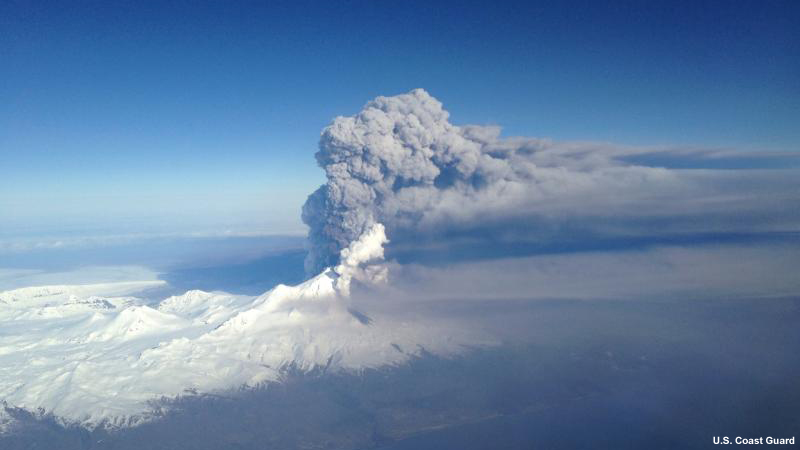
Alaska’s Pavlof volcano erupted on March 27, 2016, spewing a 20,000 foot high ash plume. Mount Pavlof is located in the Aleutian Mountain Range on the Alaska Peninsula and has been one of the most active volcanoes in the United States since 1980.
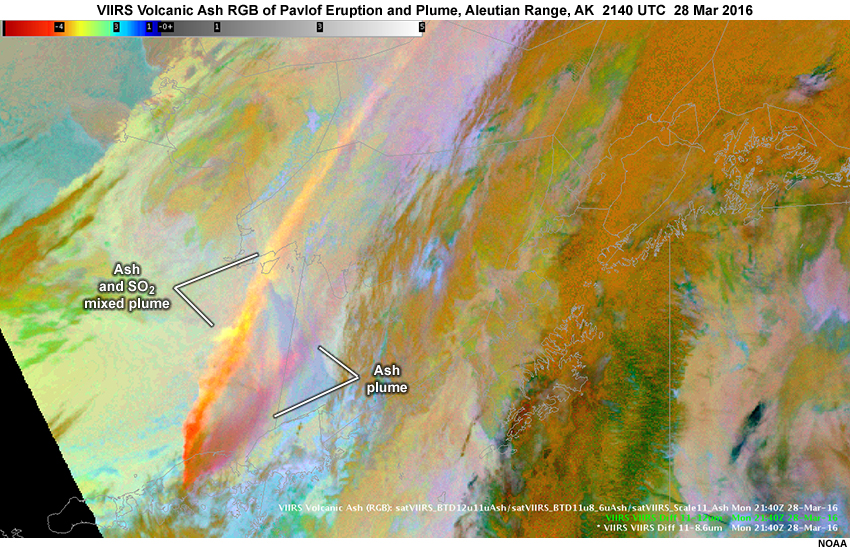
The image shows the VIIRS volcanic ash RGB image product, a complex combination of several VIIRS infrared bands. It reveals the volcanic effluent channeled into two separate plumes. They appear to be at different heights and composed of either ash, SO2, cloud ice, or even a mixture of these three constituents.
The violet color of the eastern plume indicates ash. The more yellowish color of the plume to the west indicates that sulfur dioxide is mixed with ash. This RGB does not use solar bands and therefore operates both day and night.
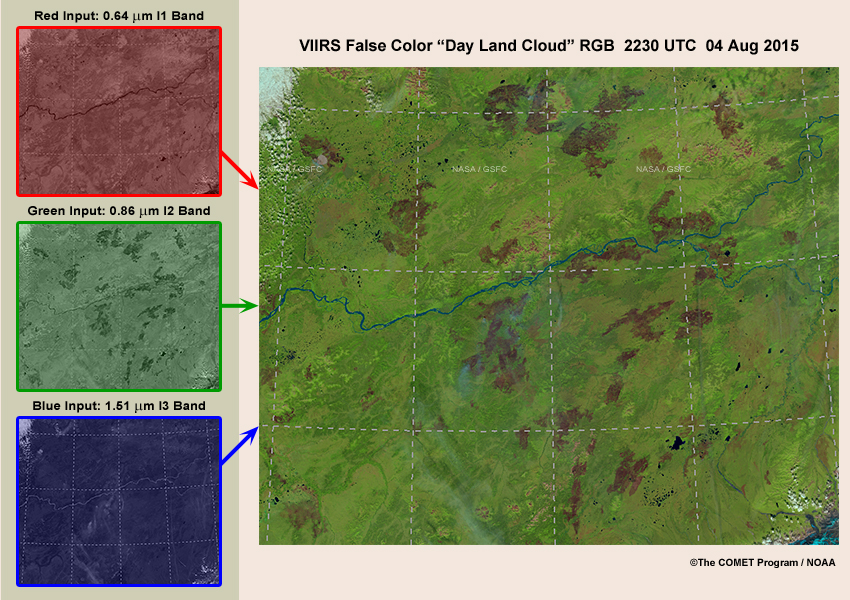
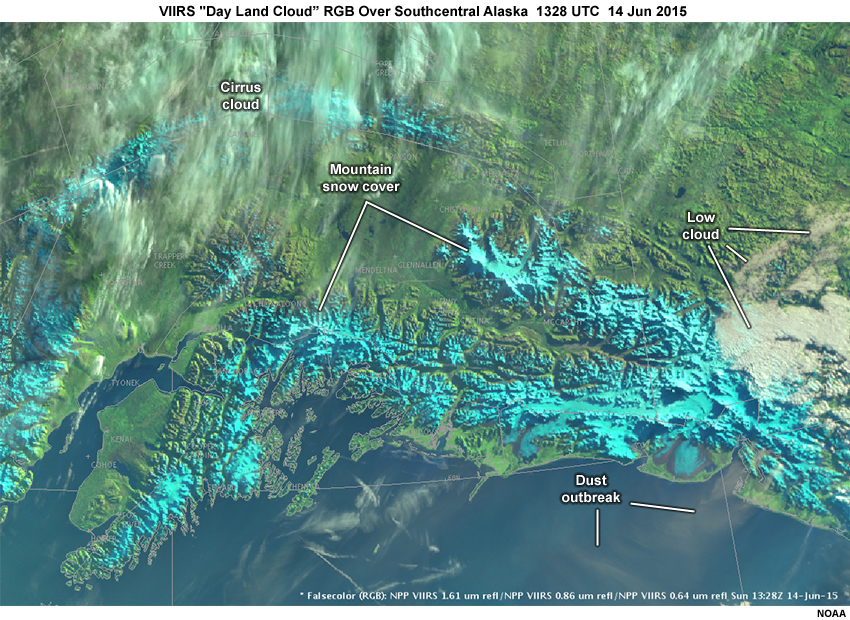
RGB Products » Day Land Cloud RGB
A daytime RGB product called the “Day Land Cloud RGB” (sometimes called the “Natural Color RGB”) vividly shows snowy mountains, contrasting clouds, green vegetation, deserts, burn scars, and burning fires. This example is over coastal Alaska including the Anchorage region on the left. Snow covered mountains appear cyan and contrast easily with whitish low clouds over the slopes. Vegetation appears in green. This is a daytime all-purpose RGB especially useful to show the presence of snow cover. Unlike in visible imagery, the RGB shows low clouds vividly against snow cover.
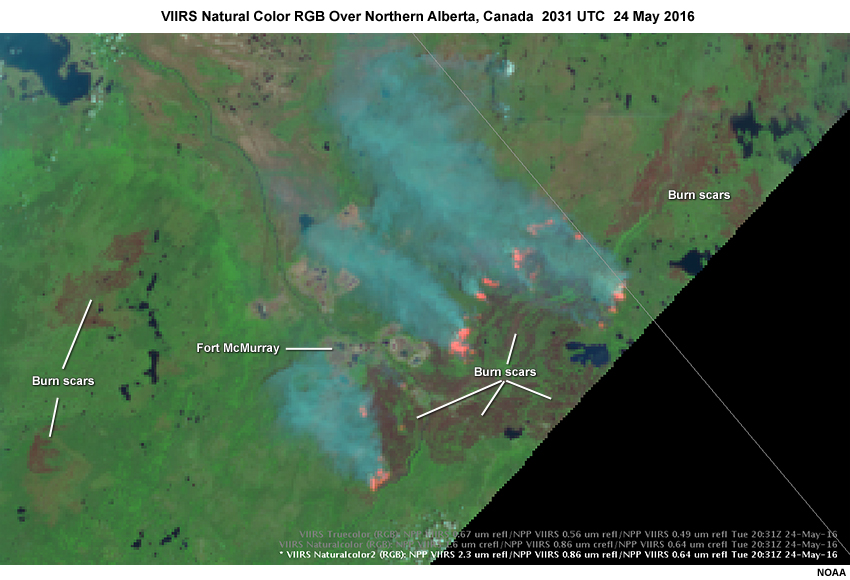
A variation of the Day Land Cloud RGB overlays fires in pink, shown here over northern Alberta, Canada, in the region of the Fort McMurray wildfires on May 24, 2016. Dark reddish areas are burn scars marking past fires. Smoke appears in shades of cyan.
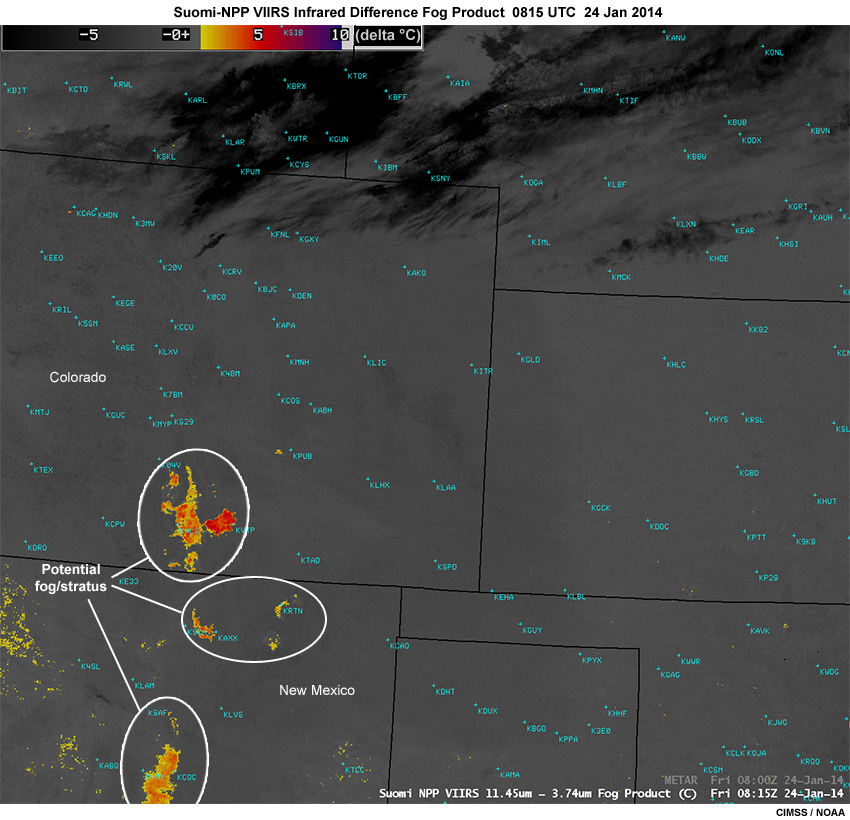
IR Fog Product
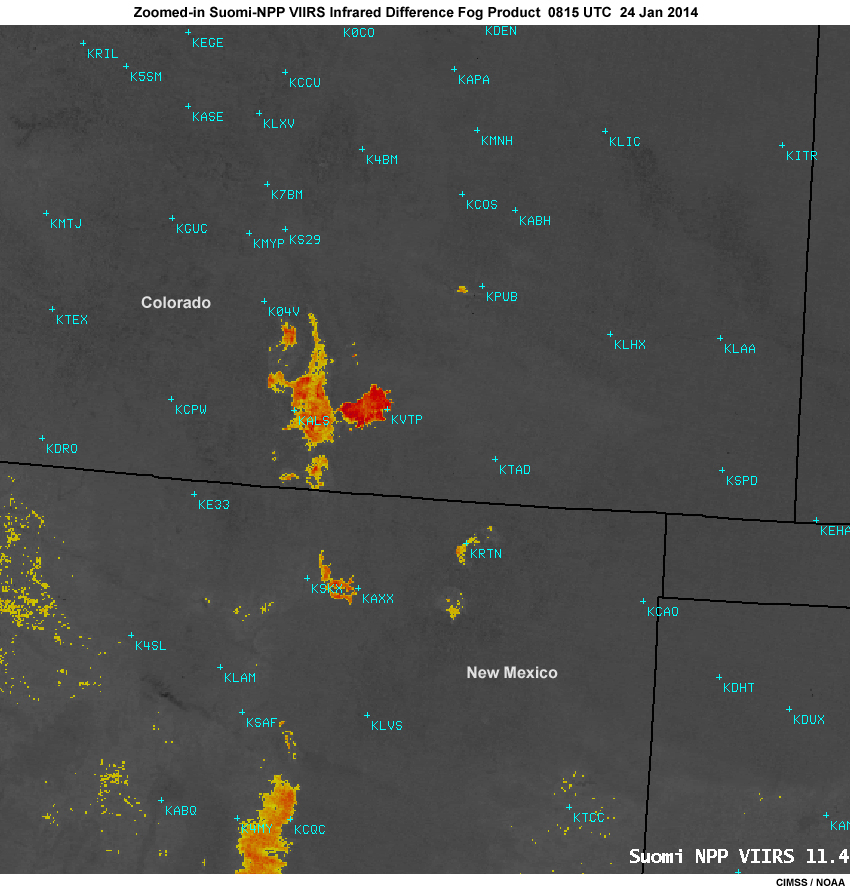
Click the tab corresponding to the VIIRS IR Fog Product.
The VIIRS infrared fog product gives very high resolution nighttime depiction of fog and low stratus.
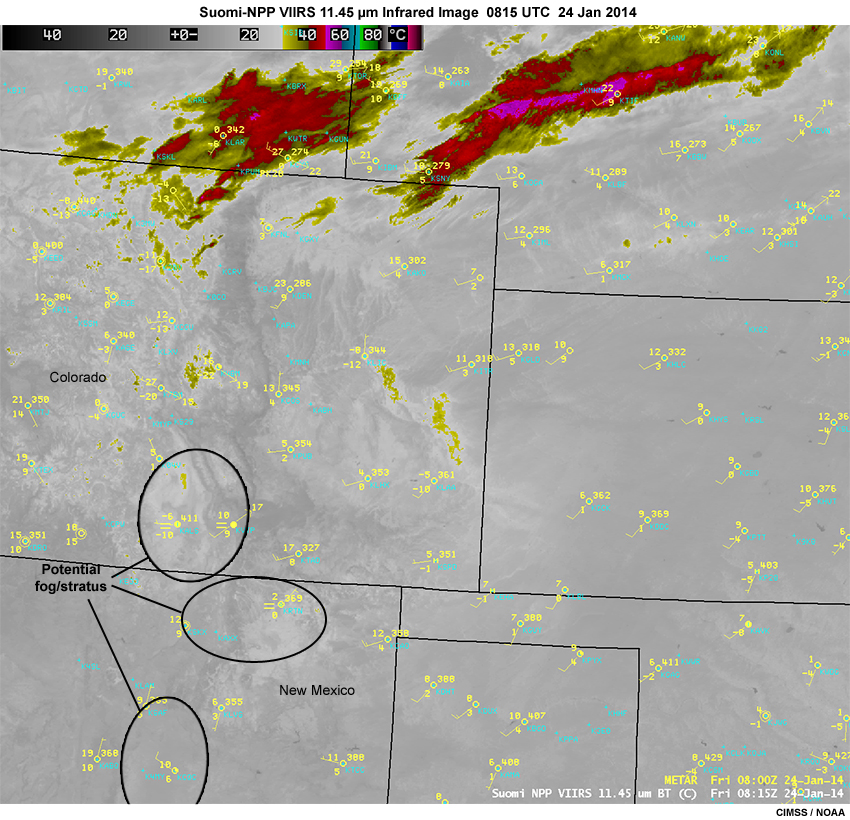
Next, click the tab corresponding to the VIIRS enhanced 11.45 micrmeter IR image.
We cannot get this information from the longwave IR image alone. Centered in the southern plains, the iR image shows varied thermal detail over complex terrain but no fog.
Now click the tab corresponding to the VIIRS Day Night Band.
The Day Night Band image shows a huge white area over eastern Colorado and surrounding states, but this region turns out to be snow cover illuminated by moonlight, not fog.
VIIRS IR Fog Product
VIIRS 11.45 μm IR Band
VIIRS Day Night Band
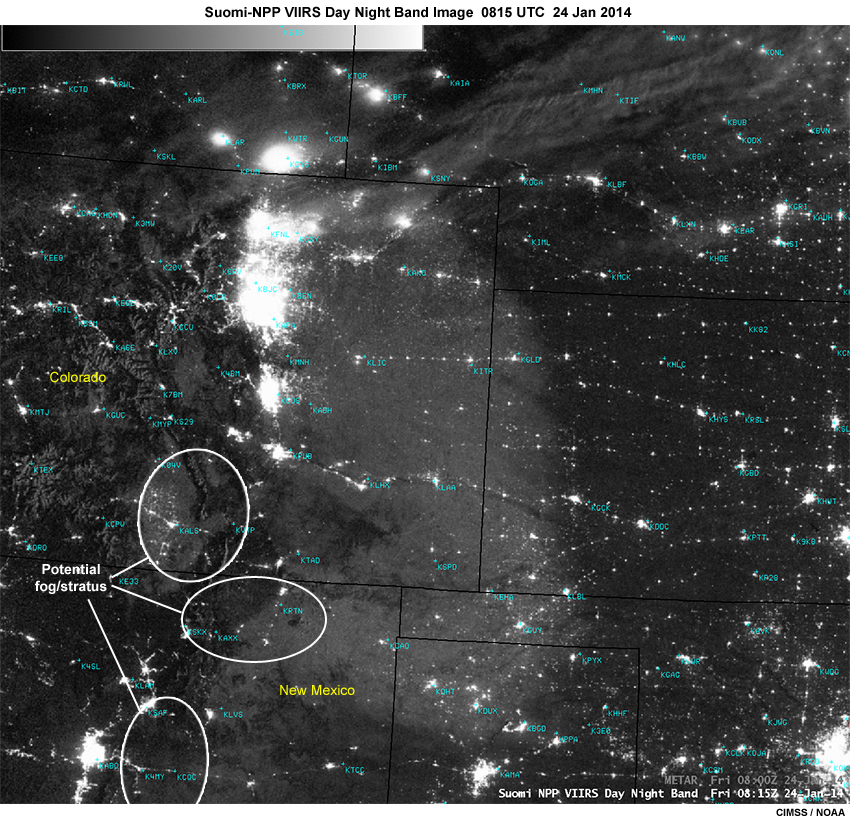
The fog product, based on the pixel-by-pixel difference of two infrared bands, reveals small areas of low clouds or fog in orange and red especially in southern Colorado.
River Flooding
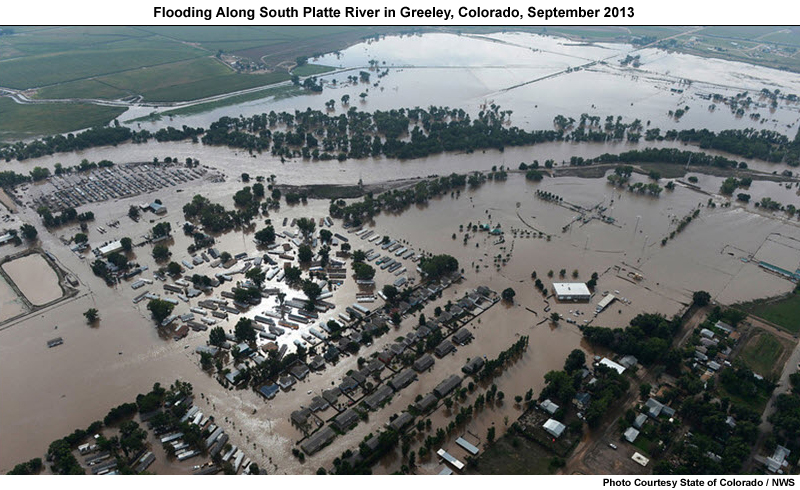
The South Platte River, flowing northeastward across northeastern Colorado, rose dramatically from about the 12th through 19th of September 2013. The rise was caused by several days of historically heavy rainfall and runoff along the northern Front Range foothills of the Colorado Rockies. The photo shows Fort Morgan Colorado after the flood surge had passed. The bright coloration, suggesting a high sediment content, is one of the factors in satellite detection as we’ll see.
The optimal band for viewing river flooding events is the 1.6 um near-IR snow/ice band (or high resolution I3 band). Land is usually quite reflective in this band, producing excellent contrast with the dark river water.
Drag the slider to compare the 0.64 micrometer visible band image with the corresponding 1.6 micrometer near-IR band.
Notice how well the 1.6 micrometer band delineates the advancing flood surge waters from surrounding land.
The visible image hardly shows the river surge because the land vs. water contrast is missing. The problem is that sediment is particularly bright in the visible, eliminating image contrast with dry river banks. The 1.6 micrometer band is much less sensitive to the sediment coloration, making for darker water and improved contrast with the river banks.
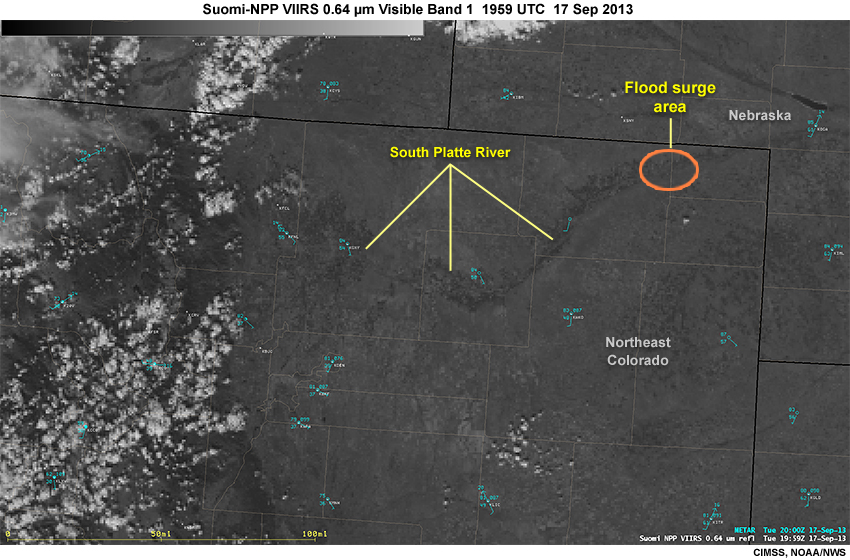
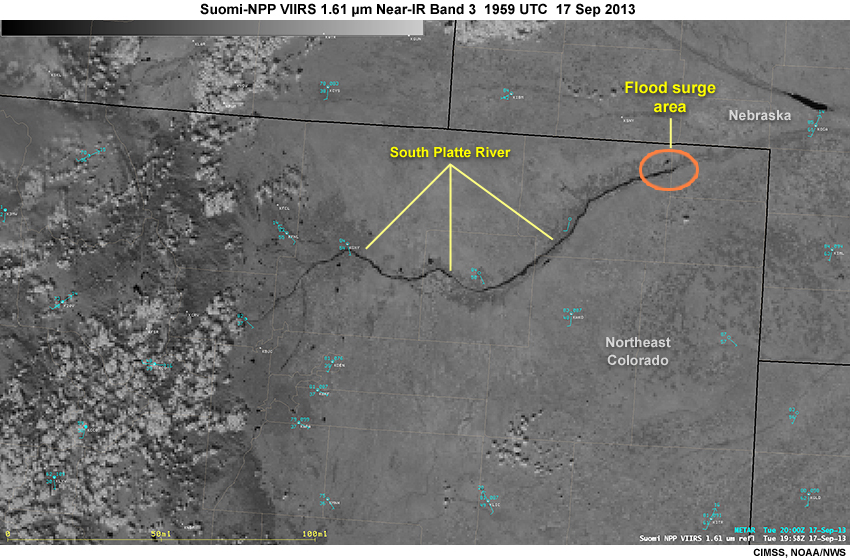
Zooming into the 1.6 micrometer image, we see the black water signal, marking the rising waters approaching Julesburg, Colorado, a town just downriver. Time of the image is around 2 PM MDT (or 20 UTC).
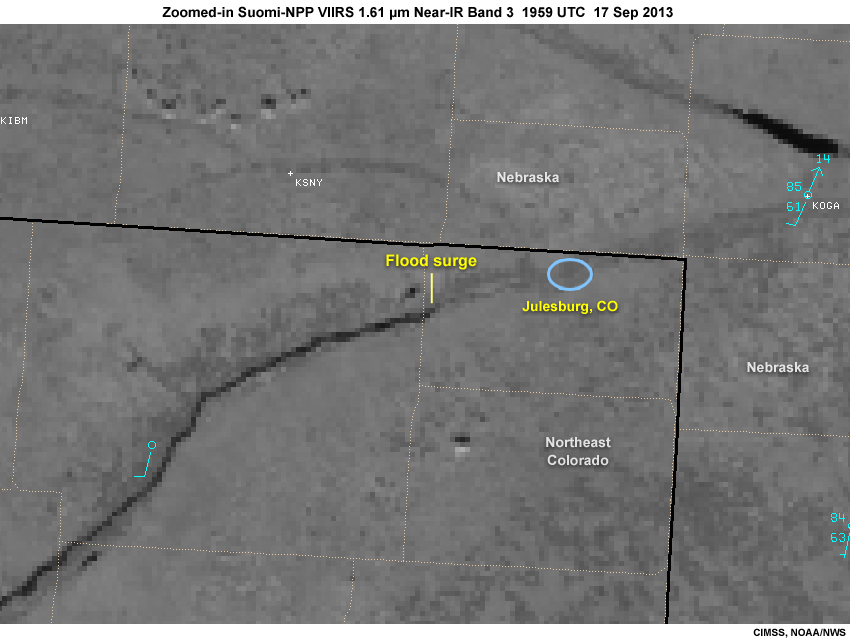
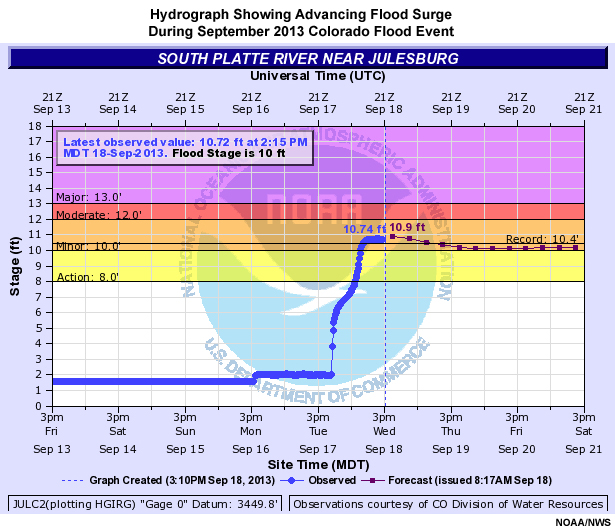
A hydrograph shows the onset of the floodwaters at the Julesburg Colorado site about eleven hours later at 1 am MDT (or 07 UTC on September 18), that ultimately rose above the station’s previously recorded highest stage.
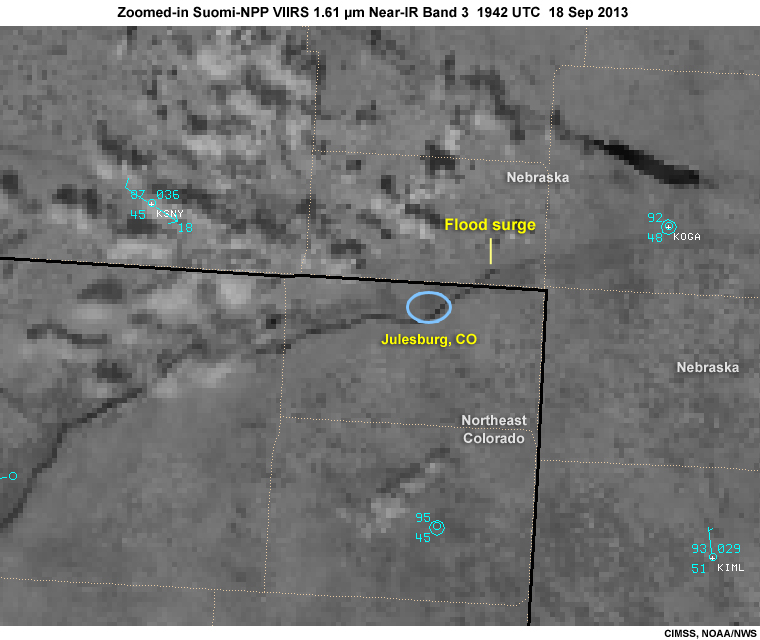
By the next afternoon flood waters had reached into Nebraska. Instead of viewing the 1.6 micrometer image by itself, users can zoom into the Daytime Land Cloud RGB which contains the 1.6 micrometer band as one of its inputs. An important limitation to keep in mind is cloud cover, which can mask surface features and limit use of this technique for flood detection.
The JPSS Program has also supported development of quantitative VIIRS-based products specifically for detection and tracking of river flooding conditions. For more information, see the COMET module, JPSS River Ice and Flood Products.
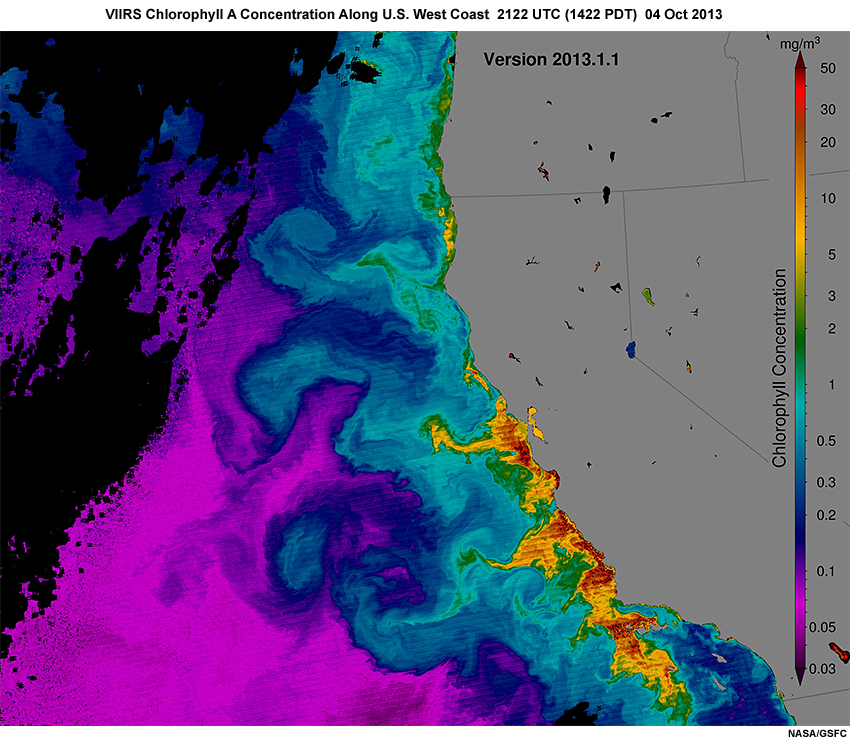
Ocean Color
Ocean Color is the faint coloration in water due to phytoplankton containing the pigment chlorophyll, sediments, or colored dissolved organic material. VIIRS now provides routine operational support based on prototype products demonstrated earlier by MODIS.
On October 4, 2013, VIIRS captured blooming phytoplankton over the Eastern Pacific Ocean off the California coast, shown in this ‘chlorophyll a’ concentration product. Red and yellow phytoplankton swirls correspond to the motions of currents along the coast of California and western Mexico. Northerly along-shore breezes often push ocean surface waters away from the coast. As a result, cooler, nutrient-rich waters rise to take their place, called upwelling. The increased phytoplankton activity along the coast represents the fruits of this nutrient rich upwelled water.
Summary
- VIIRS is the operational replacement for AVHRR which incorporates MODIS research breakthroughs
- VIIRS is especially advantageous in polar regions with frequent overpasses enabling movie loops
- Compared to MODIS, VIIRS has a wider data swath with sharper, more detailed images across the scan
- Spatial resolution for VIIRS near, middle, and far infrared bands is significantly improved
- VIIRS has 22 bands enabling a plethora of multispectral applications
- VIIRS data can be used to produce a number of color products for specific applications, such as fire detection, river flooding, cloud properties, ice and snow cover properties, and land surface characteristics
- VIIRS has the required visible bands for producing vivid True Color Imagery, a popular capability pioneered by MODIS
- VIIRS has advanced fire detection and analysis capabilities useful for comparing against fire detection products from the GOES-R series ABI imager
- VIIRS has a Day Night Band which produces vivid images by moonlight and in the darkest night. For more information on the DNB, see the companion lesson, SatFC-J: VIIRS Day/Night Band.
Resources
VIIRS Overview and Imagery Examples Following Launch of Suomi NPP in Late 2011
Hillger, D. W., T. Kopp, T. Lee, D. T. Lindsey, C. J. Seaman, S. D. Miller, J. Solbrig, S. Q. Kidder, S. Bachmeier, T. Jasmin, and T. Rink, 2013: First-light imagery from Suomi NPP VIIRS. Bull. Amer. Met. Soc., 94, 1019-1029. http://journals.ametsoc.org/doi/abs/10.1175/BAMS-D-12-00097.1
Hillger, D. W., C. J. Seaman, C. Liang, S. D. Miller, D. T. Lindsey, and T. Kopp, 2014: Suomi NPP VIIRS imagery evaluation, J. Geophys. Res. Atmos., 119 (11), 6440-6454. http://onlinelibrary.wiley.com/doi/10.1002/2013JD021170/abstract
Hillger, D. W., T. Kopp, C. J. Seaman, S. D. Miller, D. T. Lindsey, E. Stevens, J. Solbrig, W. Straka III, M. Kreller, A. Kuciauskas, and A. Terborg, 2016: User validation of VIIRS satellite imagery. Remote Sens., 8 (1, 11). http://www.mdpi.com/2072-4292/8/1/11
Online Learning Resources
CIRA/VISIT Teletraining Session: Use of VIIRS Imagery for Tropical Cyclone Forecasting, John Knaff and Galina Chirokova, 2015
COMET Module: Introduction to VIIRS Imaging and Applications. http://meted.ucar.edu/training_module.php?id=1075
COMET Module: Imaging with VIIRS: A Convergence of Technologies and Experience, 2nd Edition. http://meted.ucar.edu/training_module.php?id=953
Online Imagery, Products, Discussions, and Information
CIMSS Blog
http://cimss.ssec.wisc.edu/goes/blog/archives/category/viirs
VIIRS Imagery from SPoRT
http://weather.msfc.nasa.gov/sport/
VIIRS Imagery and Visualization Team
http://rammb.cira.colostate.edu/projects/npp/blog/
VISIT Meteorological Interpretation Blog
Contributors
COMET Sponsors
MetEd and the COMET® Program are a part of the University Corporation for Atmospheric Research's (UCAR's) Community Programs (UCP) and are sponsored by NOAA's National Weather Service (NWS), with additional funding by:
- Bureau of Meteorology of Australia (BoM)
- Bureau of Reclamation, United States Department of the Interior
- European Organisation for the Exploitation of Meteorological Satellites (EUMETSAT)
- Meteorological Service of Canada (MSC)
- NOAA's National Environmental Satellite, Data and Information Service (NESDIS)
- NOAA's National Geodetic Survey (NGS)
- National Science Foundation (NSF)
- Naval Meteorology and Oceanography Command (NMOC)
- U.S. Army Corps of Engineers (USACE)
To learn more about us, please visit the COMET website.
Project Contributors
Program Manager
- Amy Stevermer — UCAR/COMET
Project Meteorologist
- Patrick Dills — UCAR/COMET
Science Advisors
- Tom Lee — UCAR/COMET
- Patrick Dills — UCAR/COMET
Graphics/Animations
- Steve Deyo — UCAR/COMET
Multimedia Authoring/Interface Design
- Gary Pacheco — UCAR/COMET
Audio/Video Editing/Production
- Dolores Kiessling — UCAR/COMET
- Gary Pacheco — UCAR/COMET
- Sylvia Quesada — UCAR/COMET
Audio Narration
- Auliya McCauley-Hartner — UCAR/COMET
COMET Staff, February 2018
Director's Office
- Dr. Elizabeth Mulvihill Page, Director
- Tim Alberta, Assistant Director Operations and IT
- Paul Kucera, Assistant Director International Programs
Business Administration
- Lorrie Alberta, Administrator
- Auliya McCauley-Hartner, Administrative Assistant
- Tara Torres, Program Coordinator
IT Services
- Bob Bubon, Systems Administrator
- Joshua Hepp, Student Assistant
- Joey Rener, Software Engineer
- Malte Winkler, Software Engineer
Instructional Services
- Dr. Alan Bol, Scientist/Instructional Designer
- Tsvetomir Ross-Lazarov, Instructional Designer
International Programs
- Rosario Alfaro Ocampo, Translator/Meteorologist
- Bruce Muller, Project Manager
- David Russi, Translations Coordinator
- Martin Steinson, Project Manager
Production and Media Services
- Steve Deyo, Graphic and 3D Designer
- Dolores Kiessling, Software Engineer
- Gary Pacheco, Web Designer and Developer
- Sylvia Quesada, Production Assistant
Science Group
- Dr. William Bua, Meteorologist
- Patrick Dills, Meteorologist
- Bryan Guarente, Instructional Designer/Meteorologist
- Matthew Kelsch, Hydrometeorologist
- Erin Regan, Student Assistant
- Andrea Smith, Meteorologist
- Amy Stevermer, Meteorologist
- Vanessa Vincente, Meteorologist