Introduction
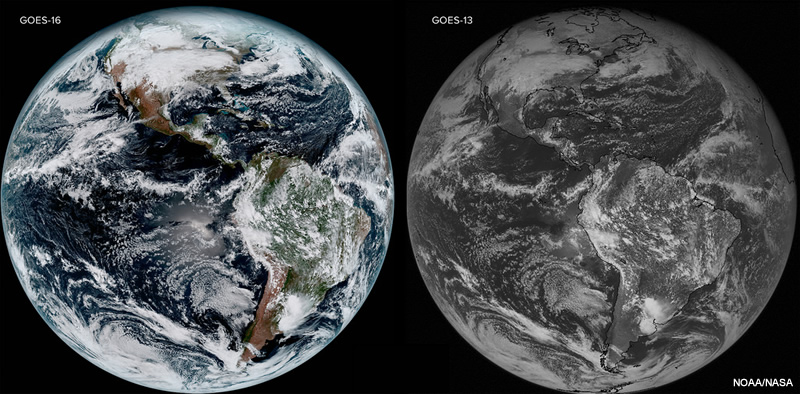
GOES-16, first in the GOES-R series, launched in November 2016 and now provides 16 multispectral bands of satellite data. Visible imagery is now available at 0.5km spatial resolution and infrared imagery at 2.0km resolution (both are four times higher than legacy GOES). Scans every five minutes at the CONUS scale represent a three times greater temporal resolution compared to legacy GOES. In this lesson, we will harness GOES-16’s increased temporal and spatial resolutions to identify convective development and intensity signatures, and compare the experience to using legacy GOES products.
By the end of this lesson, you will be able to:
- Identify common convective development and intensity signatures on longwave IR and visible satellite imagery.
- Observe the difference in resolution between new GOES-16 and legacy GOES-13/15 visible and infrared imagery, and be able to describe the convective signature advantages that GOES-16 provides.
Common Features and Signatures
We will look for several common features and signatures that can indicate convective initiation, intensification and severity.
If you are unfamiliar with any of the following features and signatures and how to identify them on visible and infrared satellite imagery, click through the tabs for examples: cumulus congestus, orphan anvils, overshooting tops (OTs), enhanced-V, cloud-top temperature (CTT) and cloud-top cooling rate (CTC). Please also see the references list at end of this lesson for more information about signatures for convection.
Congestus & Orphans
Diagnosis of cumulus congestus on visible imagery is important for convective nowcasting. Boundaries where stable airmasses are adjacent to regions of low-level, wind-parallel cumulus streets are common regions of cumulus congestus and eventual convective development. Look for shadows from cumulus that extend vertically above a surrounding cumulus field, along with the extension of cumulus horizontally. Occasionally, in strongly-capped areas, surface-based parcels will ascend to create anvils that quickly shear off and become ‘orphaned’, as seen in the initial loop. These are important clues that the cap may soon break.
Anvils
The development, and sometimes quick dissipation of anvil cirrus and cirrostratus is an important indicator of updraft strength and cap strength. Initially, cumulus congestus may develop rapidly to produce a shield of stratocirrus that can be identified by its smoother, spreading appearance and any shadows it is casting. On IR imagery, the anvil will contain concentric rings of uniform temperatures that decrease toward the center and/or location of the overshooting top(s). Gravity waves may also be apparent on both bands.
OTs
Overshooting tops indicate very strong updrafts, and monitoring their position, intensity and evolution can help identify areas most prone to severe weather damage, especially hail. They appear on visible imagery as highly textured pulses that bubble and persist above the surrounding anvil, and are usually less than about 15 km in diameter. A lower sun angle can help identify the texture of the tops. On longwave IR, overshooting tops appear collocated with the textured bubbling on visible imagery, and have the coldest brightness temperatures, exhibiting persistent differences of at least 6°C or 7°C compared to the surroundings. In highly-sheared environments, overshooting tops are generally found at the back edge of supercells and leading edge of MCSs.
Enh-V
An enhanced-V signature indicates upper-level flow around a very strong updraft. It manifests as an area of colder temperatures that extend around and downwind from the updraft, or overshooting top. The vertex of the V is centered at the overshooting top, which usually contains the coldest brightness temperature. Often, a warmer area is located directly downwind of the updraft.
CTT & CTC
Cloud top temperatures are valuable indicators of storm strength, and observing the temperature change can reveal rapid storm intensification and severe damage potential. Cloud top temperatures of -60°C or colder generally indicate a very strong updraft, while a change of cloud top temperature of around -10°C over about 15 minutes indicates moderate growth that should be monitored. Strong cooling, between about -20°C/15 min and -50°C/15min often precedes severe weather surface damage by tens of minutes. Correspondingly, strong warming indicates that the updraft is weakening and the severe threat decreasing.
Example Case and Exercises
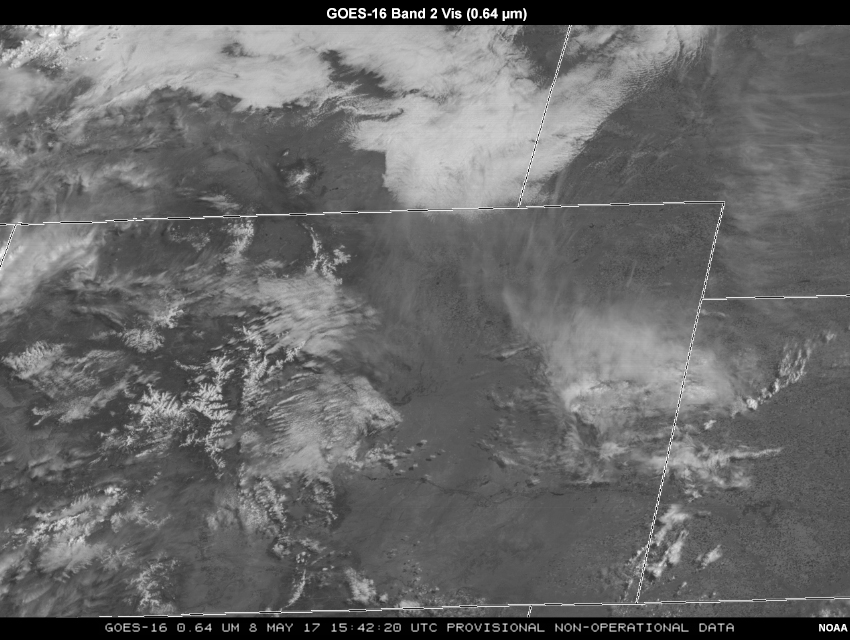
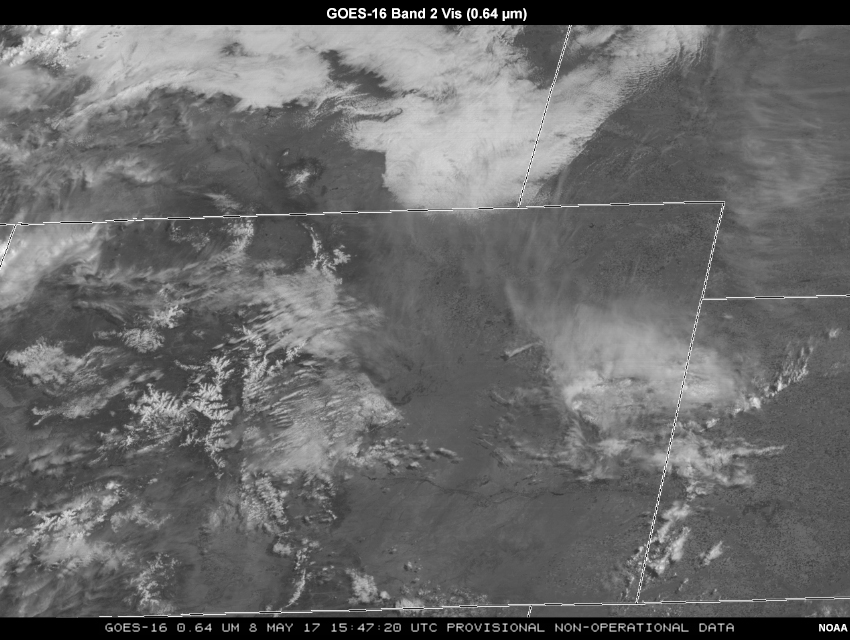
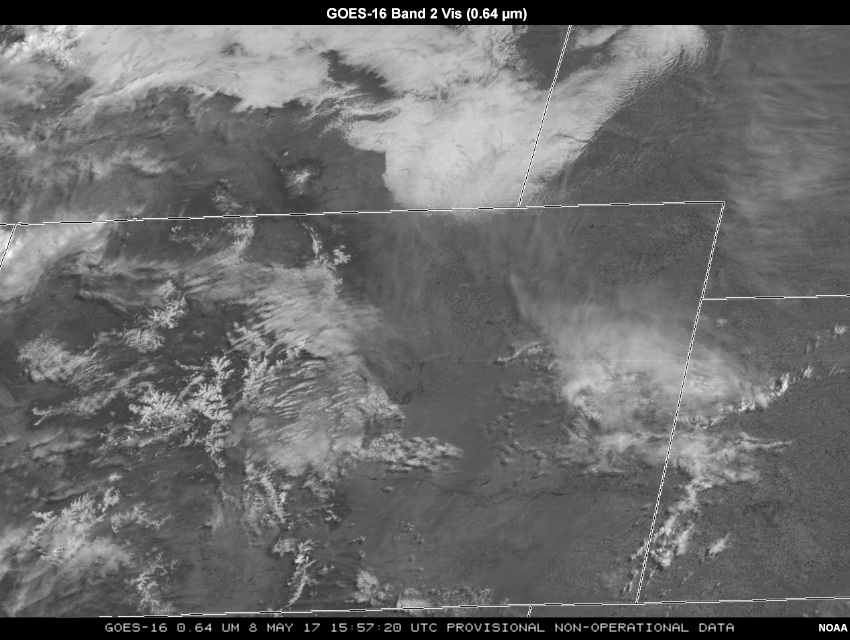
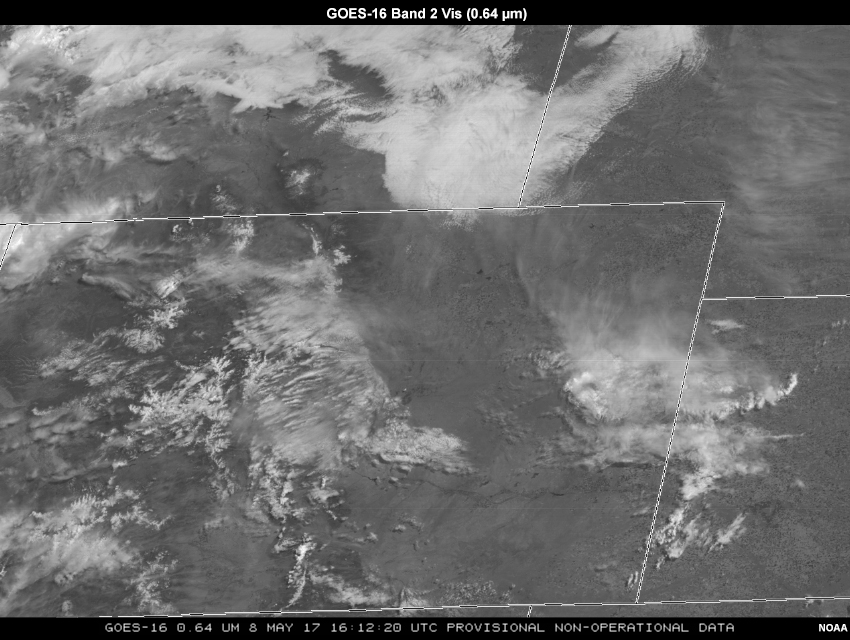
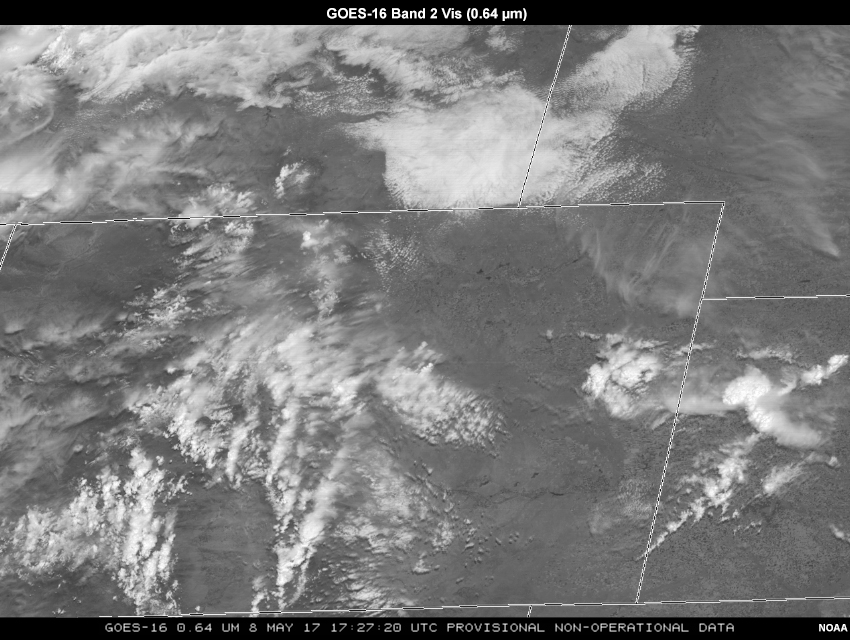
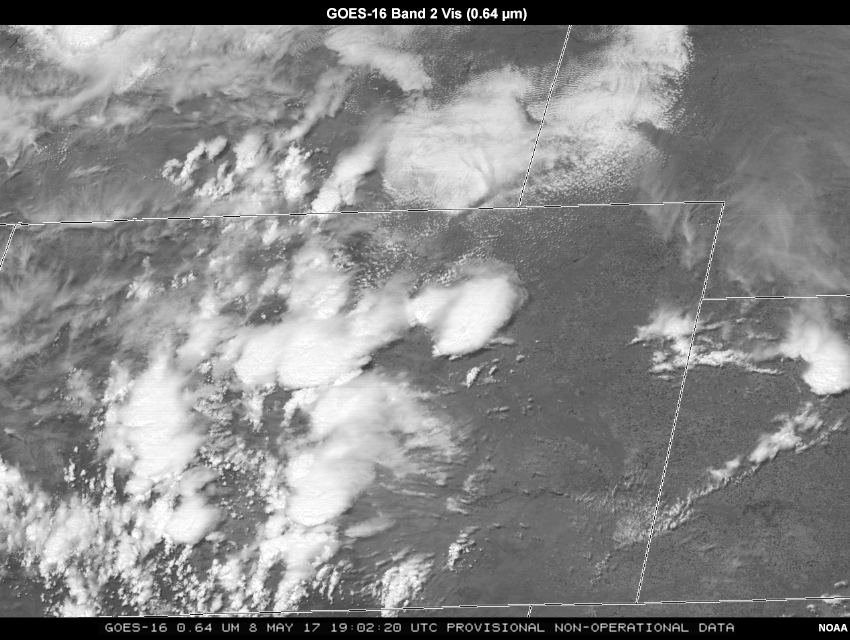
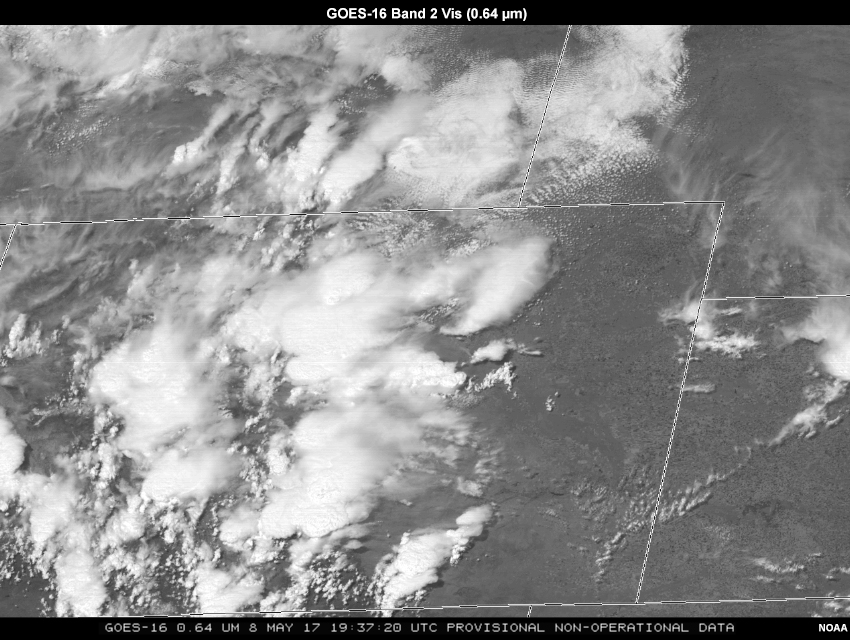
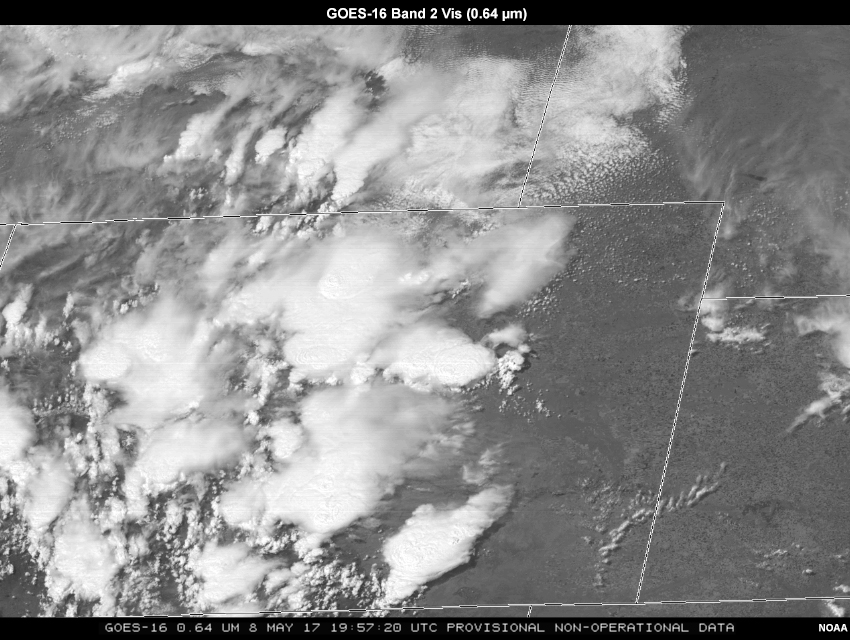
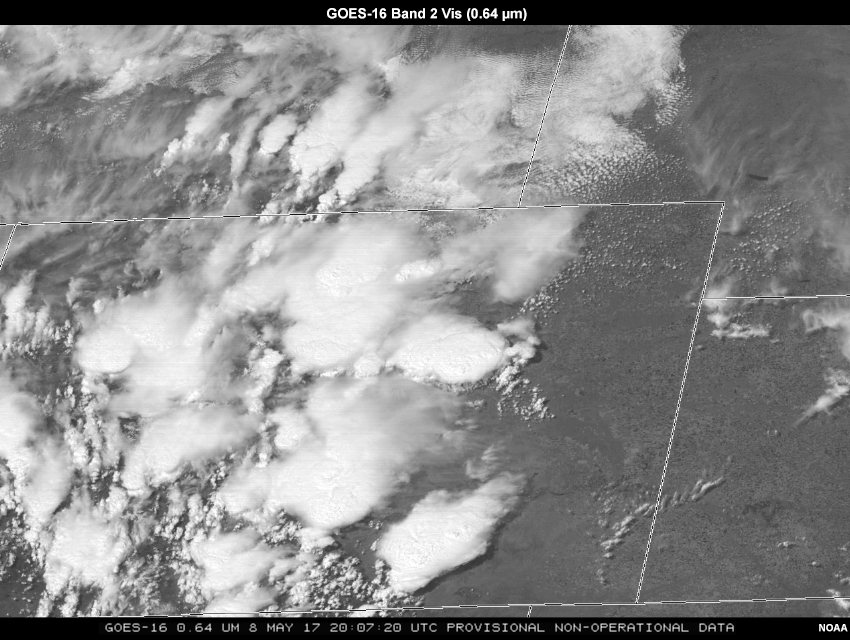
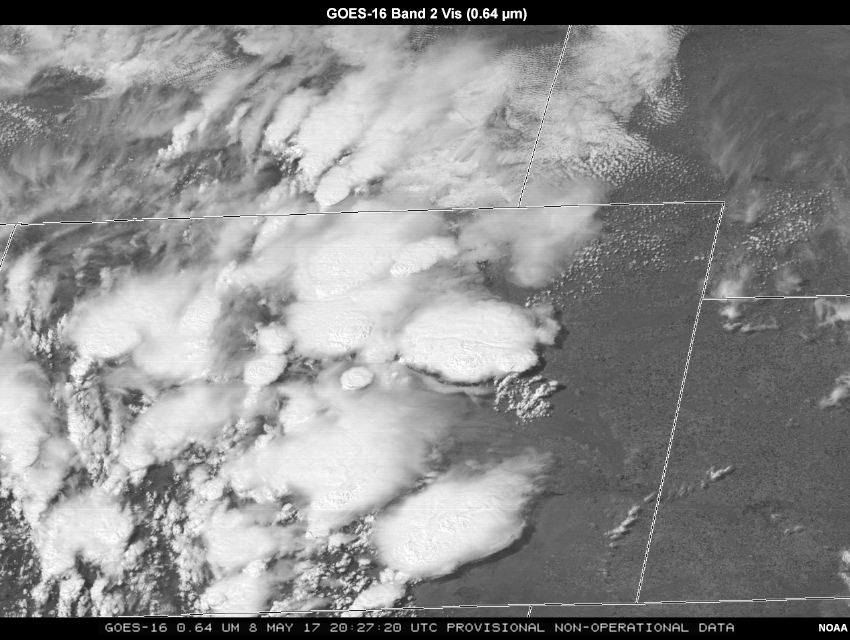
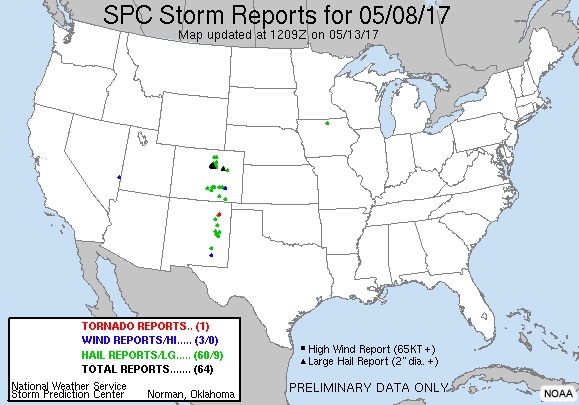
The exercises focus on severe convection that occurred on 8 May, primarily over eastern Colorado, southeastern Wyoming and western Nebraska. At 15Z, a surface cold front had pushed southward into north-central Colorado and up against the Palmer Divide, a 1800-2400-meter high ridge just south of Denver.
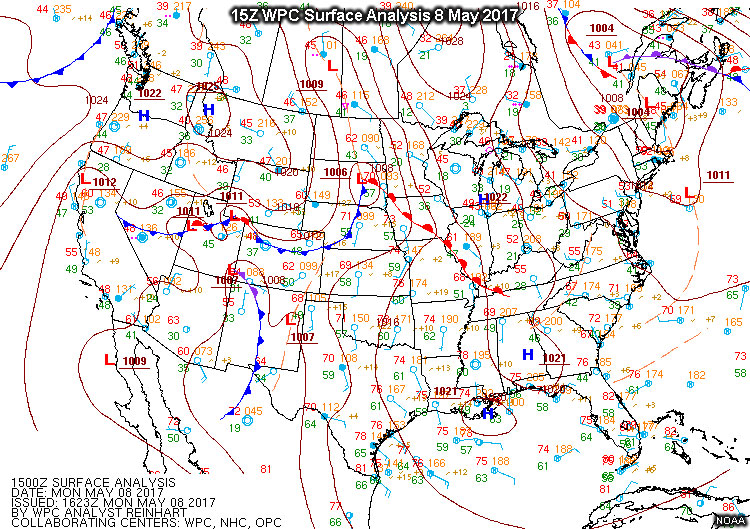
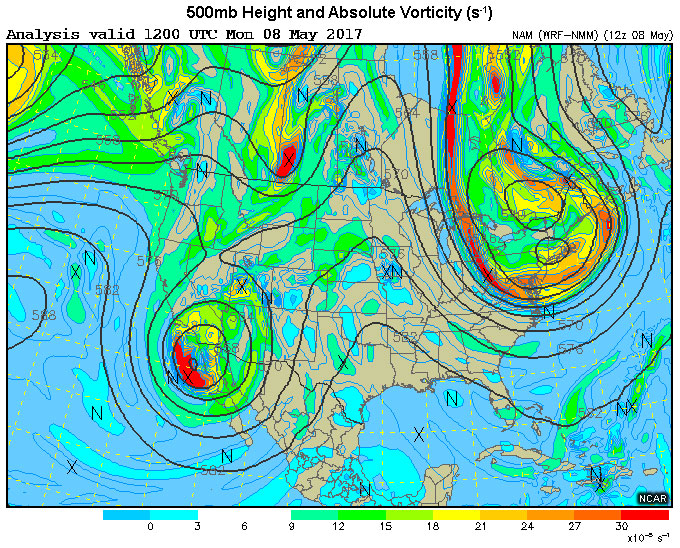
Return flow brought low-level moisture into Colorado from the southeast while southwesterly flow aloft associated with an upper-level low over the Baja Peninsula helped prime conditions for afternoon convective initiation and possible severe activity.
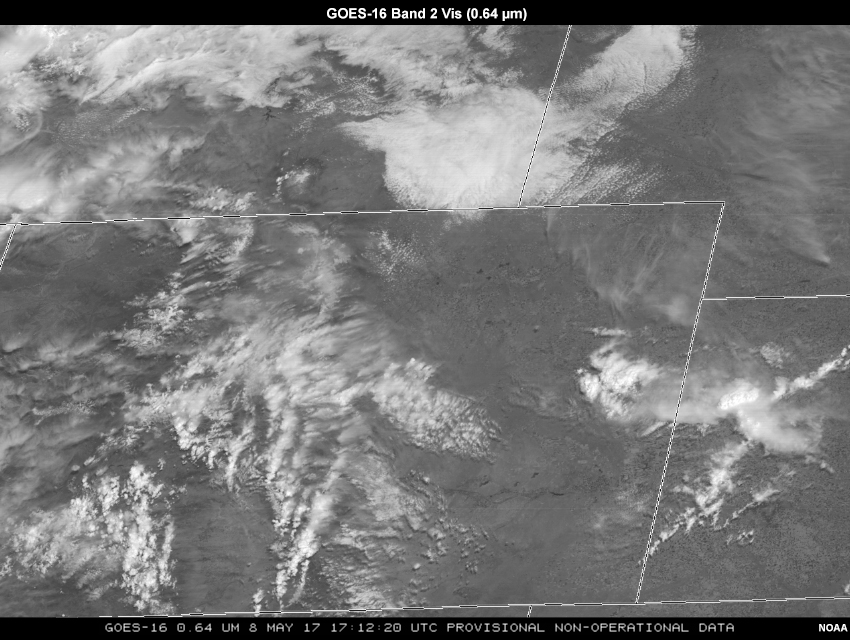
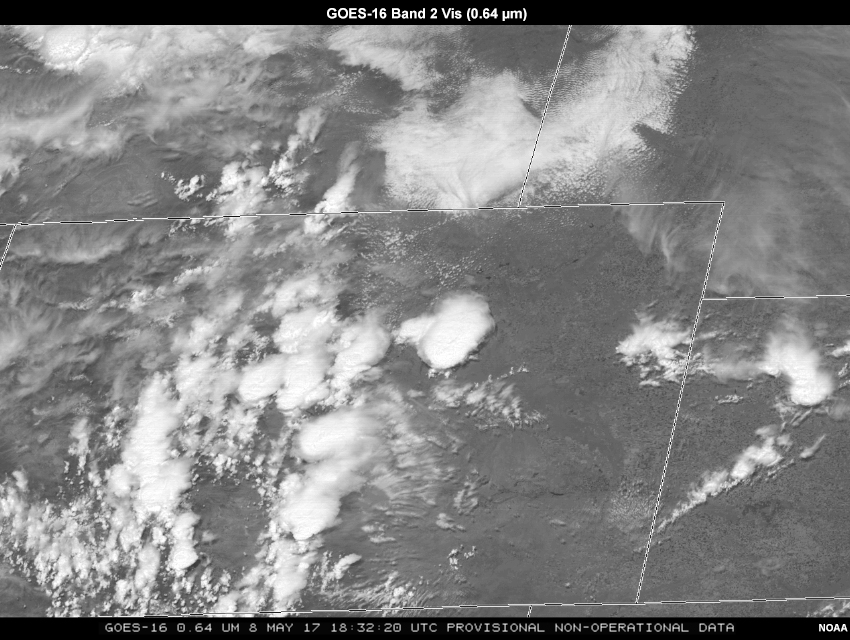
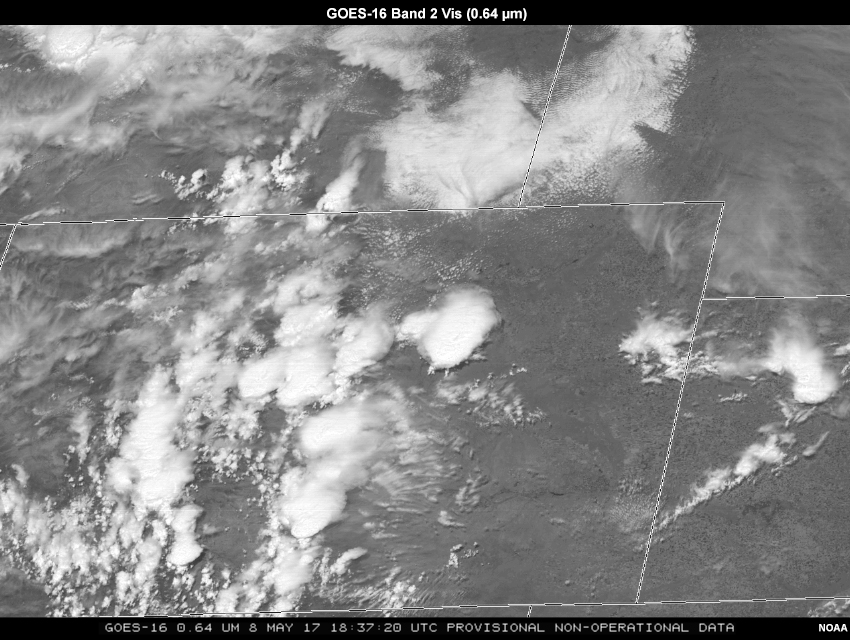
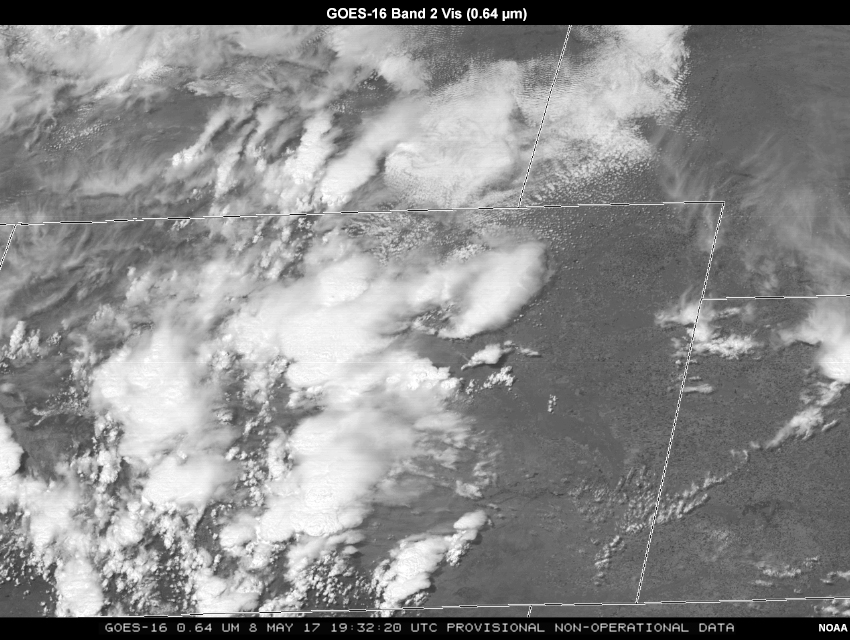
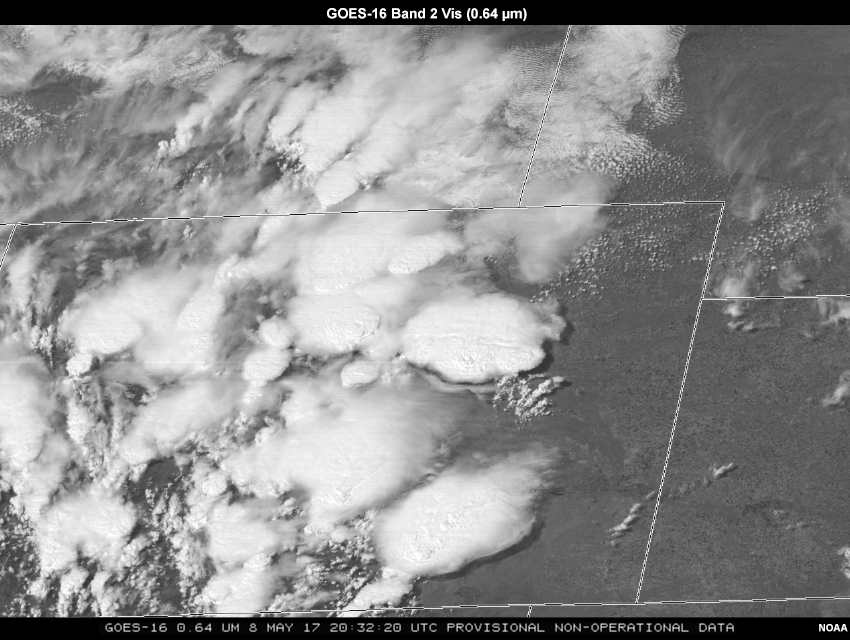
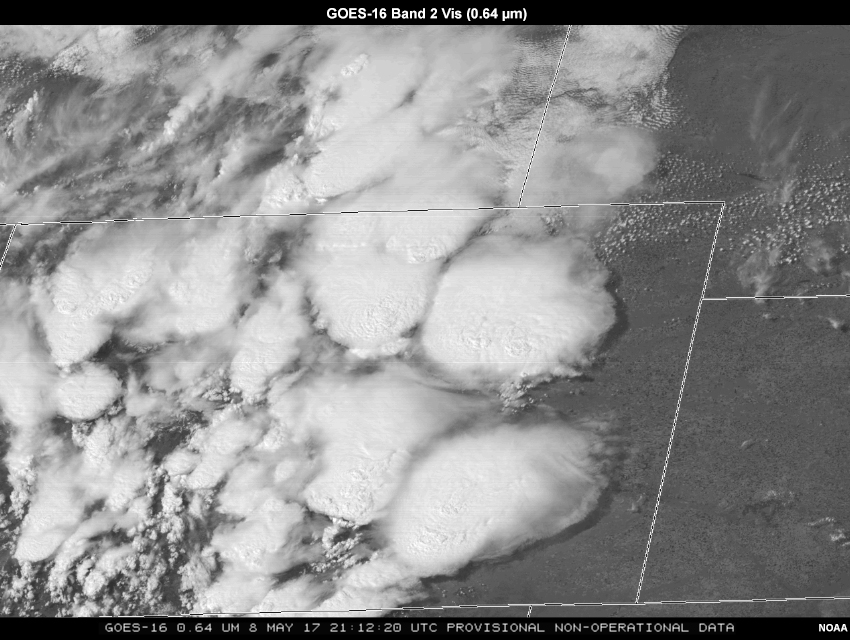
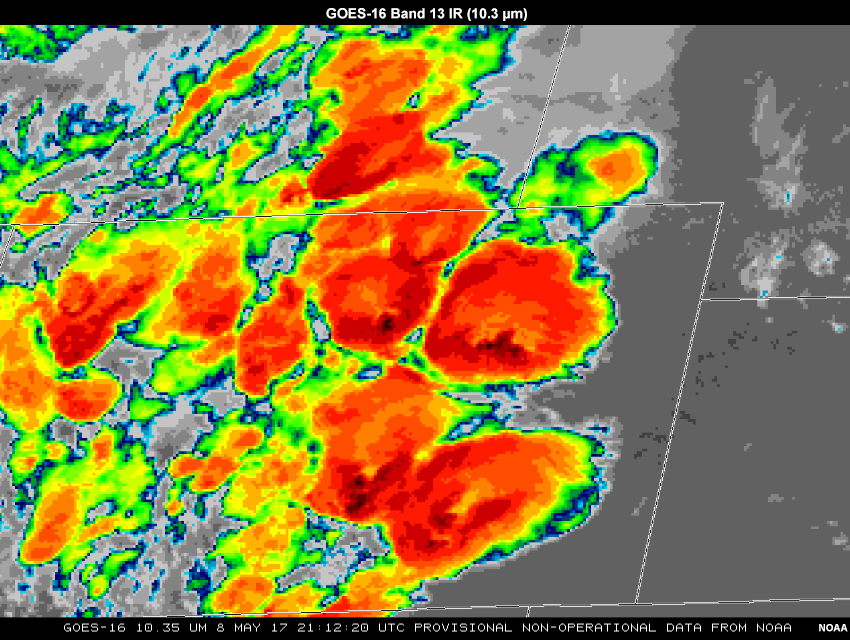
The following pages contain exercises that focus on using GOES-16 0.64 µm visible and 10.3 µm infrared bands during 3 periods of storm development: the pre-storm environment, convective initiation, and convective intensity and maintenance.
Each exercise contains loops of visible and IR bands, and a series of tabbed questions in which you will analyze the situation. 5-minute CONUS imagery will be presented, along with legacy GOES-15 data for comparison.
Example Case and Exercise: 8 May 2017 Colorado Hail Event » Exercise 1 - Pre-storm Environment


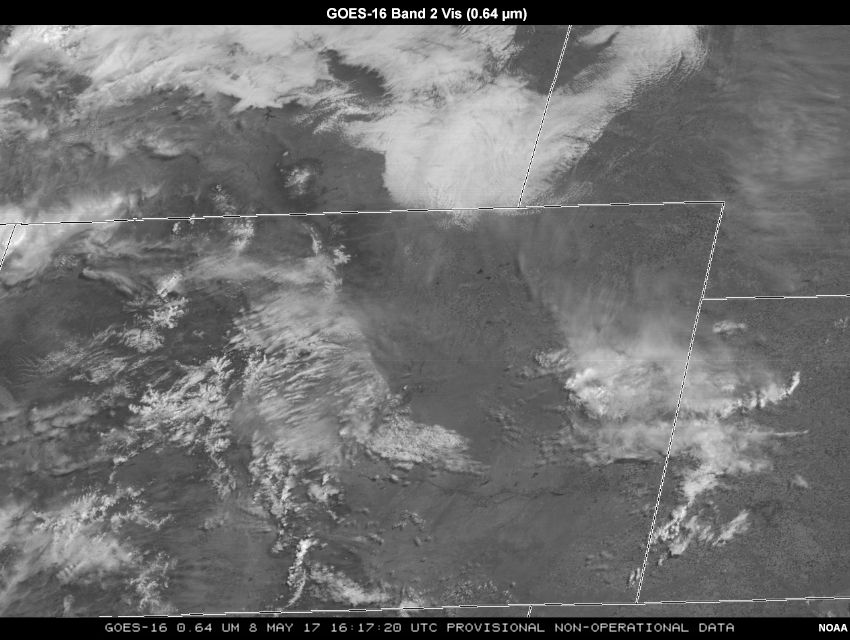
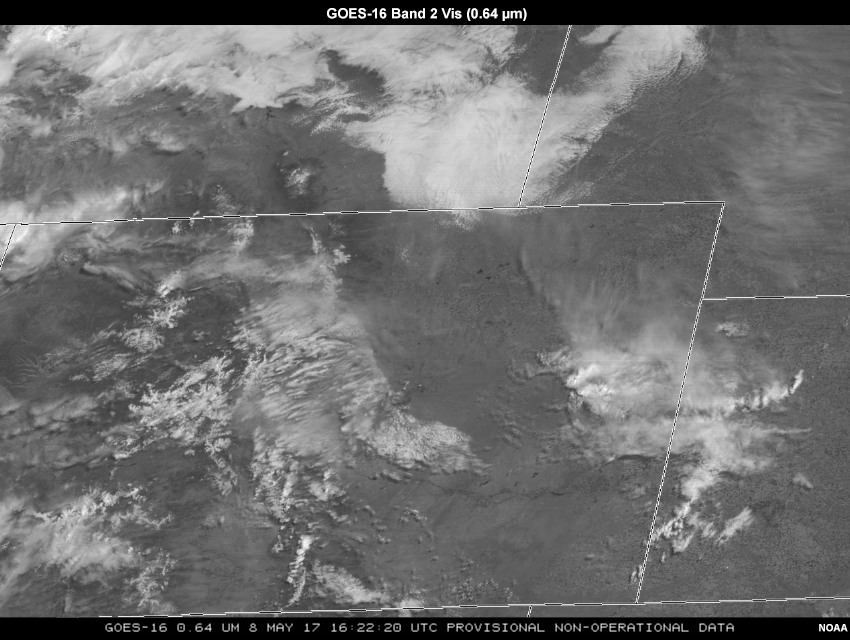


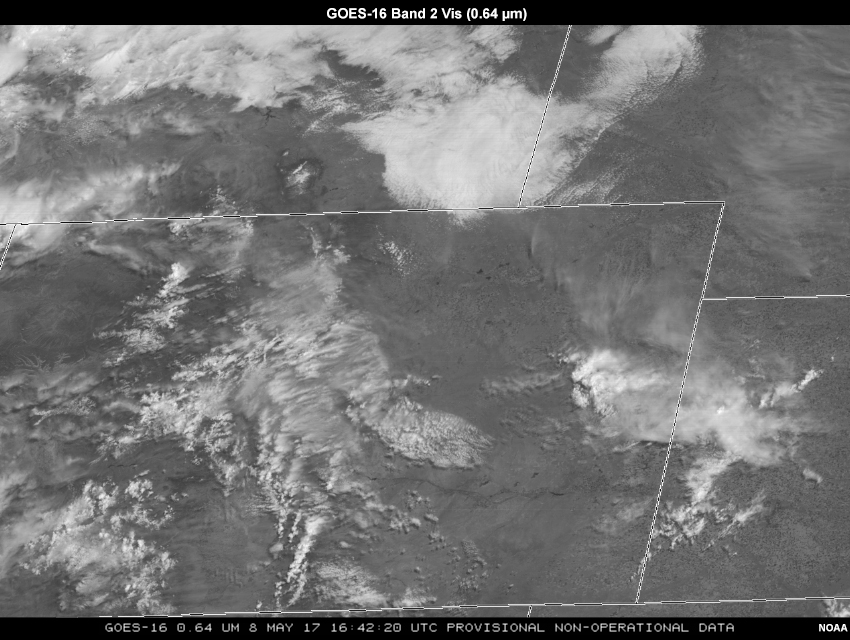
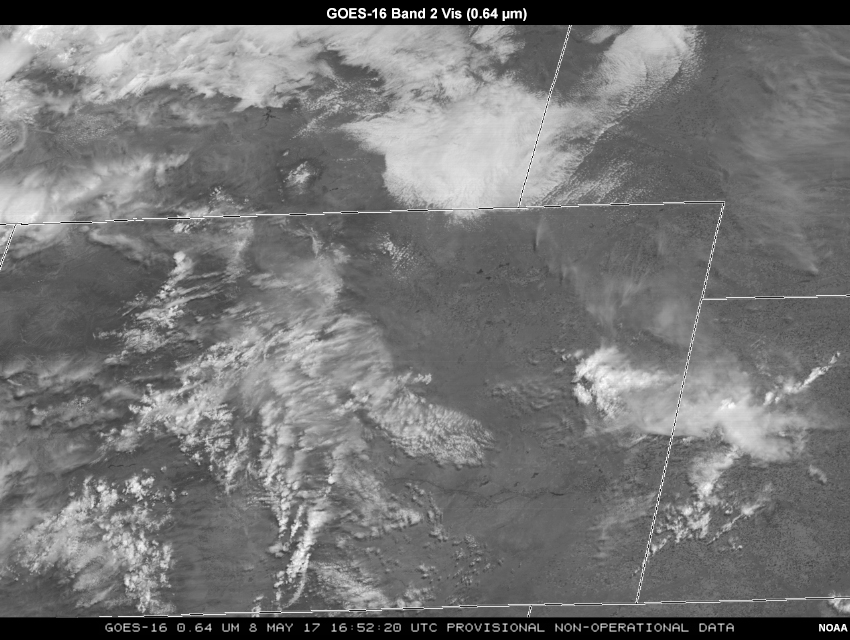

Q1 - Cu Field and Boundaries
Practice Question 1
- Using red pen: Outline areas of cumulus streets oriented parallel to the low-level flow.
- Using blue pen: Outline areas of mid-level flow cumulus streets over topography.
- Using green pen: Outline zones of low-level convergence and initial cumulus congestus.
View the full loop in detail again above to help solidify your analysis if needed.
| Tool: | Tool Size: | Color: |
|---|---|---|
|
|
The red ellipses are cumulus streets aligned with the southwesterly low-level flow across the region. The blue ellipses show cumulus streets anchored to the high mountains of the Colorado Front Range. The clouds within the green ellipses are anchored to the moving convergence boundaries at the surface. The westernmost convergence zone (in green) has a connection to the Palmer Divide, but is moving slowly off of the ridgeline.
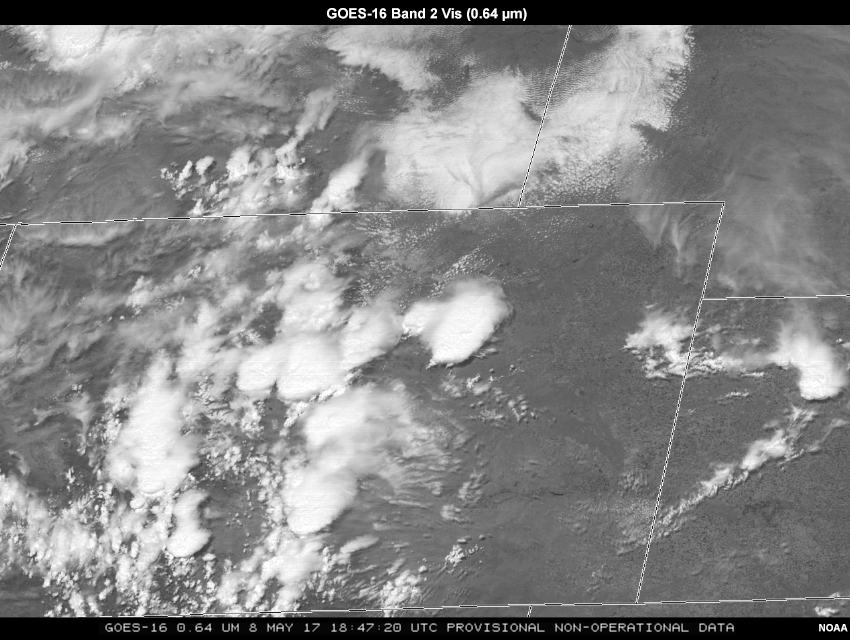
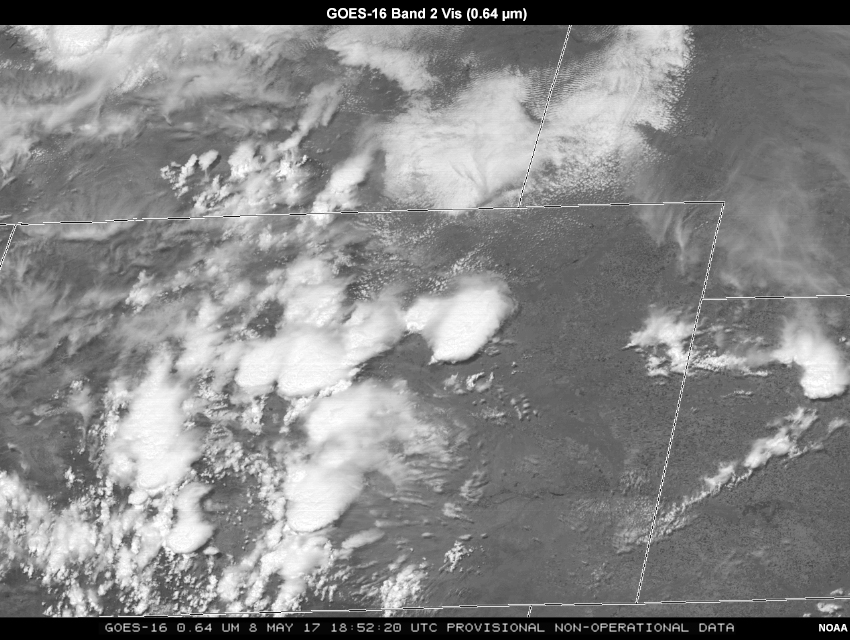
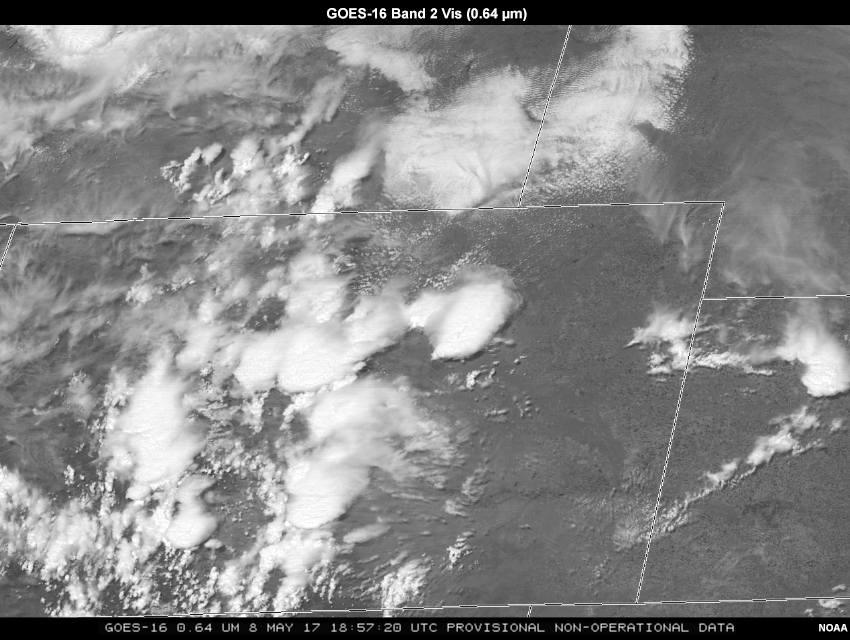
Example Case and Exercises: 8 May 2017 Colorado Hail Event » Exercise 2 - Convective Initiation


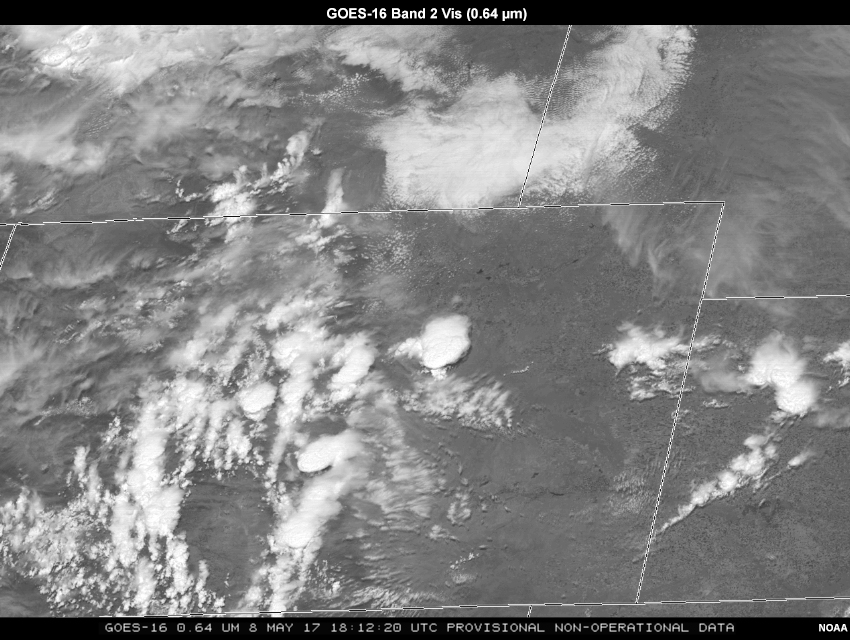


Q1 - Congestus & Anvils
Practice Question 1
- Using yellow pen: Outline areas of observed cumulus congestus development.
- Using red pen: Outline any orphan anvils.
View the loop in detail again above to help solidify your analysis if needed.
| Tool: | Tool Size: | Color: |
|---|---|---|
|
|
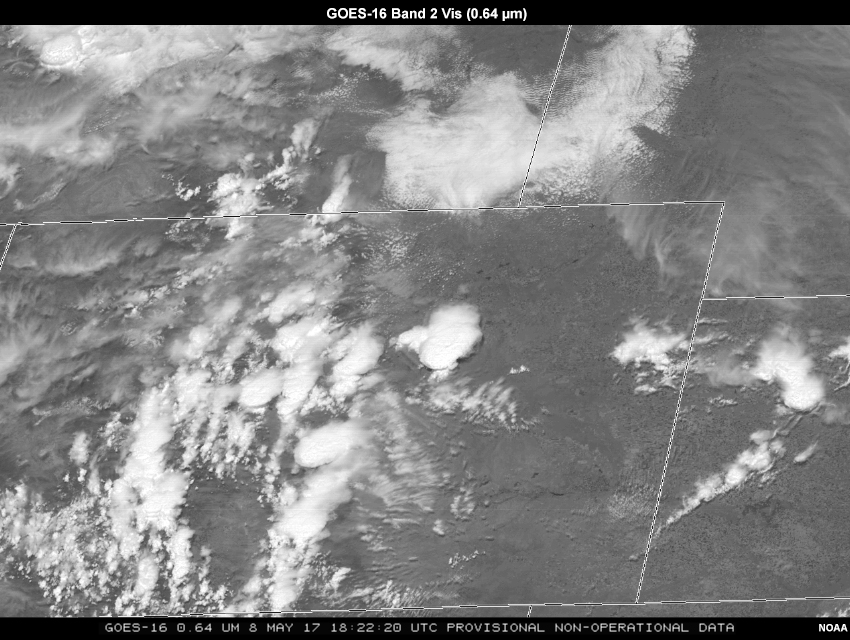
There are four areas of significant cumulus congestus development in yellow, and several small anvil orphans are seen advecting to the north in the red outline. These orphans indicate that convective initiation may be imminent in that area, depending on the strength of the cap. Be sure to click through the tabs above to complete all three Practice Questions (Q1-Q3) before moving to the next page.
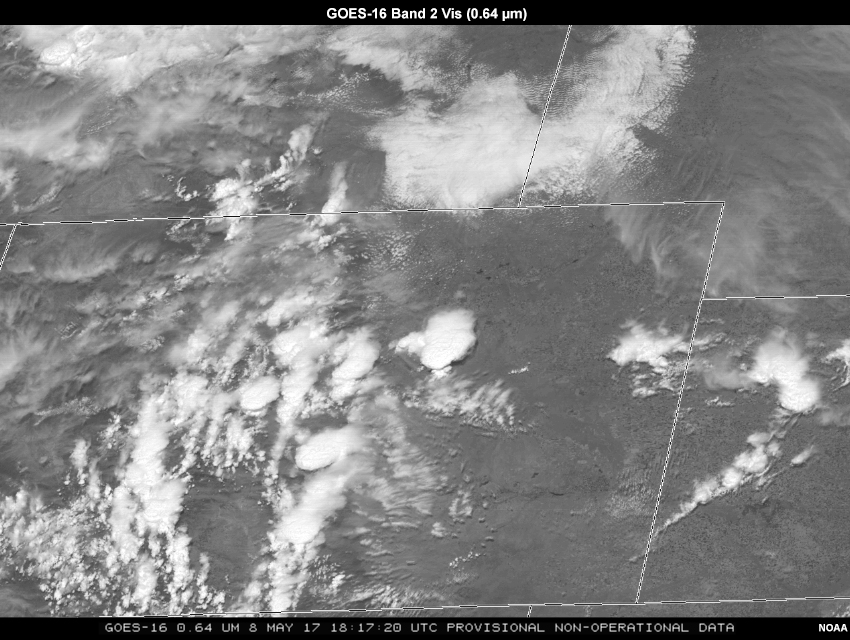
Q2 - Conv Initiation
Practice Question 2
At approximately what time and location did convective initiation occur in the region? Briefly justify your answer.

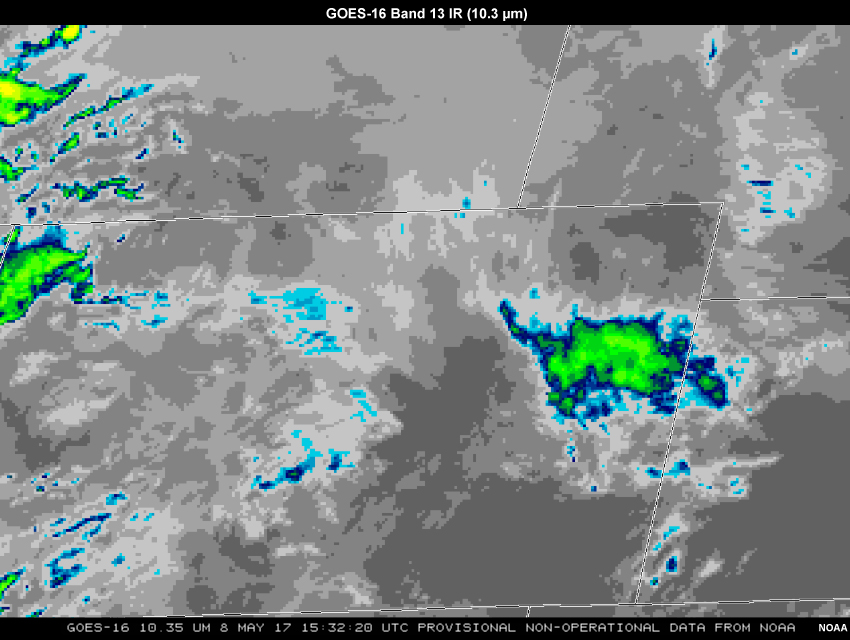
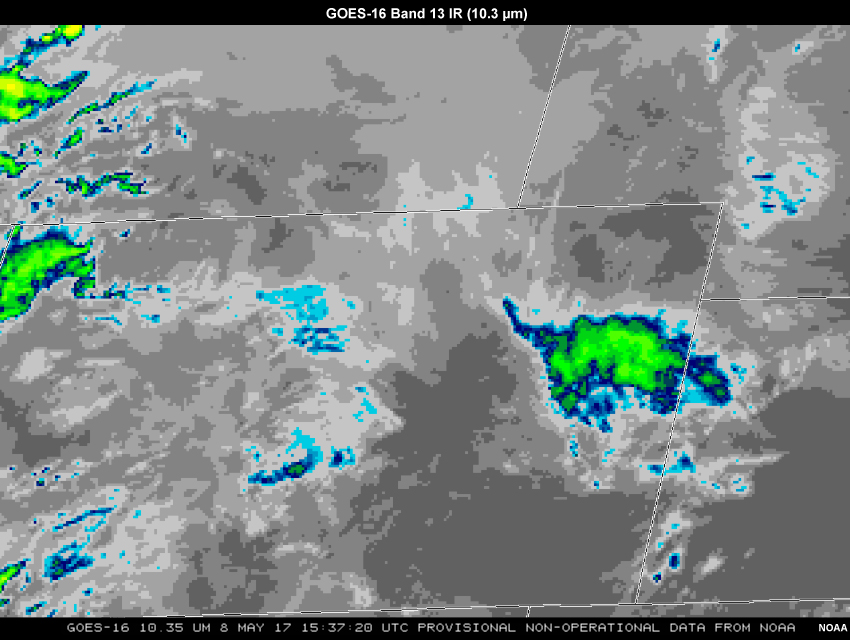
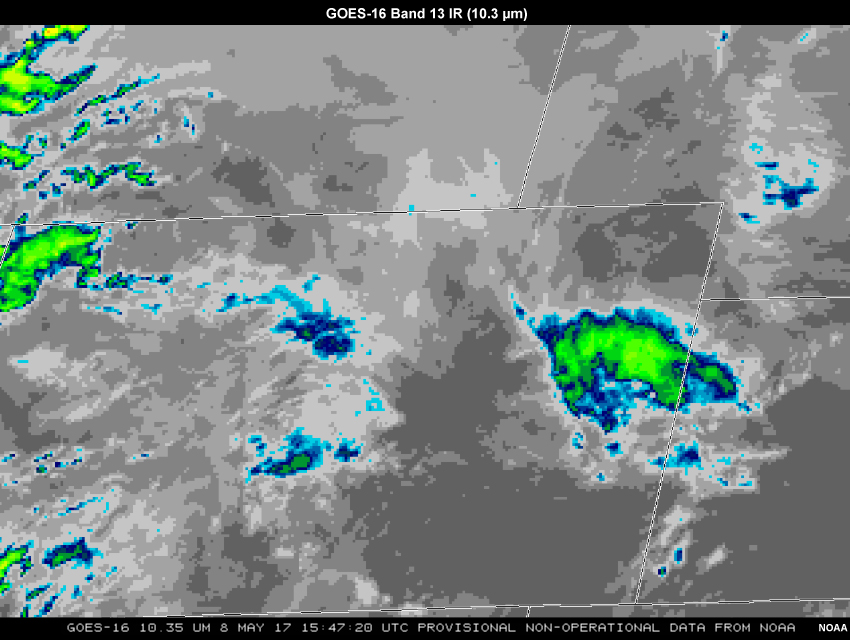
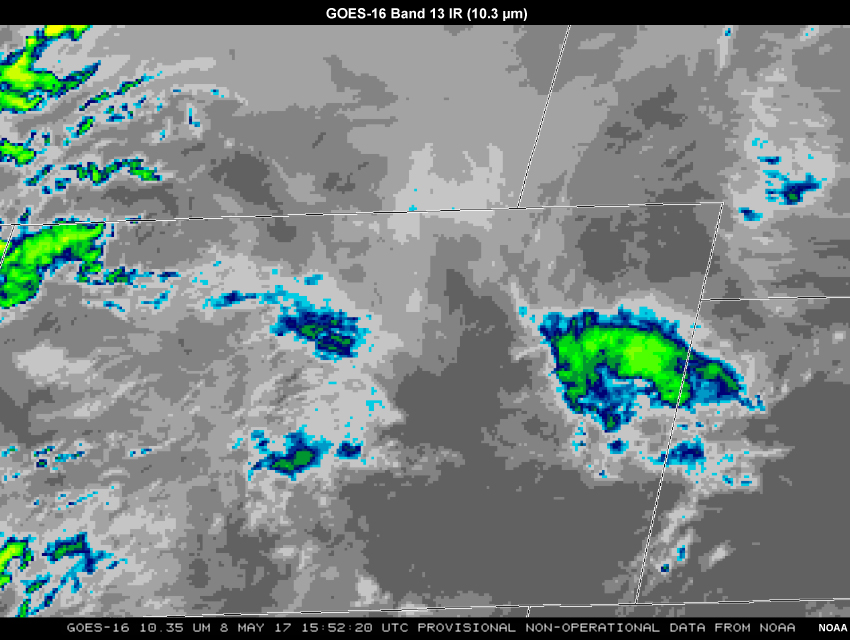
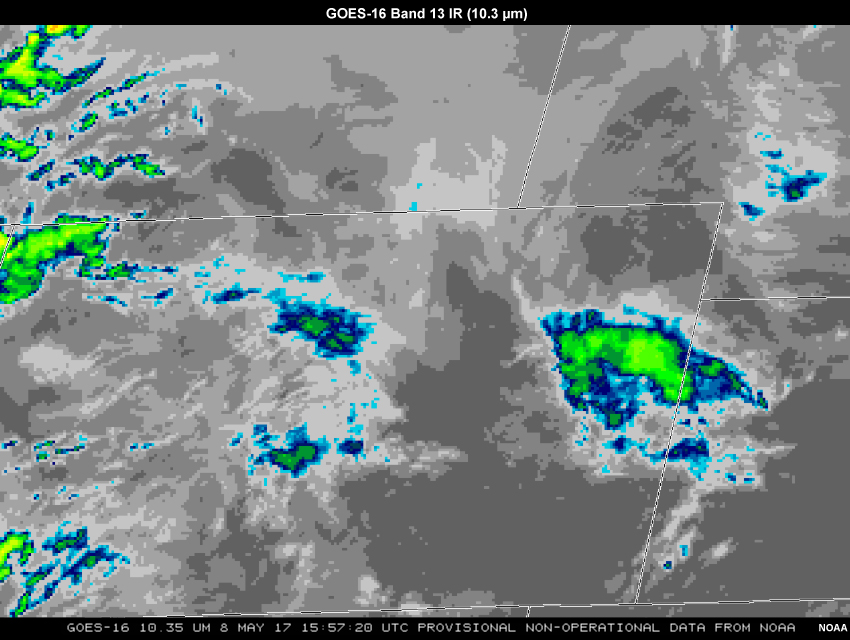
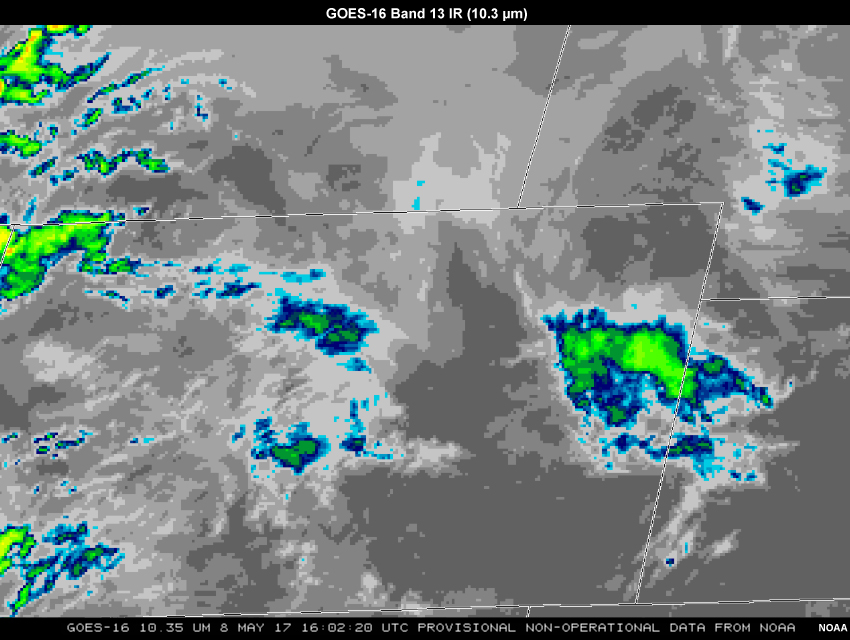
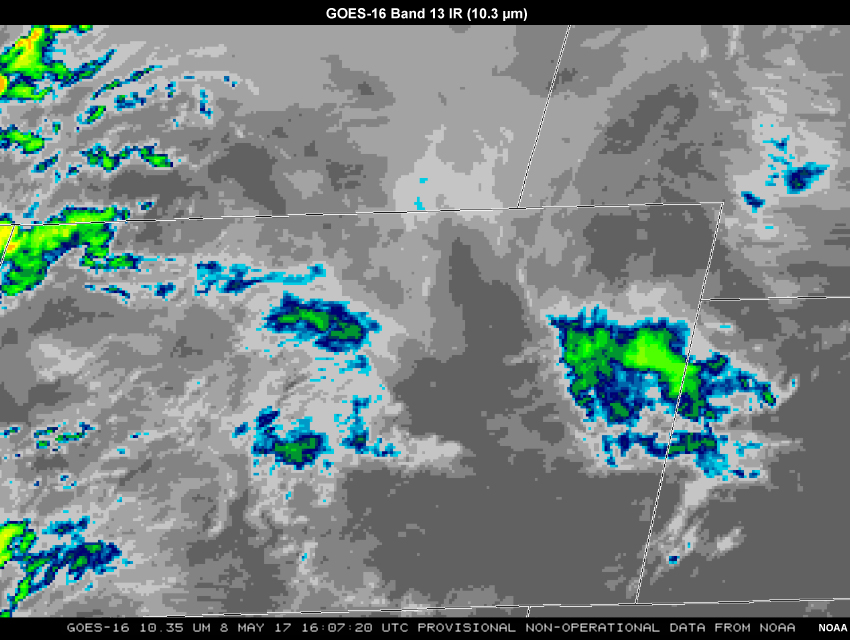
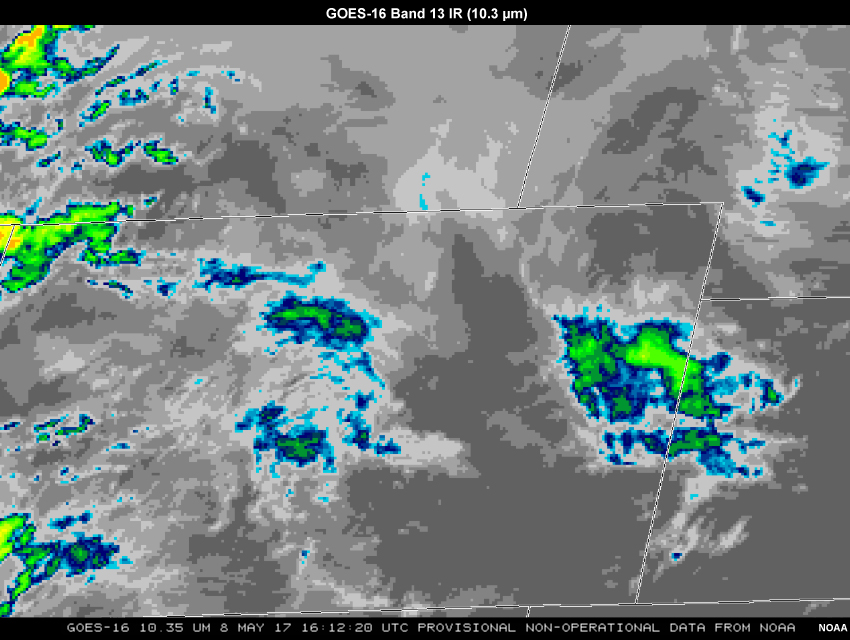
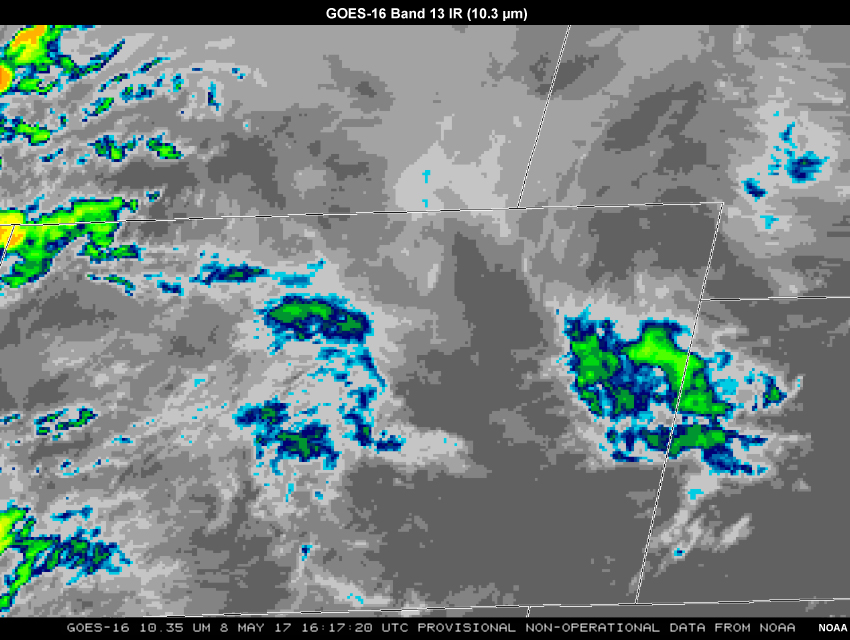
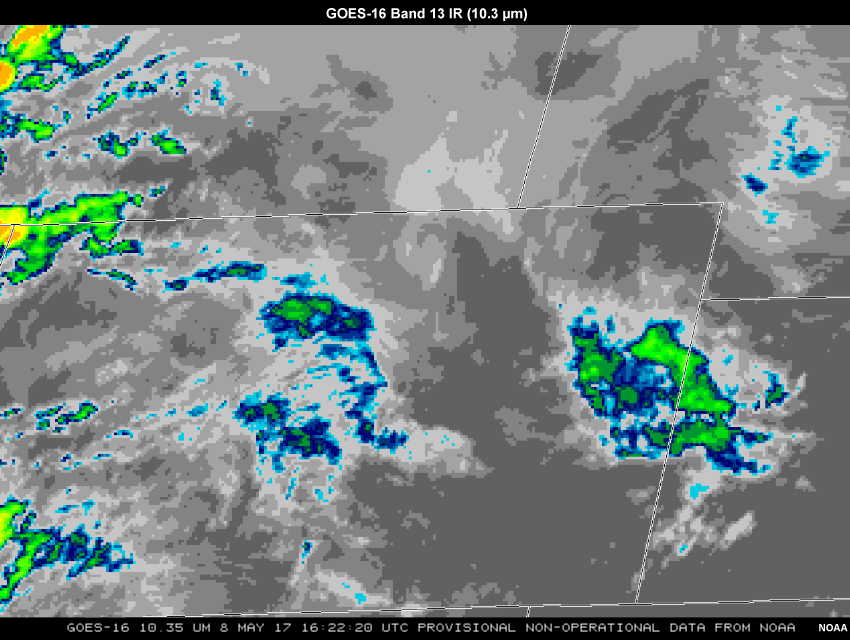
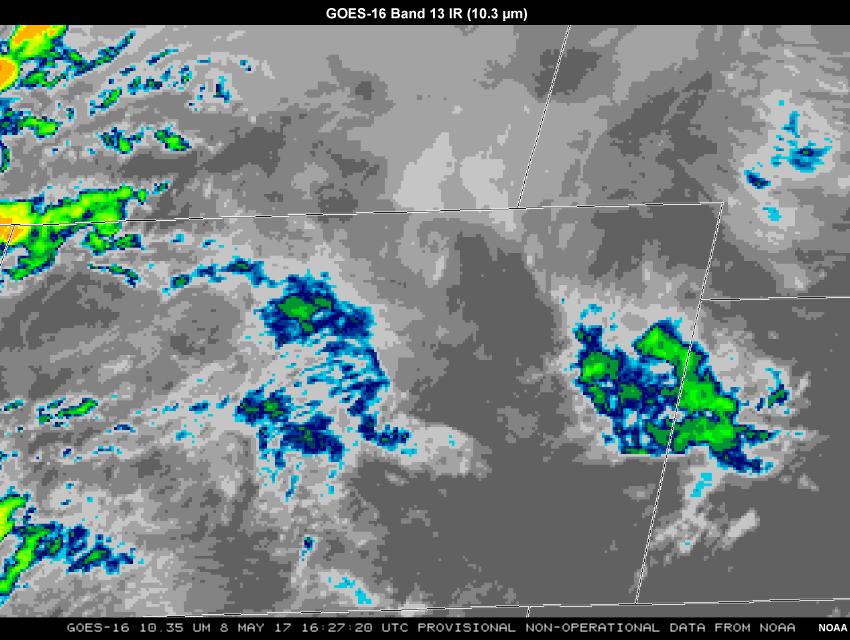
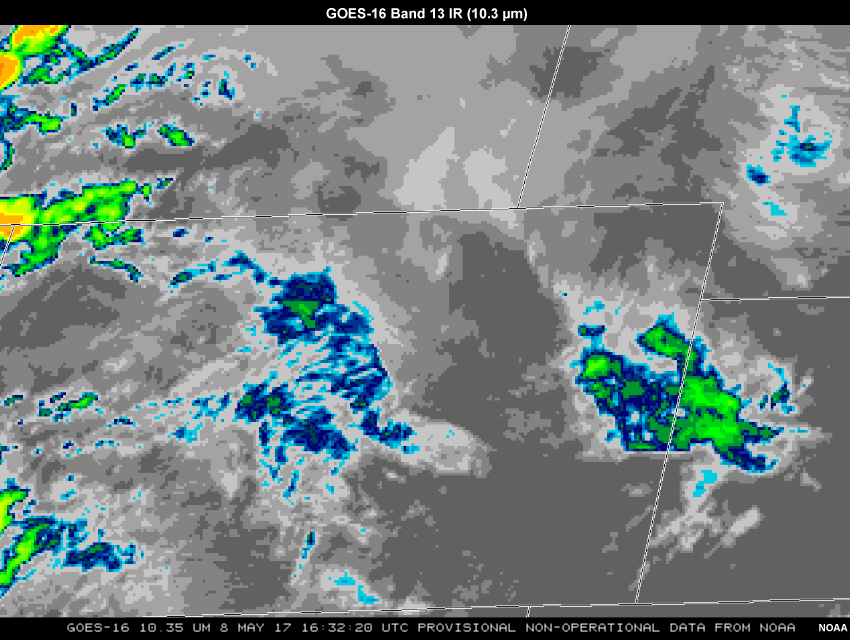
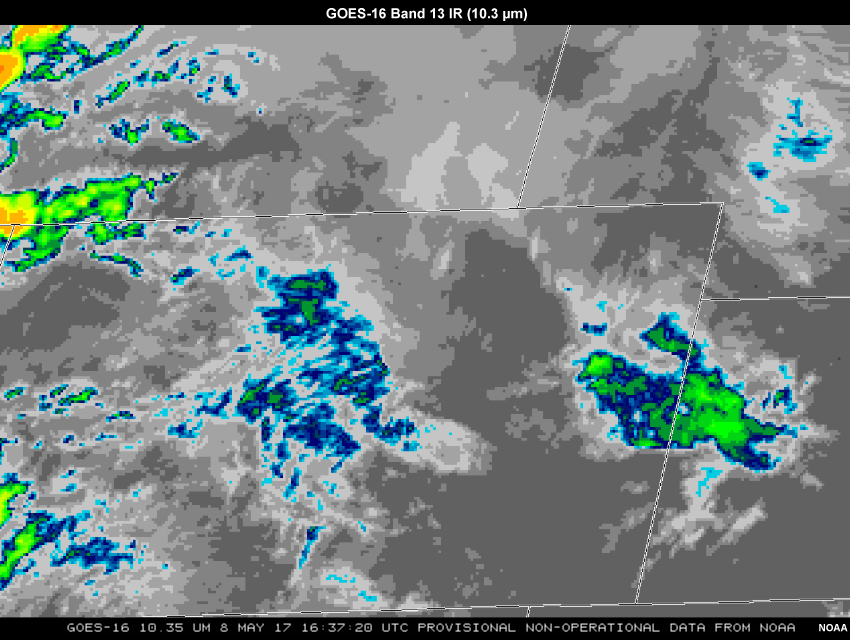
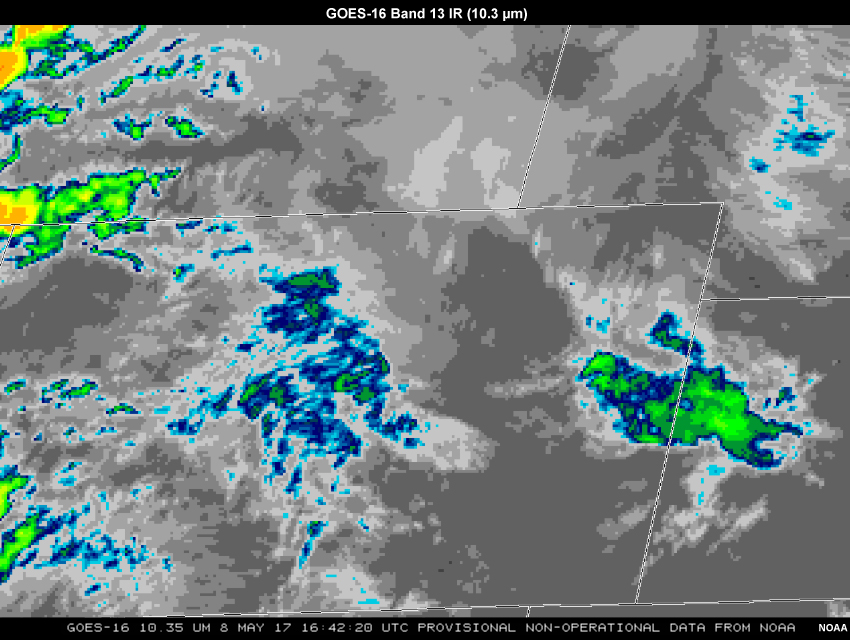
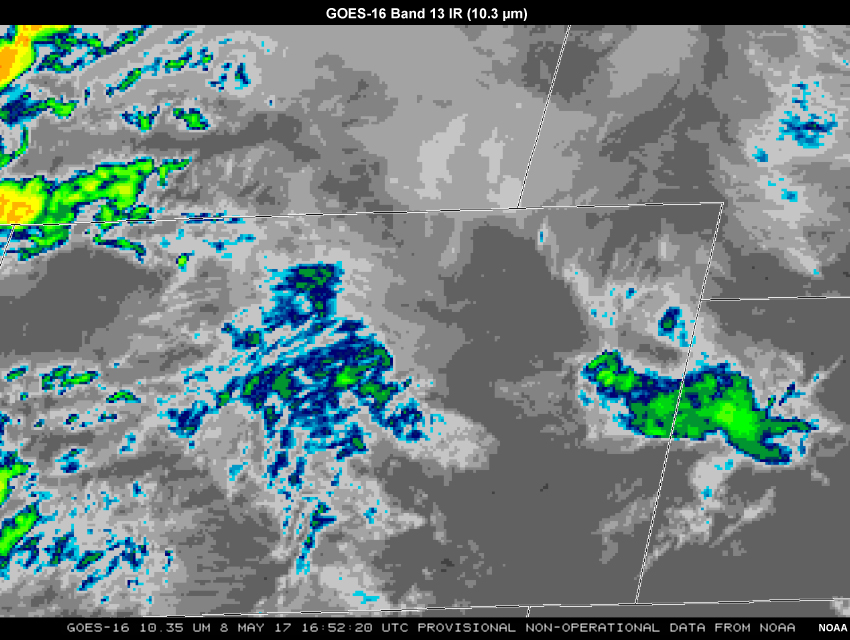
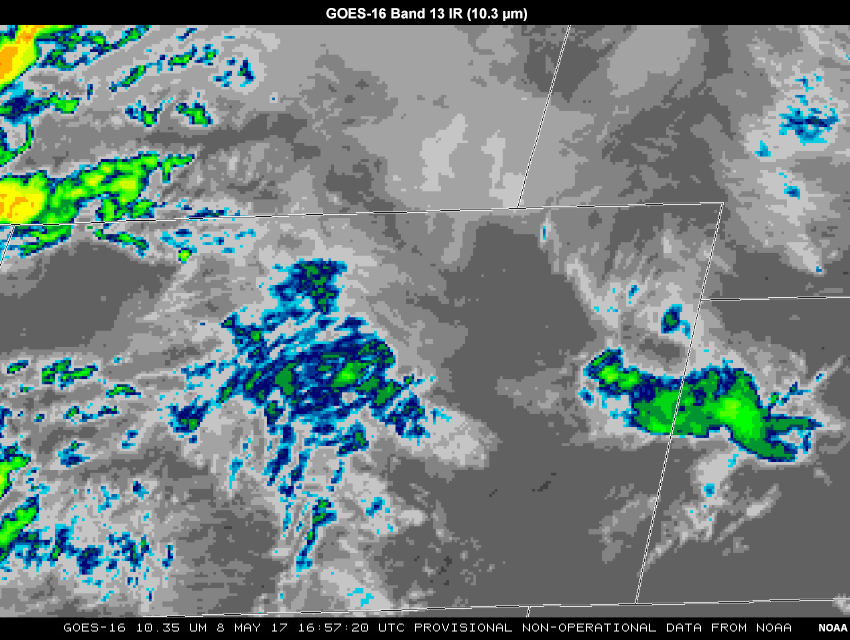
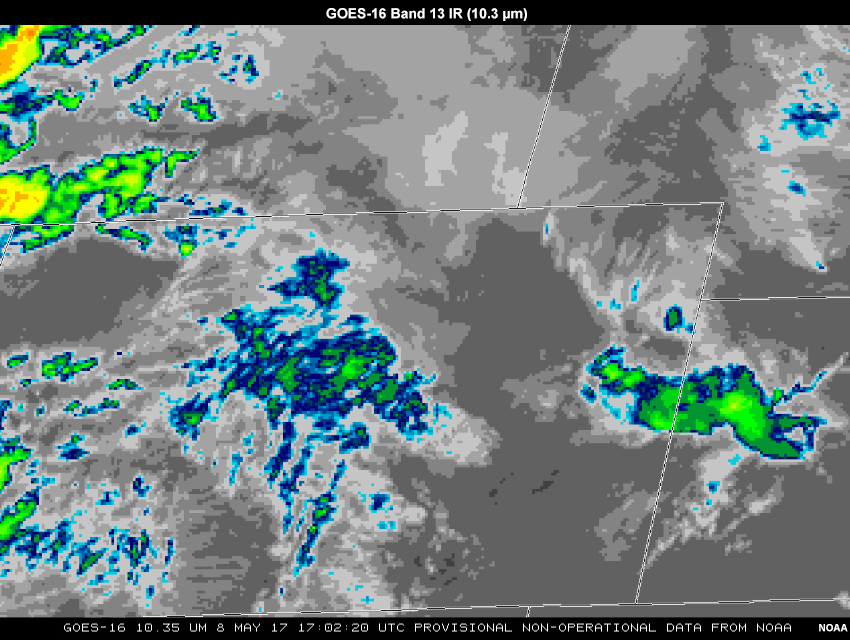
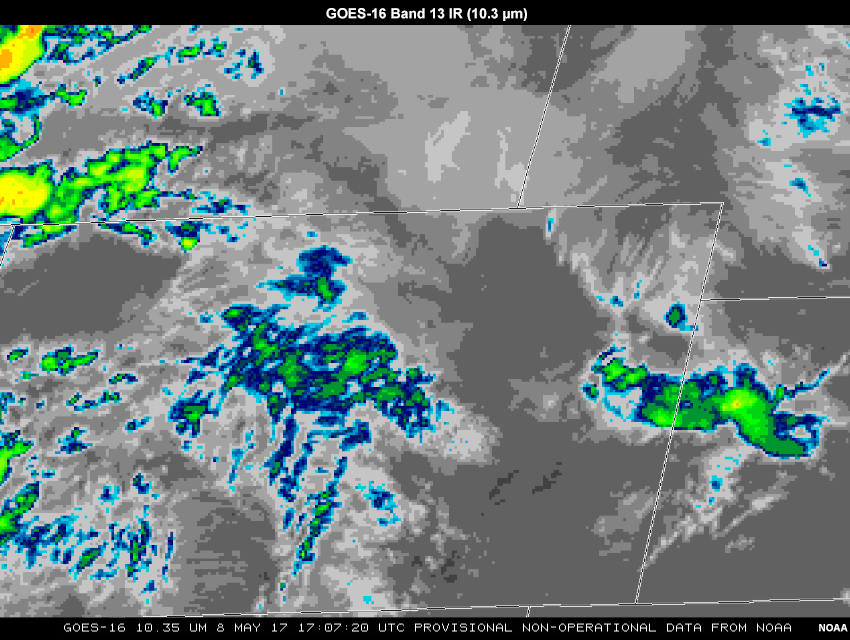
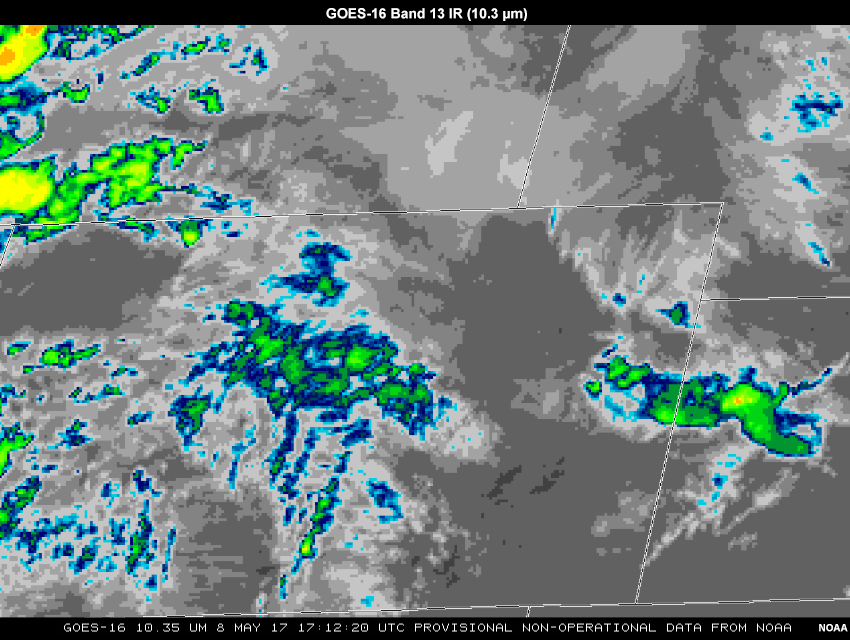
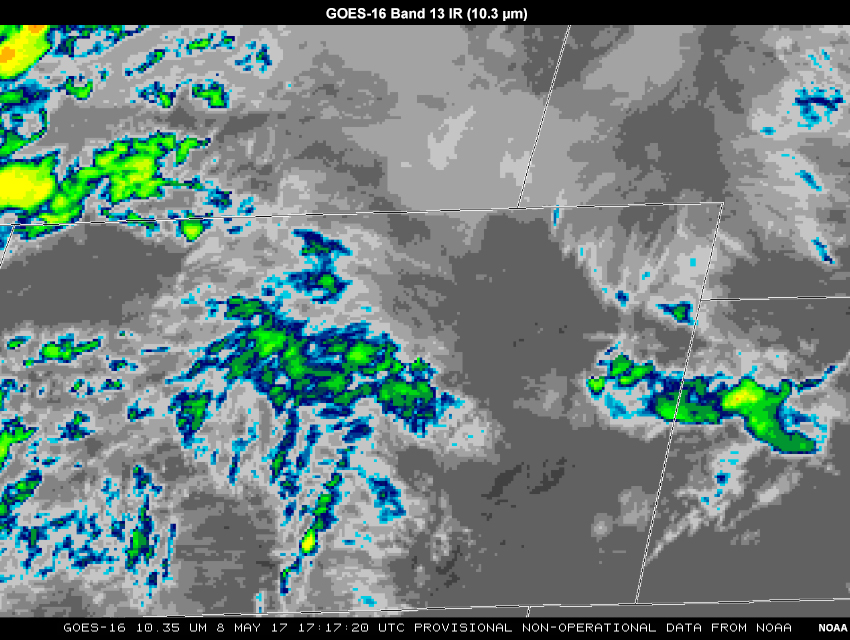
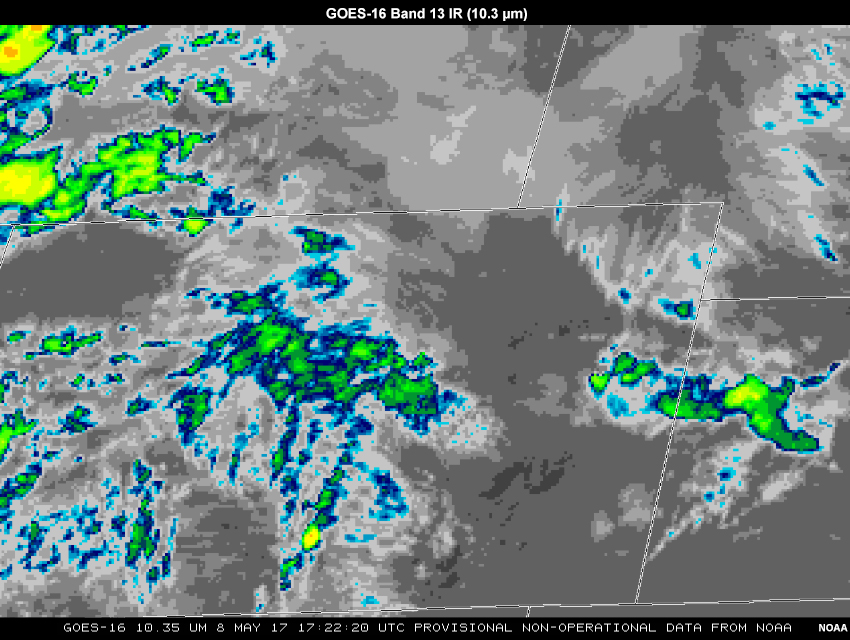
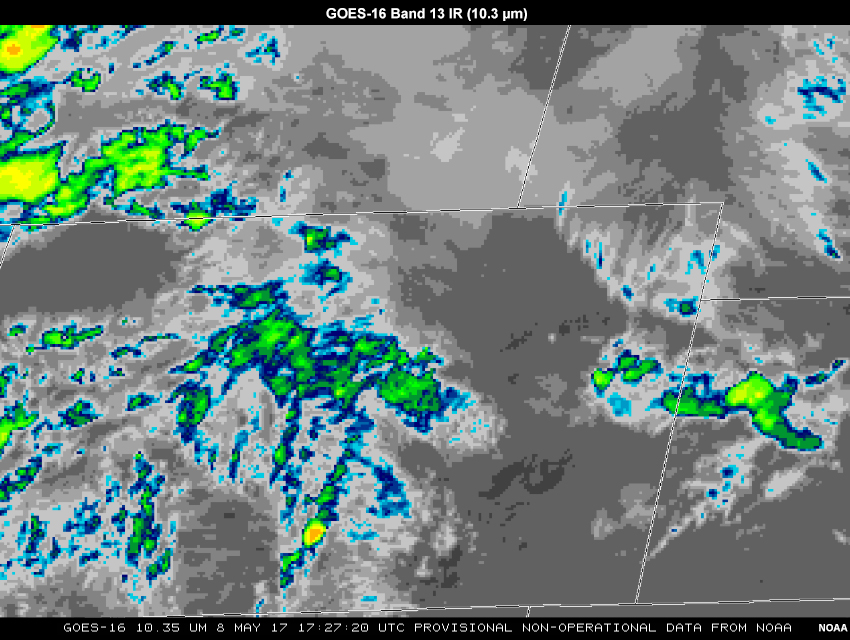
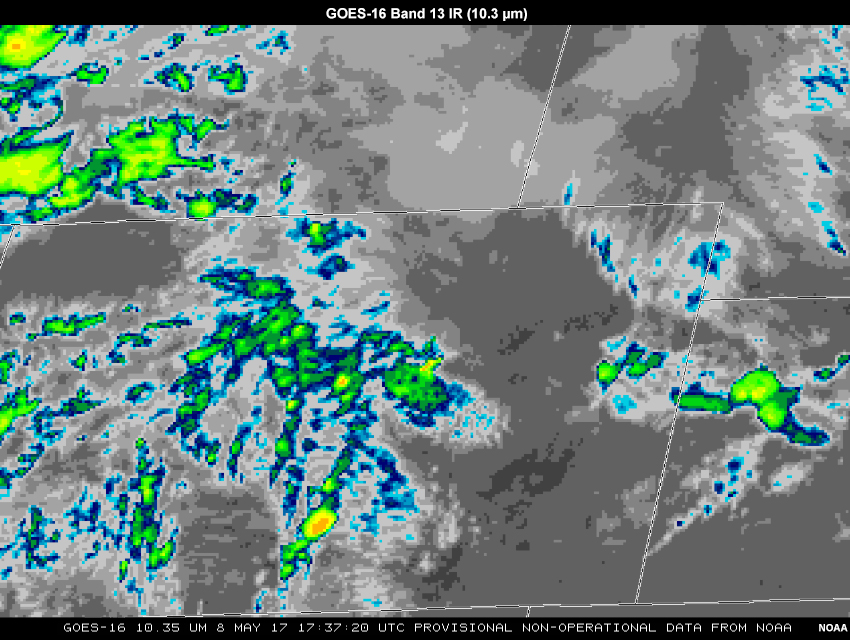
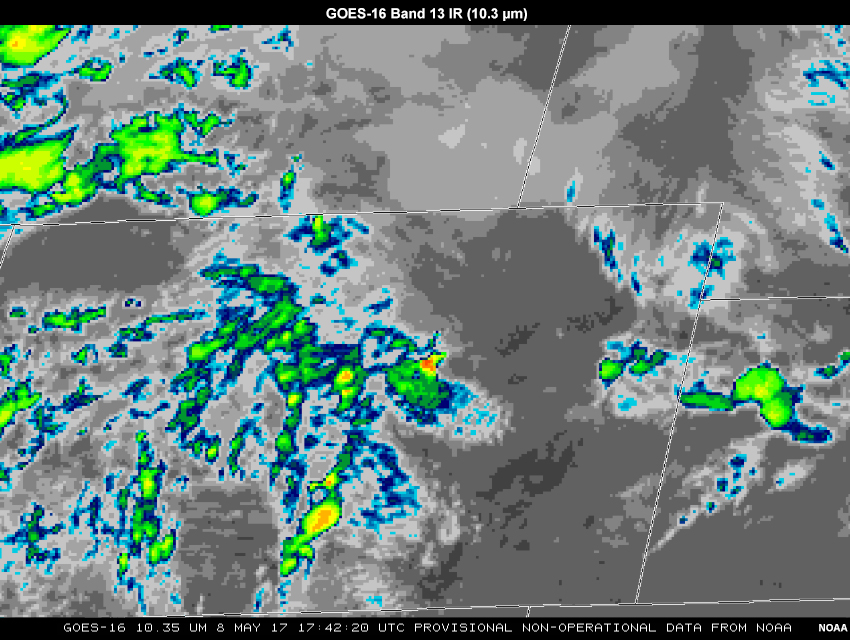
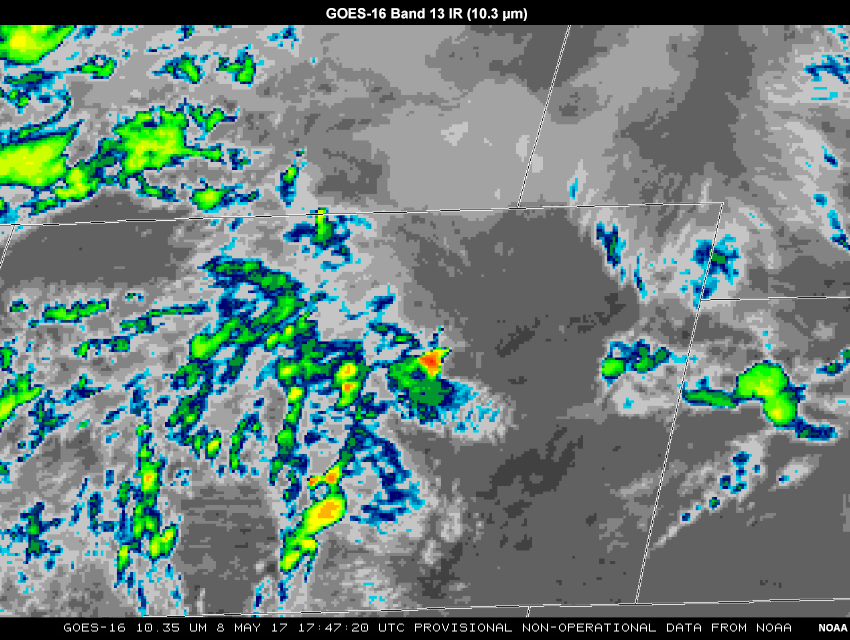
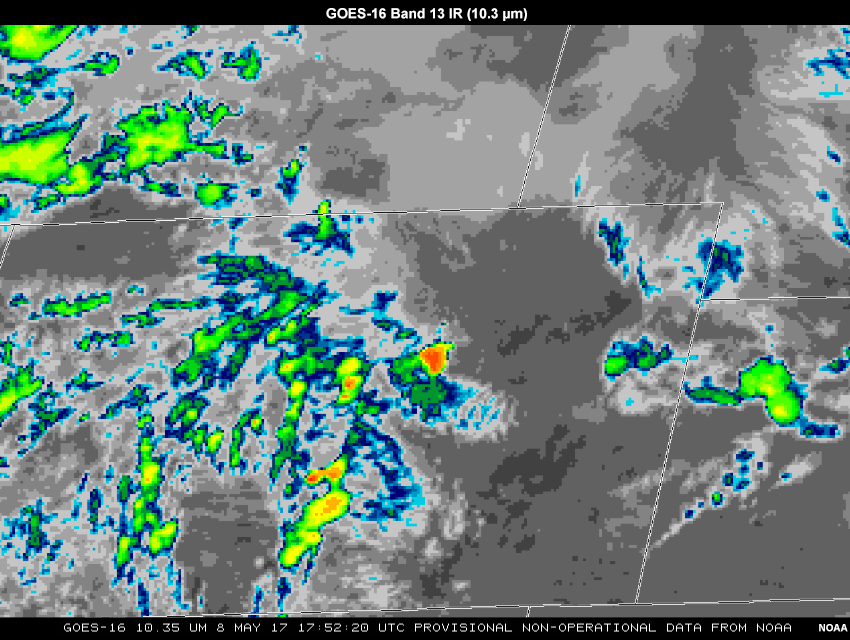
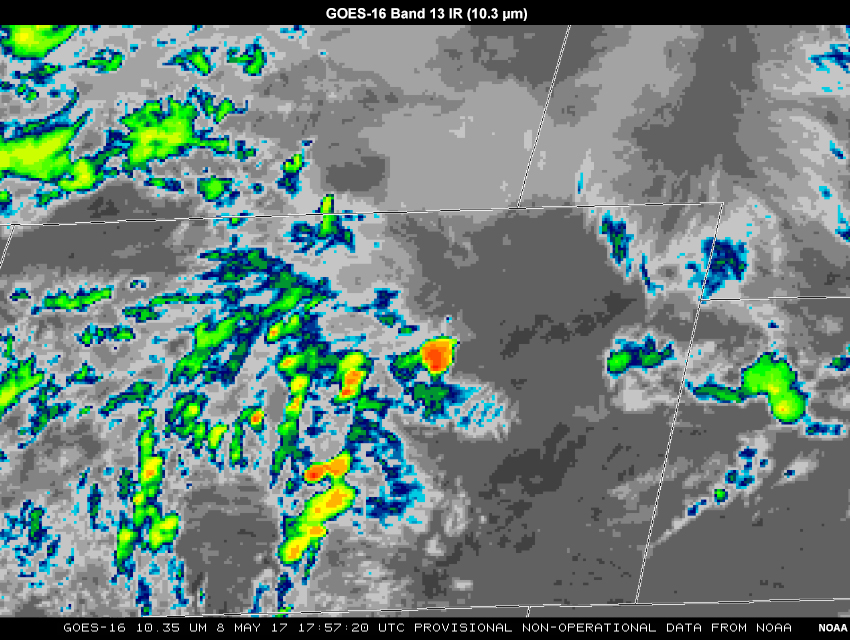
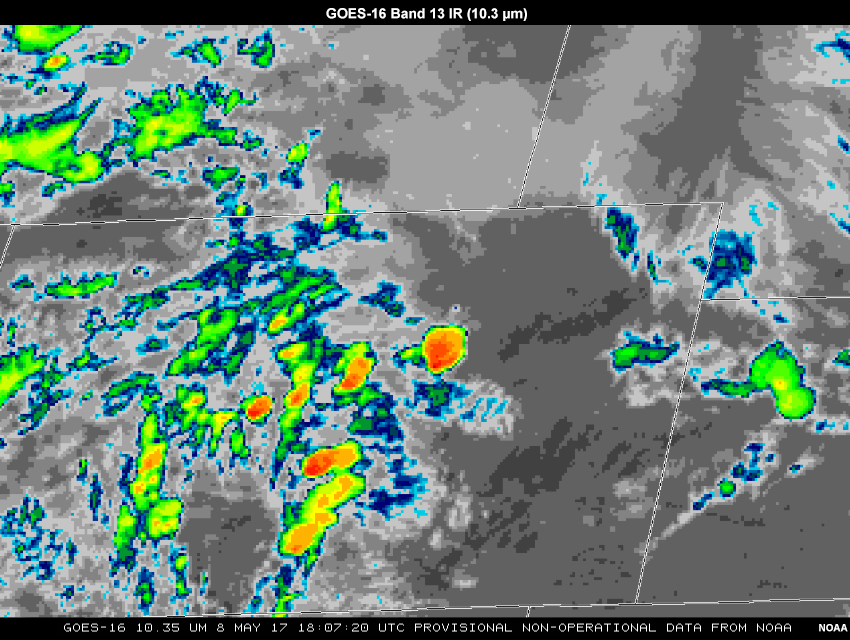
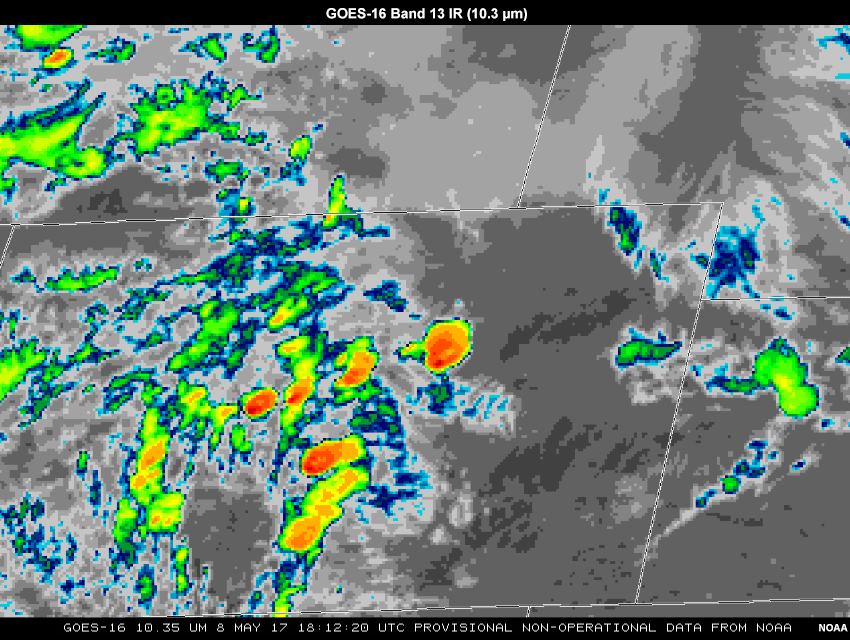
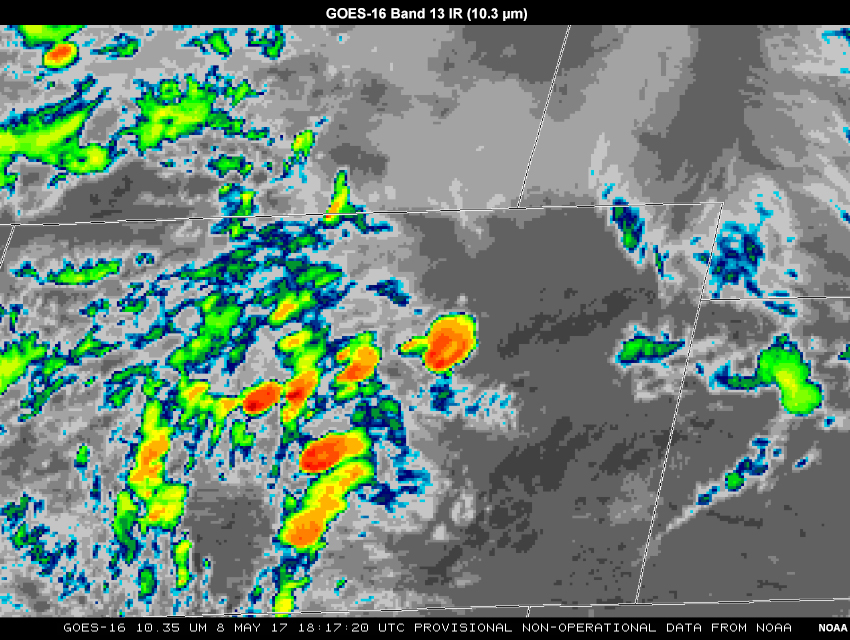
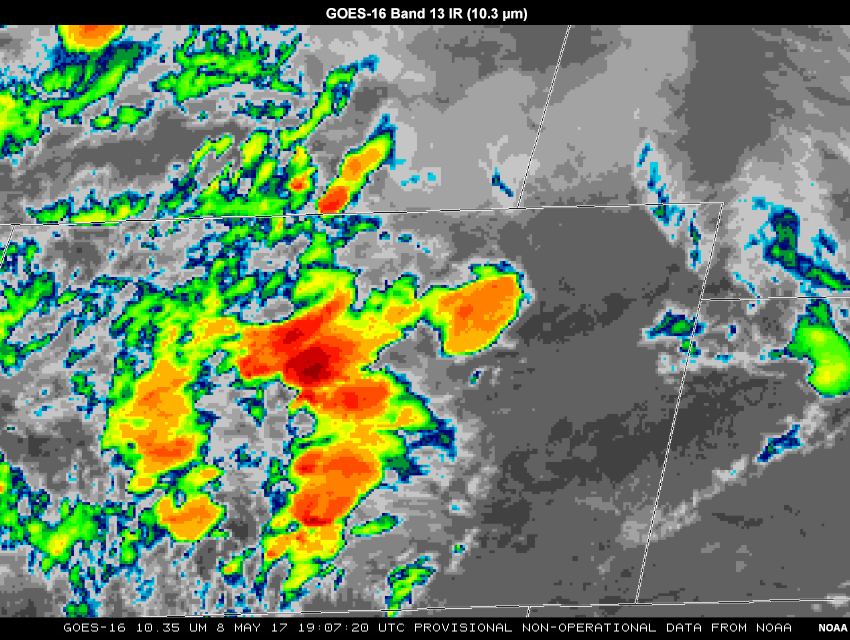
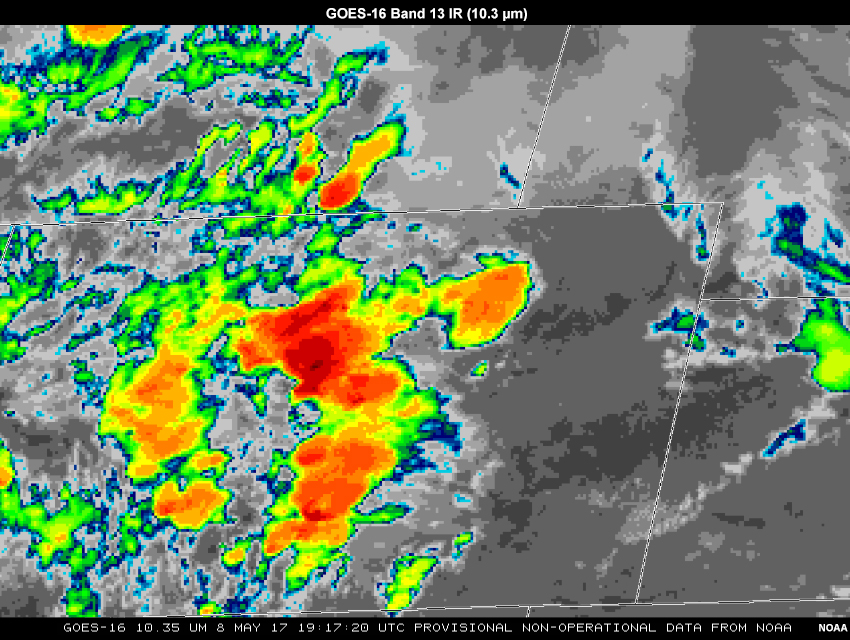
Convective initiation (defined in the literature as 35dBZ radar echo; not shown) occurred at approximately 1752Z over east-central Colorado and in two other cells in south-central Colorado. However, cloud-top cooling in these cells, especially the northeasternmost cell, was significant (nearly -25°C/15 minutes) since approximately 1727Z.

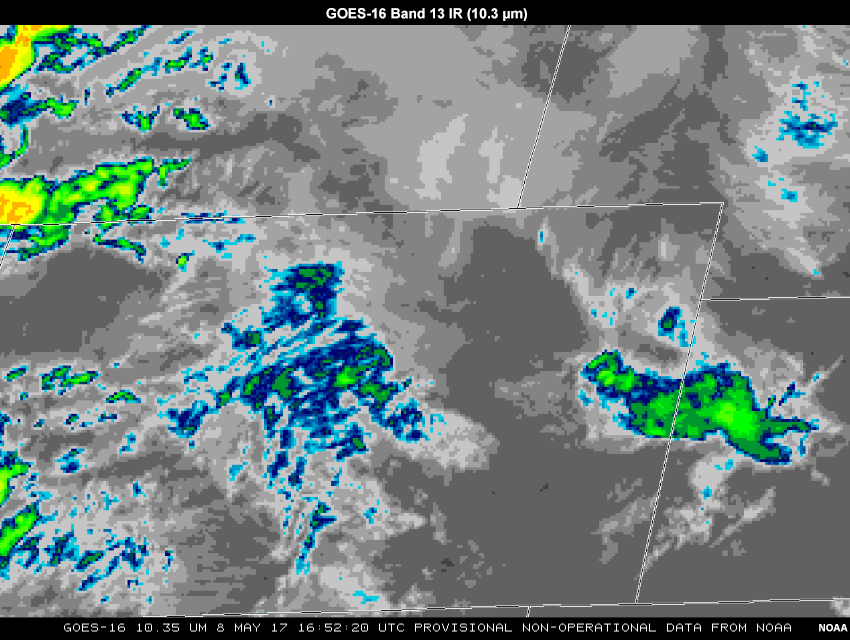
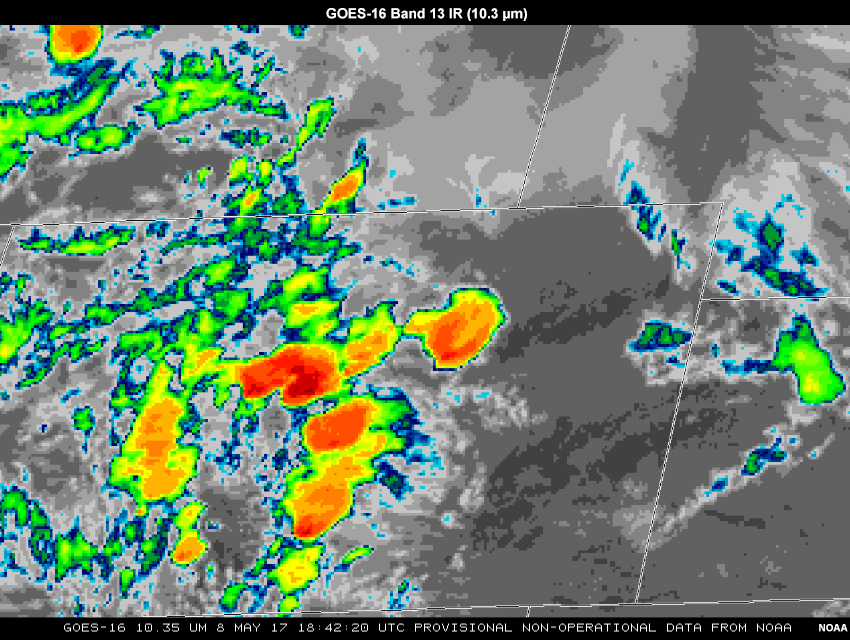
Q3 - Maintenance
Practice Question 3
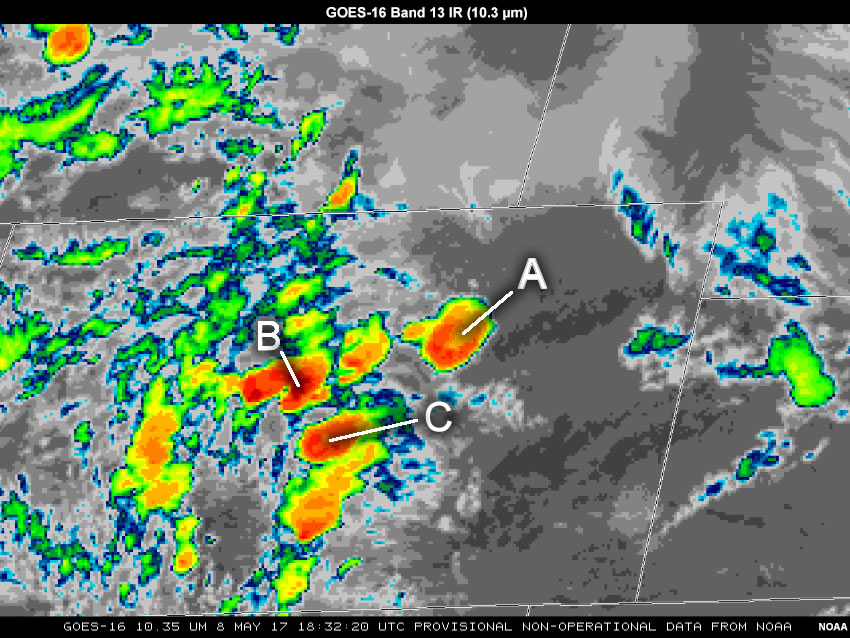
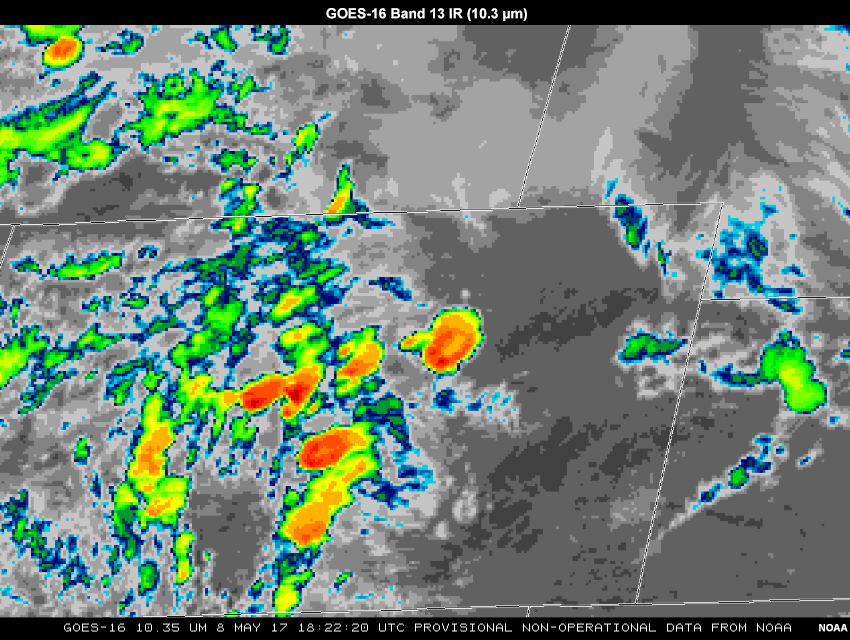
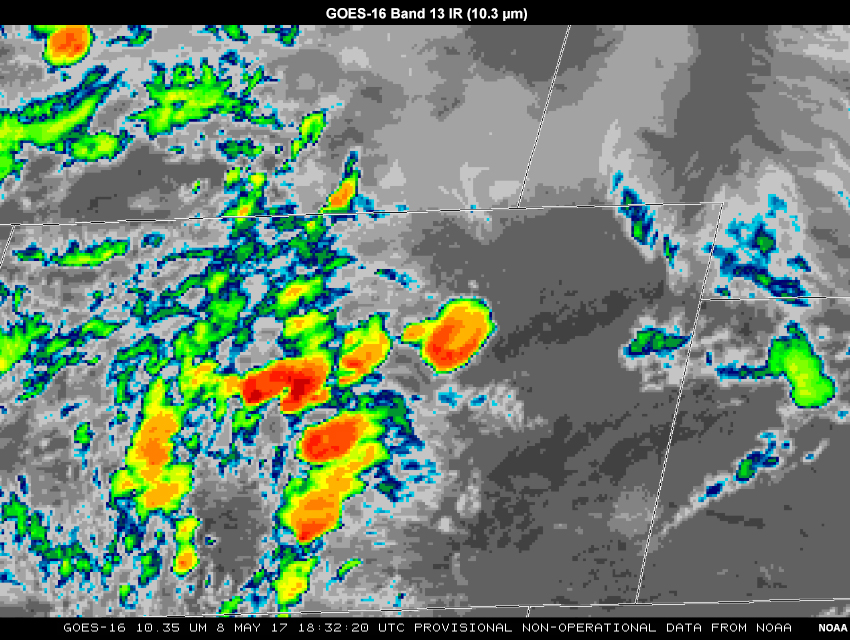
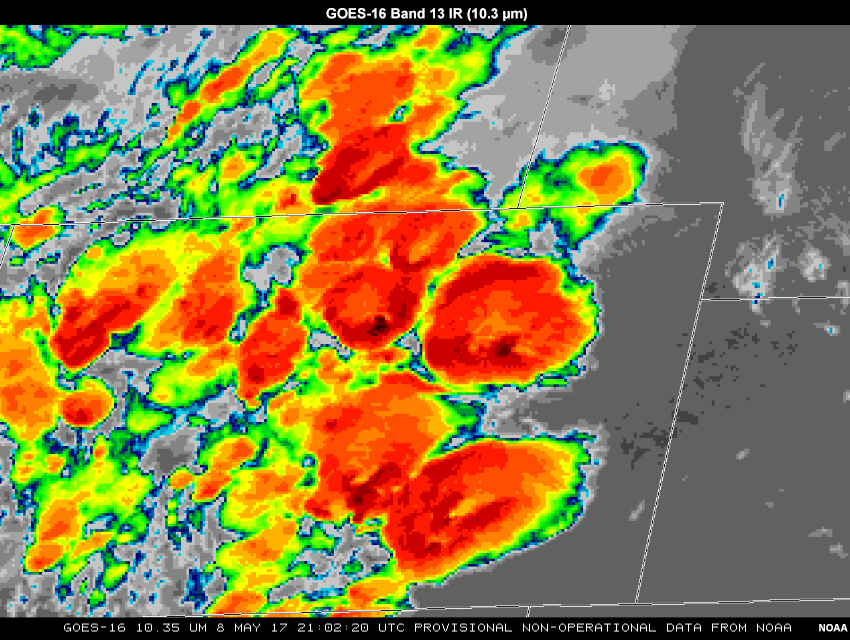
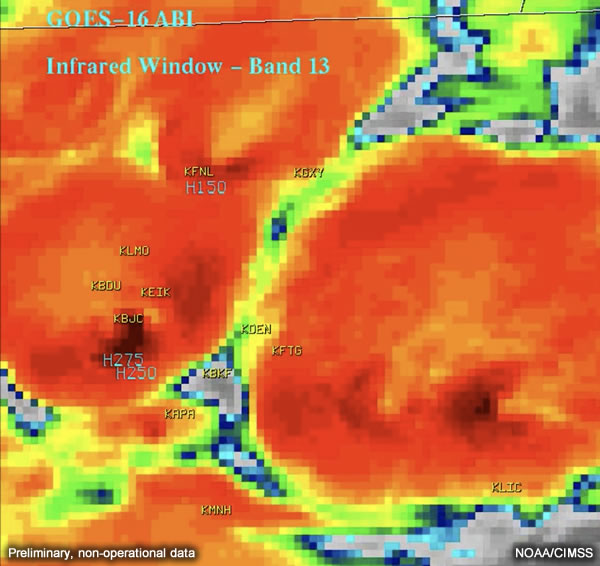
Which of the labeled cells at the end of the loop (1832Z), shown in the still IR image here, would you expect to increase and/or maintain intensity versus decrease in intensity?
Feedback will be presented in the following question on the next page.
Make sure you have completed all of the questions above before proceeding.
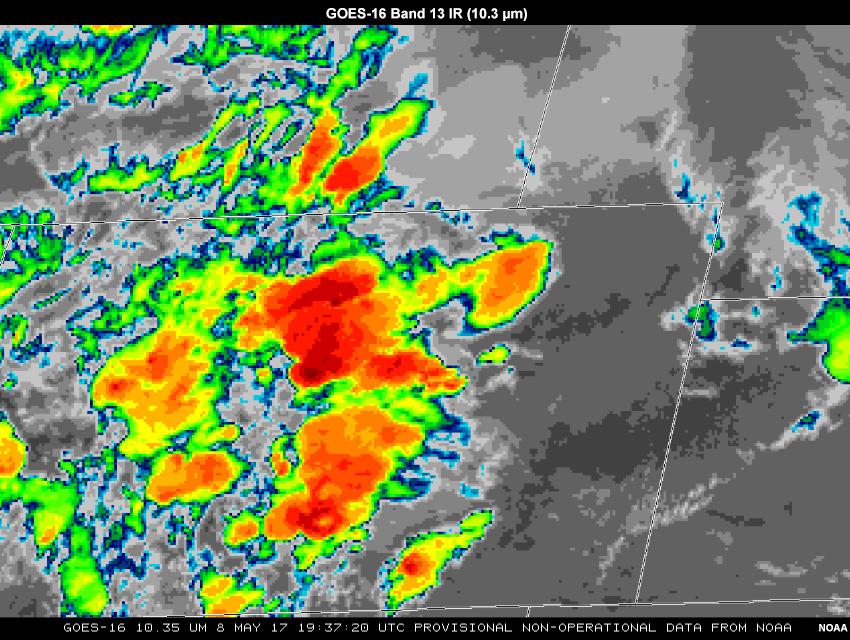
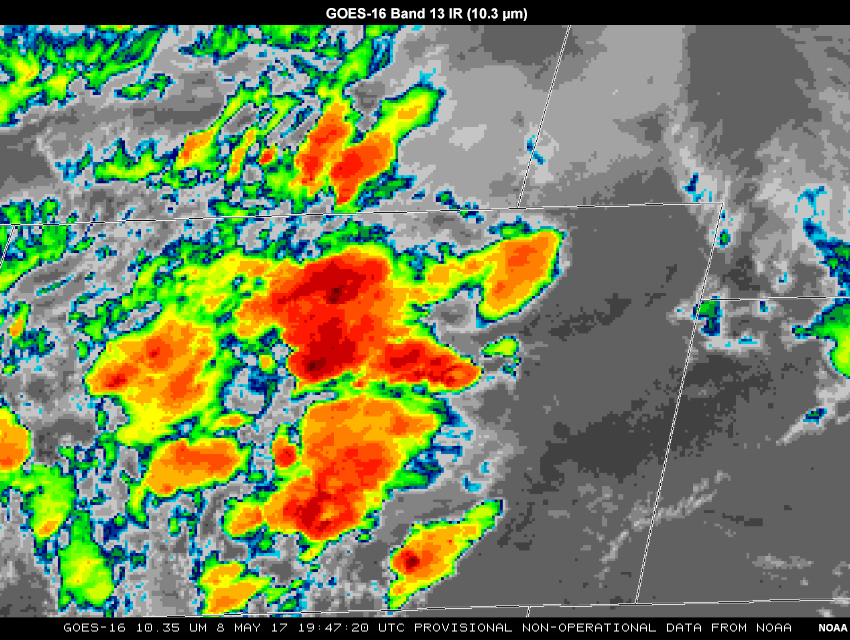
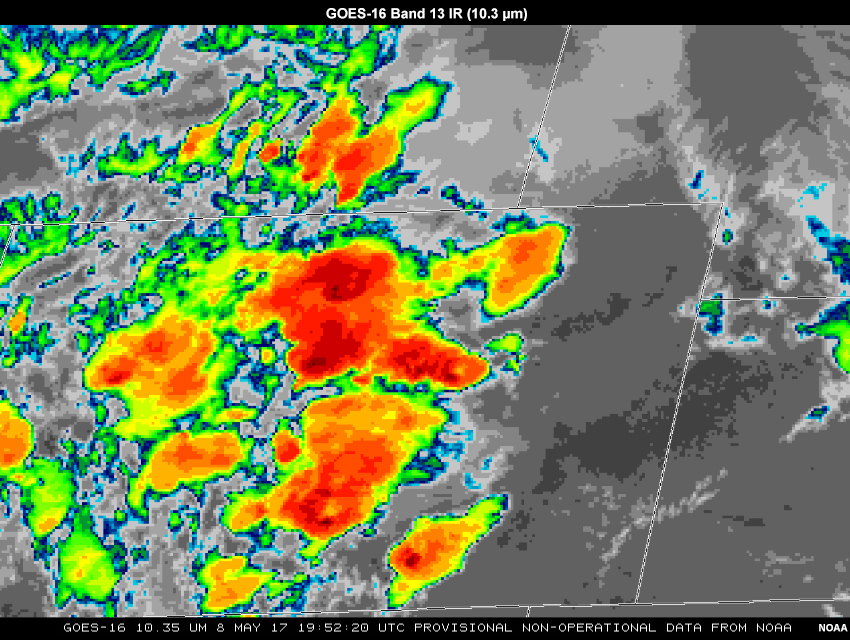
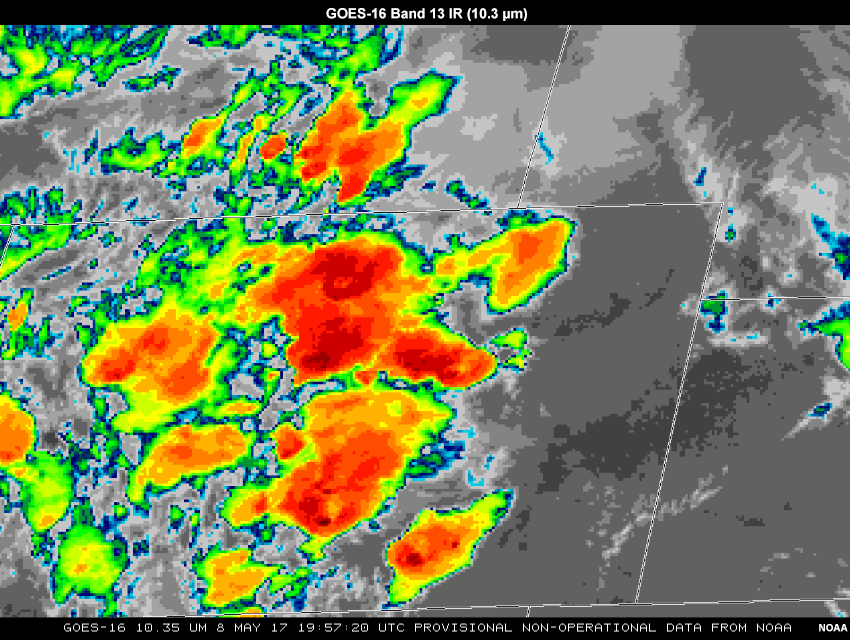
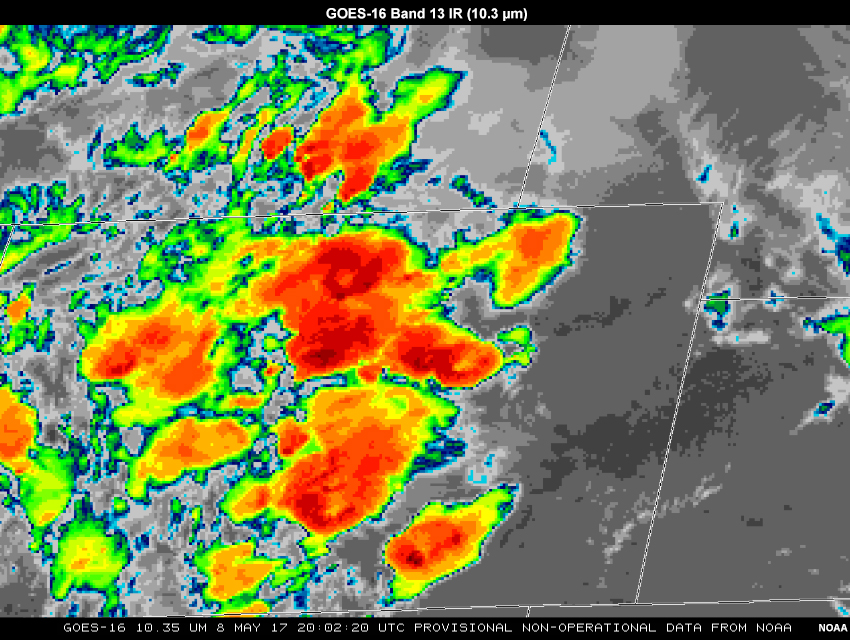
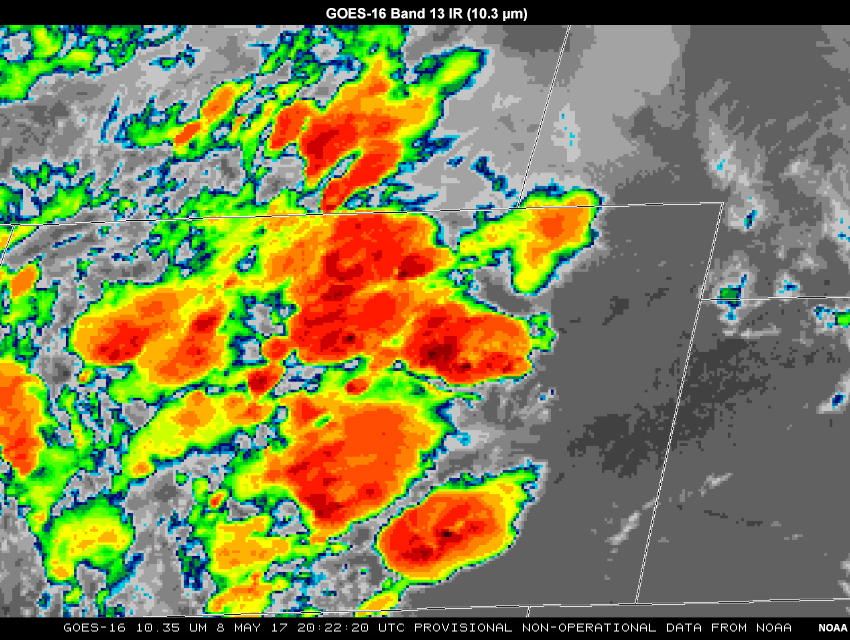
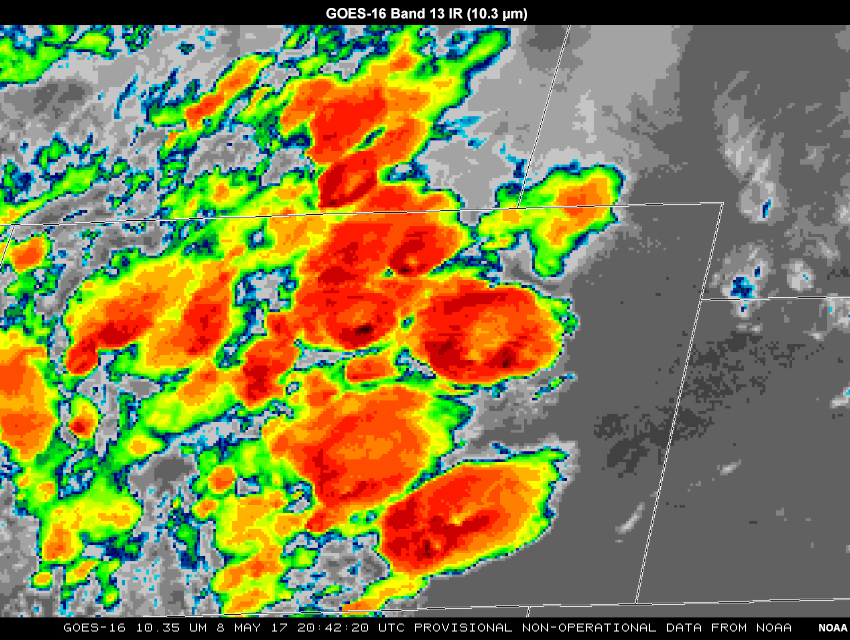
Example Case and Exercise: 8 May 2017 Colorado Hail Event » Exercise 3 - Intensity and Maintenance
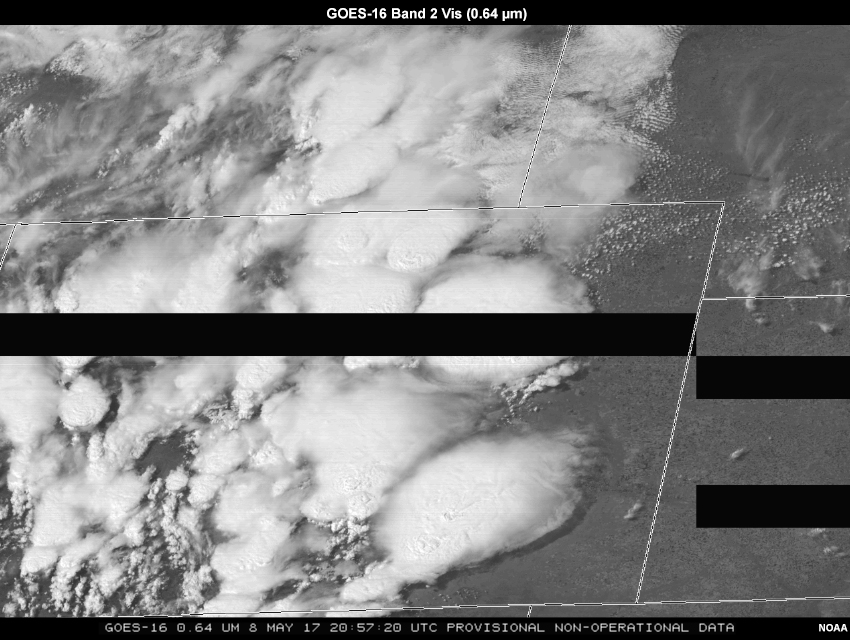
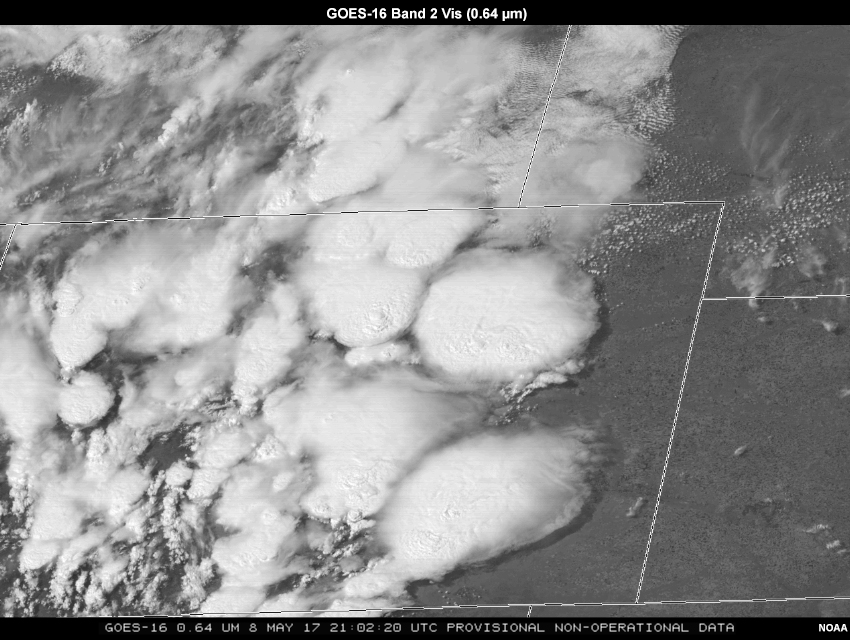
Use the following loop of visible and IR imagery to help you answer questions about the storm strength and maintenance.


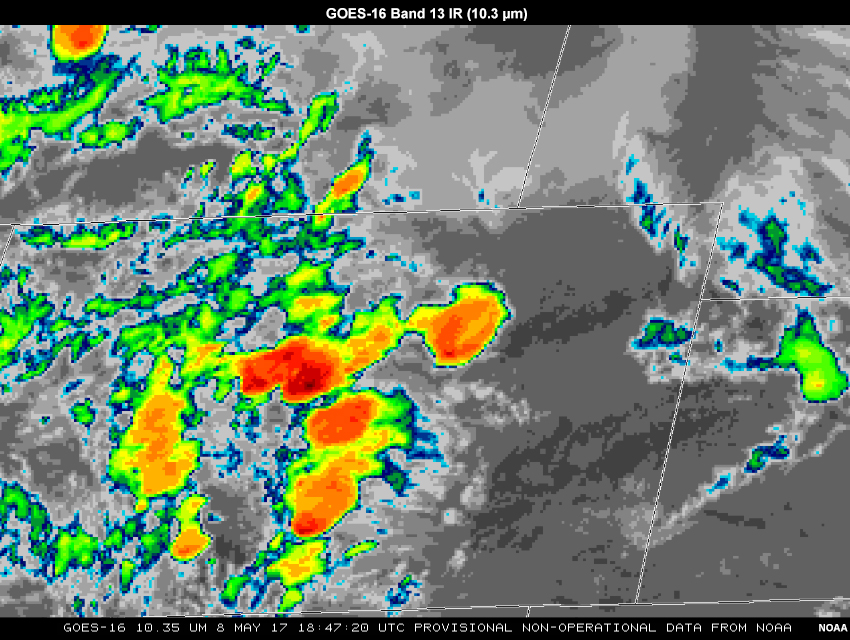
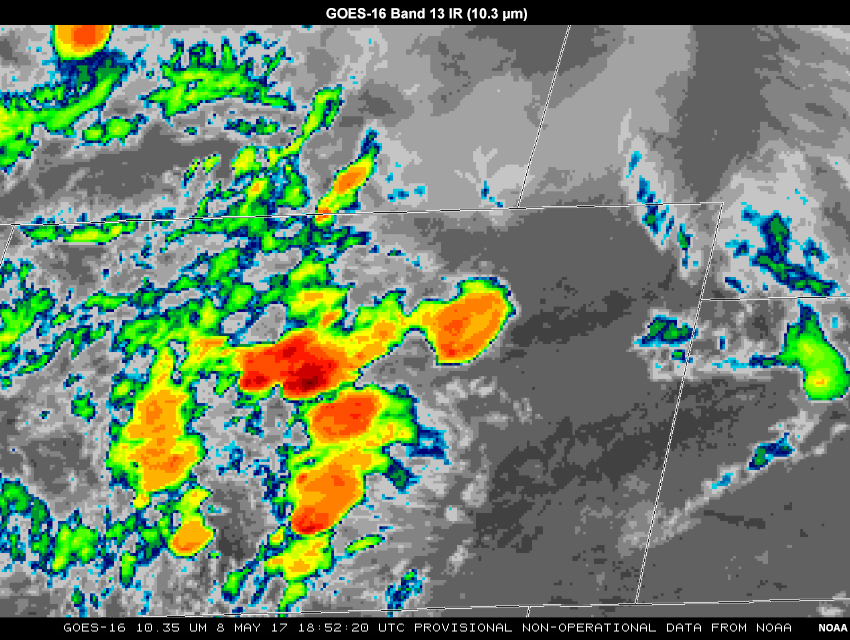
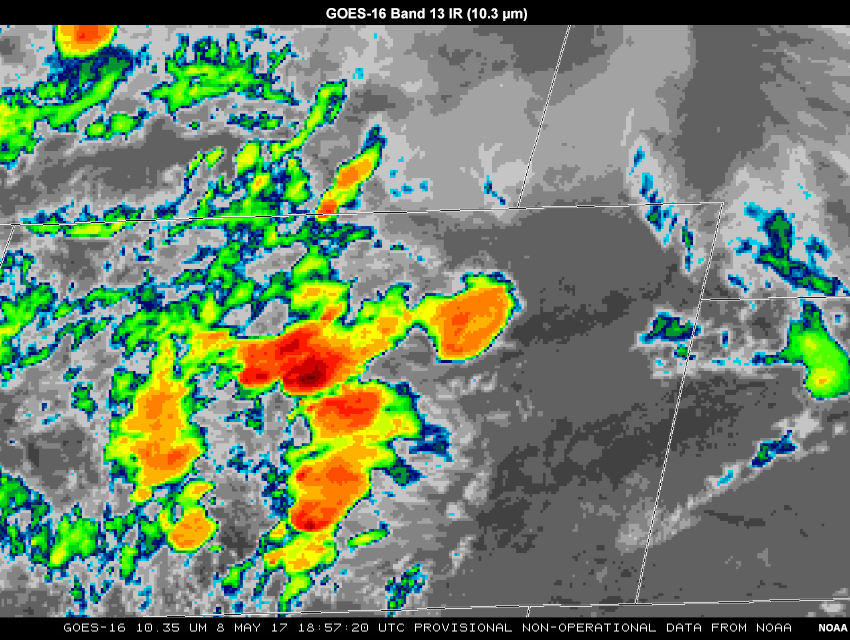
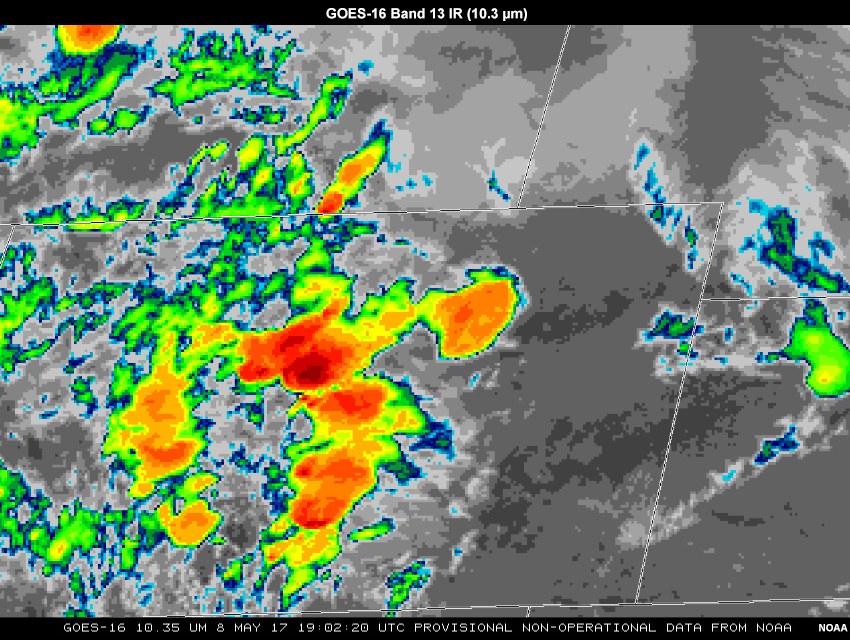
Q1 - Convective Maintenance
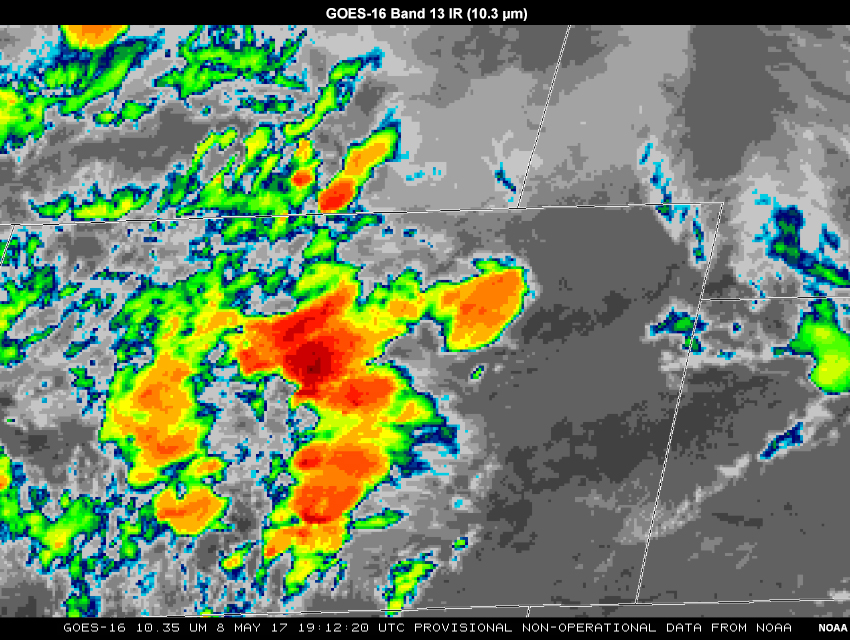
Practice Question 1
The labeled cells at 1832Z are shown here for your reference. Which of these cells increased or decreased in strength through 1902Z as shown in the loops above?
It appeared cell A would maintain strength or increase intensity at 1832Z at the end of the previous question, as it exhibited an enhanced-V signature, defined overshooting top on visible, and some cloud-top cooling (around 1-3°C/15 min) - however, it quickly lost the enhanced-V and some parts of the storm top stayed the same temperature or even warmed slightly, indicating by 1832Z that the storm was not likely to maintain itself.
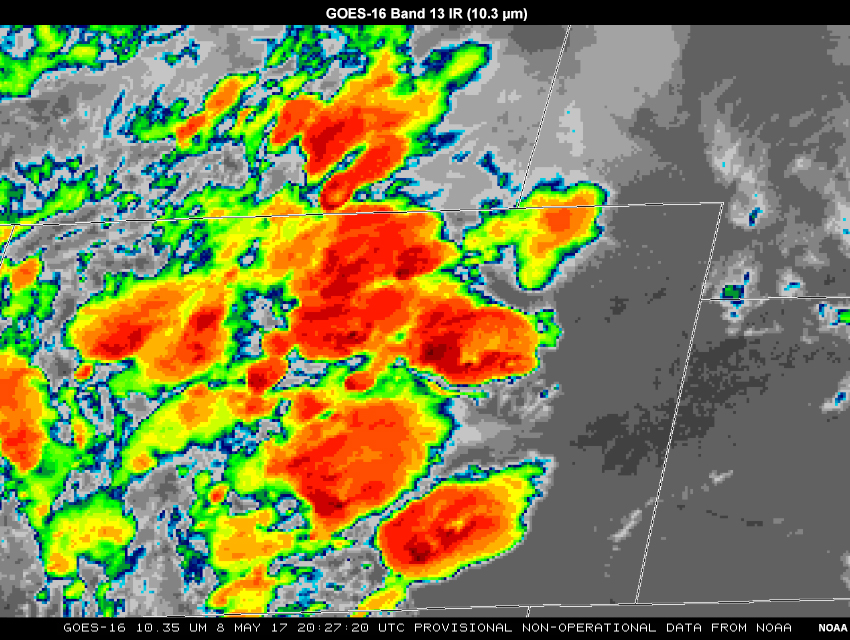
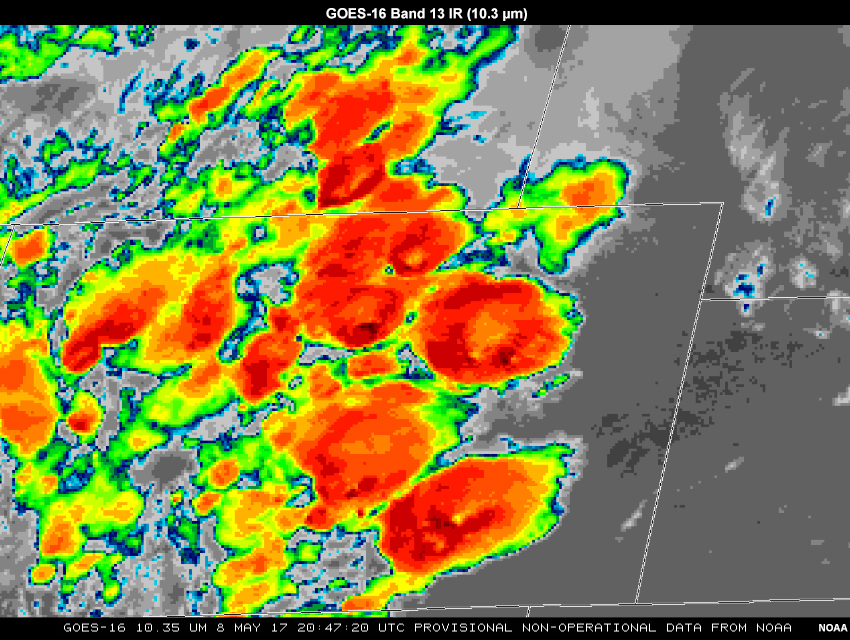
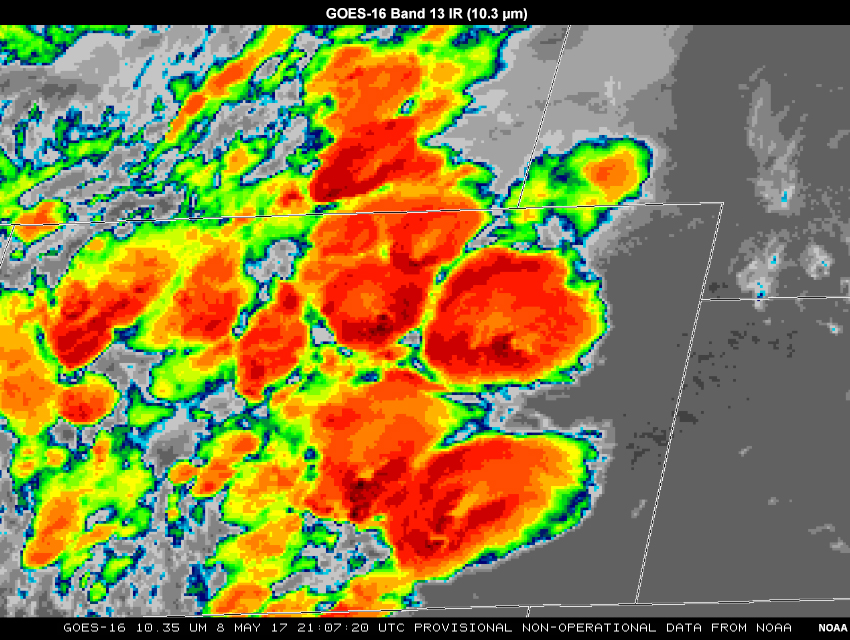
Cell B was newly developed with strong cooling and a noticeable overshooting top, suggesting it would continue to intensify somewhat or maintain its strength, as we saw continued cooling by about 5°C over the 1812Z - 1827Z period and expansion of the anvil. The cold anvil expanded in size significantly during the 1832-1902Z period, and along with the appearance of an pronounced overshooting top, signified a strong updraft.
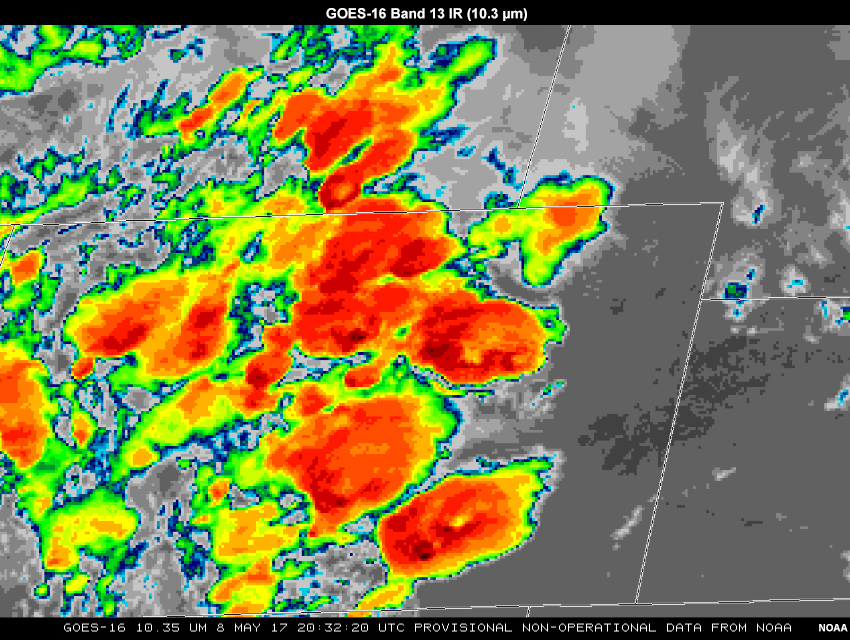
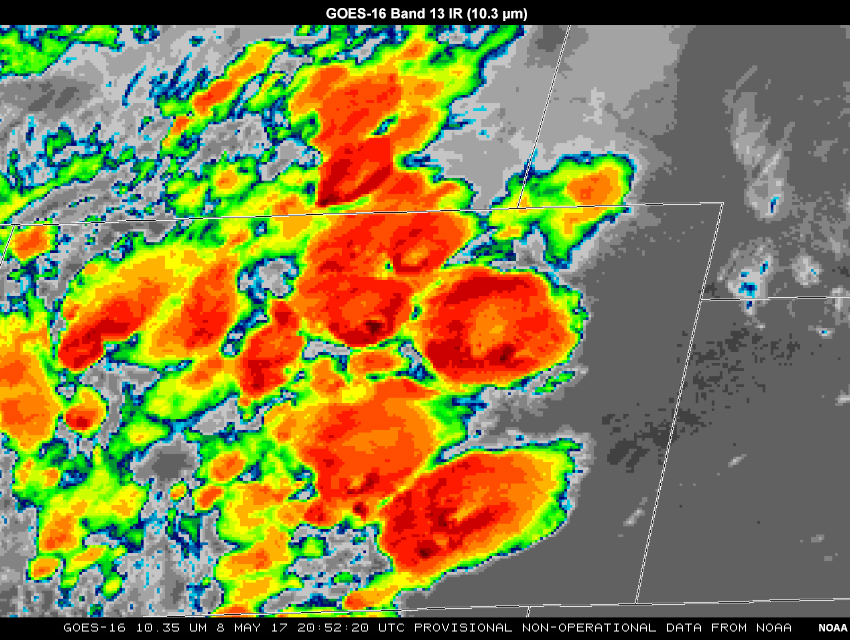
Cell C never demonstrated a pronounced overshooting top and only a hint of an enhanced-V, and cooling rates tapered off to a couple degrees per 15 minutes. By 1822Z, cloud top cooling ceased and afterward, slight warming was taking place.
Example Case and Exercise: 8 May 2017 Colorado Hail Event » Exercise 4 - Intensity and Maintenance Part 2


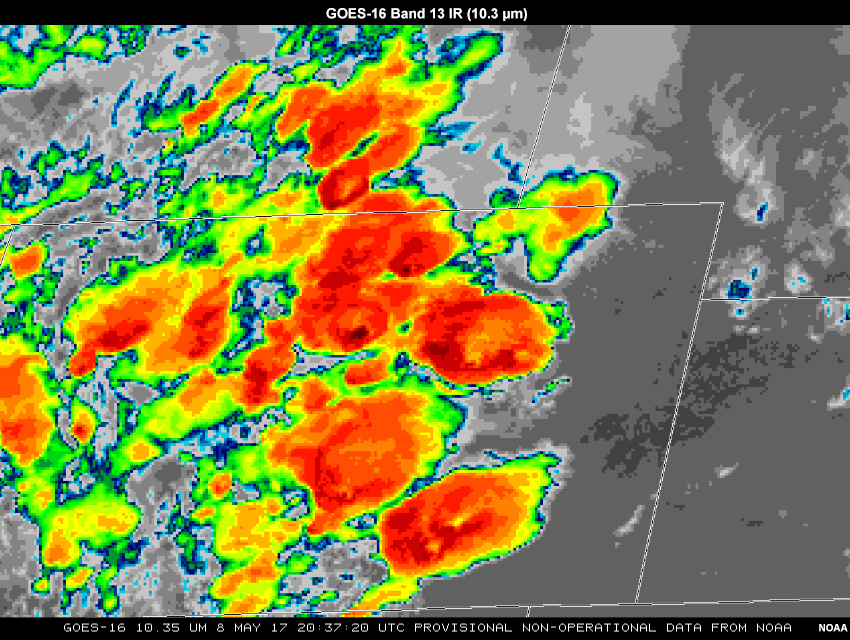

Q1 - Enh-V
Practice Question 1
Use the pen tool to outline any enhanced-V signatures present in the infrared image below. Refer back to the loop as needed to enhance your analysis.
| Tool: | Tool Size: | Color: |
|---|---|---|
|
|
Here several Vs are apparent from viewing the loop through 2112Z. What looks like a V in cell B is more due to the evolution of storm structure as it traversed off the mountains, and does not align with the overall mid/upper level flow, so it was not included in the analysis. Be sure to click through the tabs above to complete all three Practice Questions (Q1-Q3) before moving to the next page.
Q2 - OT
Practice Question 2
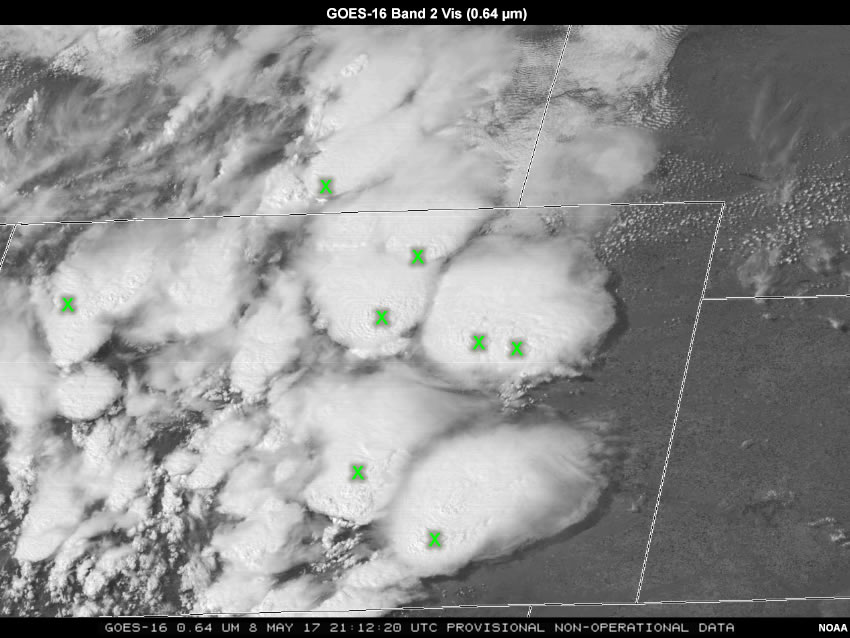
Directions: Drag an "x" to the center of each overshooting top that you can identify on the visible image. Then, toggle to the IR image and identify overshooting tops using the color-shaded temperature information, marking the center of each with a "+".
The most noticeable OTs are marked on the two images below. Some, such as the one in cell B that we've been tracking, exhibit prominent gravity waves emanating from their center. Others, such as the ones in the most northwestern and southeastern cells in Colorado, may not exactly match locations between IR and visible, due to rapidly evolving conditions and newly developing updrafts. Overall, the location of overshooting tops on visible imagery will be the center of a noticeable 'bubble' above the rest of the anvil, and may include the presence of gravity waves. On IR, OTs will be visible as cluster of pixels several degrees colder than the surrounding anvil. Near colocation of OTs between the two imagery types is common.

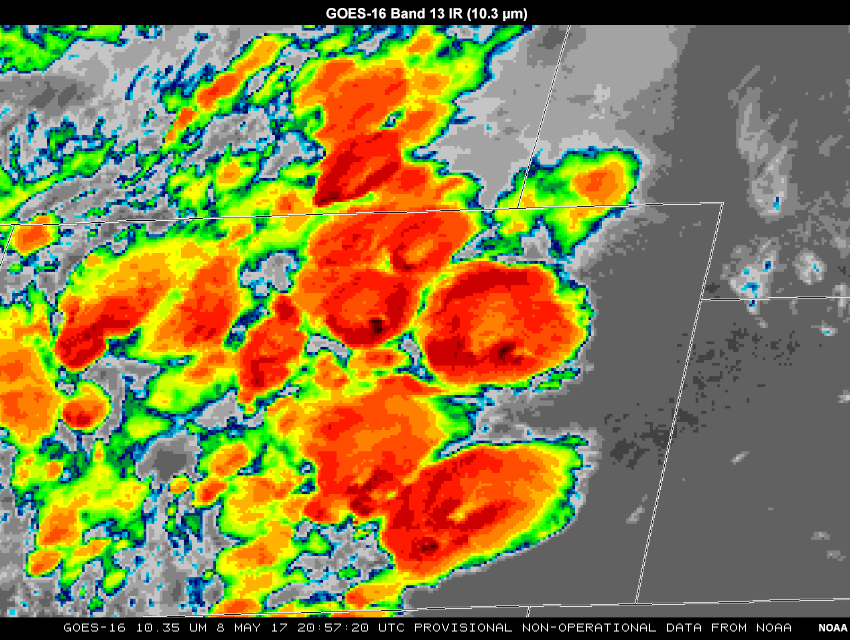
Q3 - CTT
Practice Question 3
Identify the approximate coldest cloud top temperature within the overshooting top in cell B by selecting it from the list below:
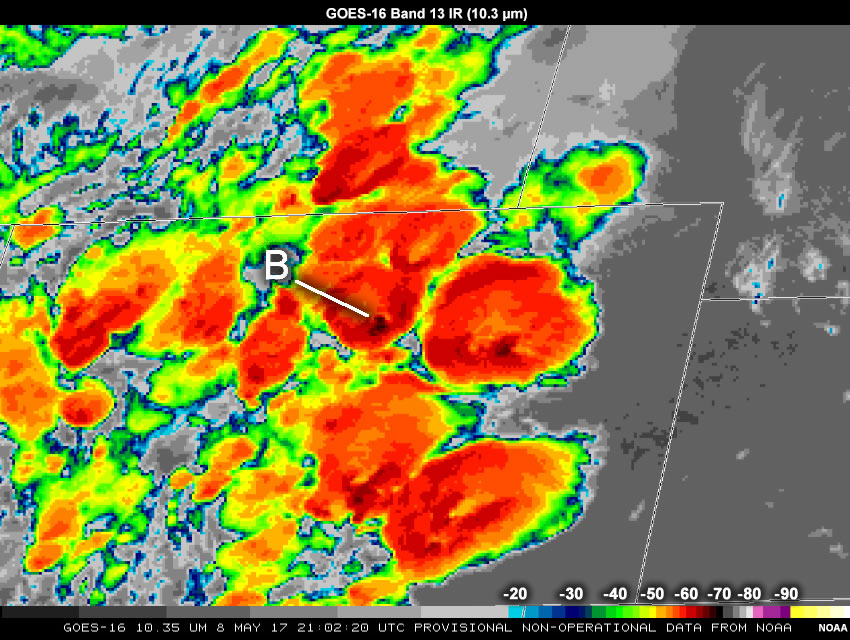
The correct answer is c.
At several points, notably around 2037Z, and around 2100Z, cell B showed consistent temperatures near or slightly below -70°C within its overshooting top. These timeframes and updraft locations slightly preceded and then coincided with reports of large hail, as shown in the parallax-corrected hail reports below:
Make sure you have completed all of the questions above before proceeding.
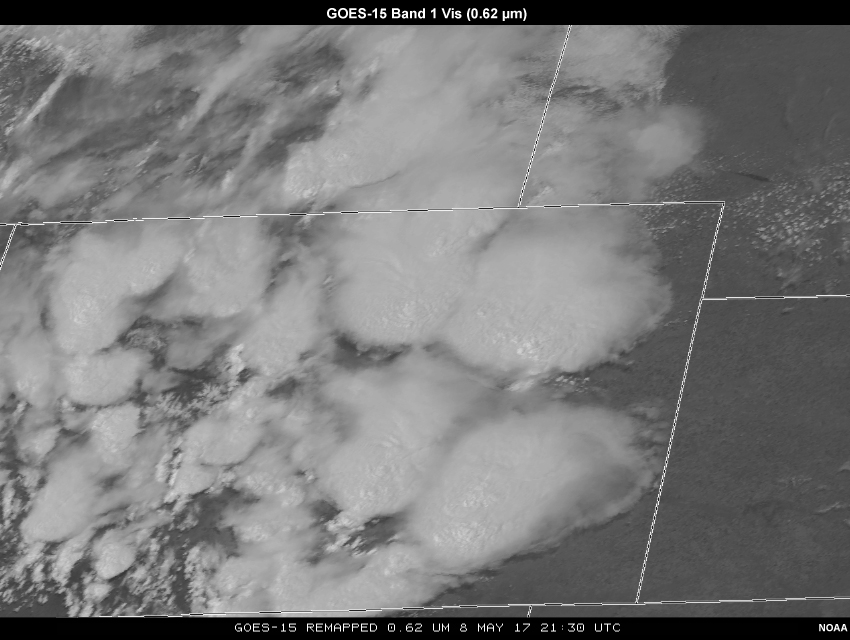
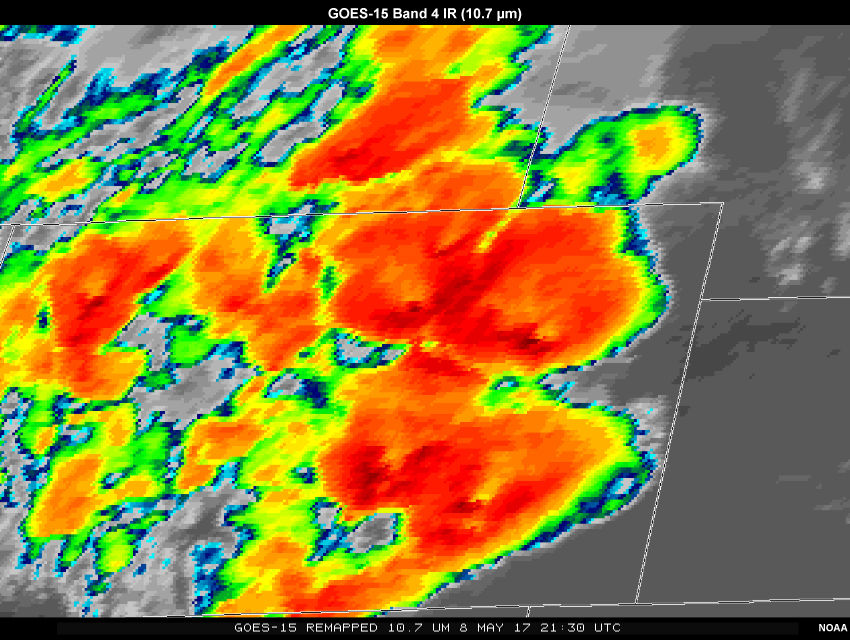
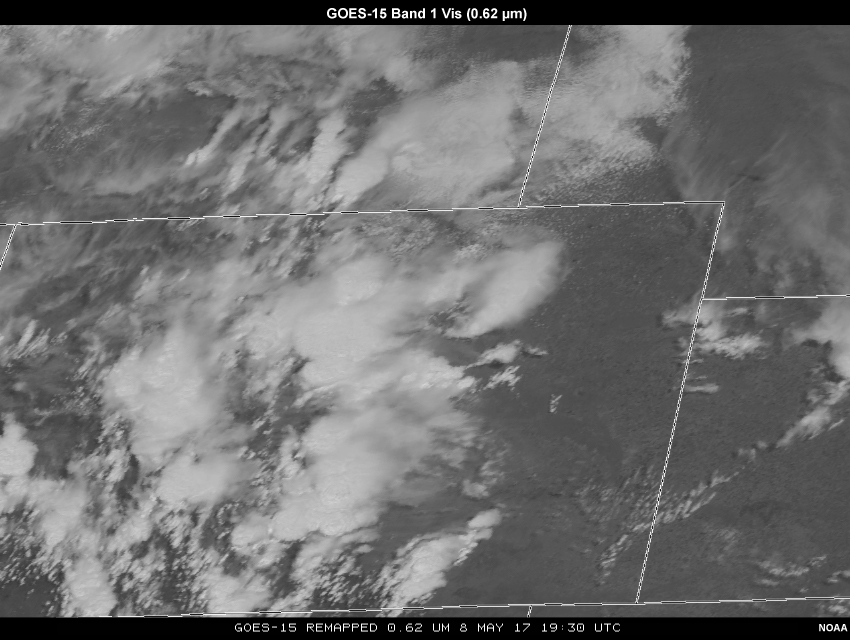
Example Case and Exercise: 8 May 2017 Colorado Hail Event » Exercise 5 - Compare to GOES-15
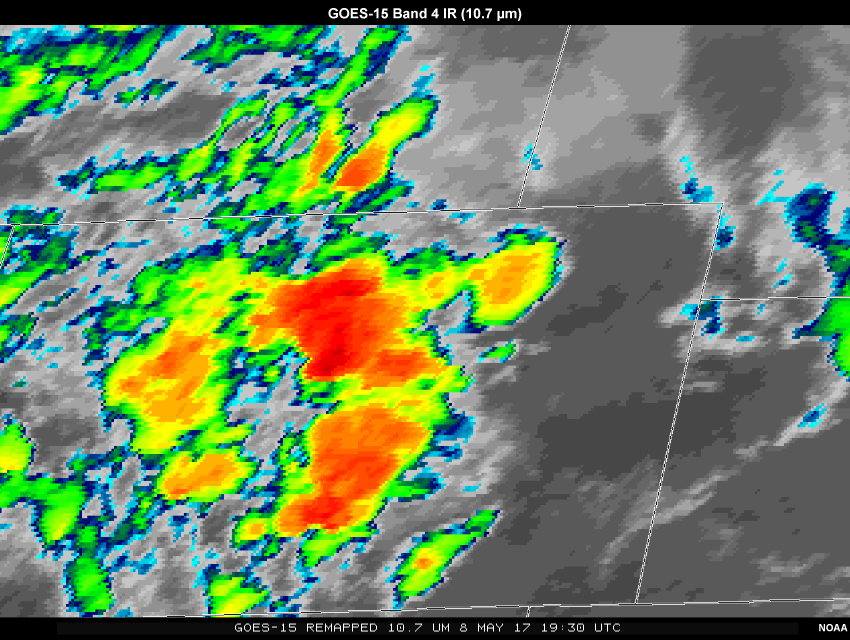
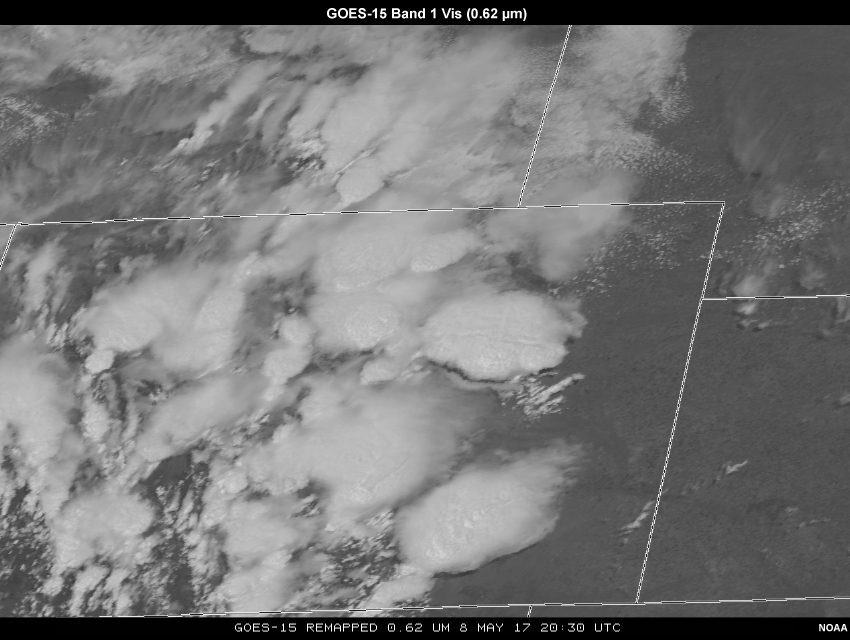
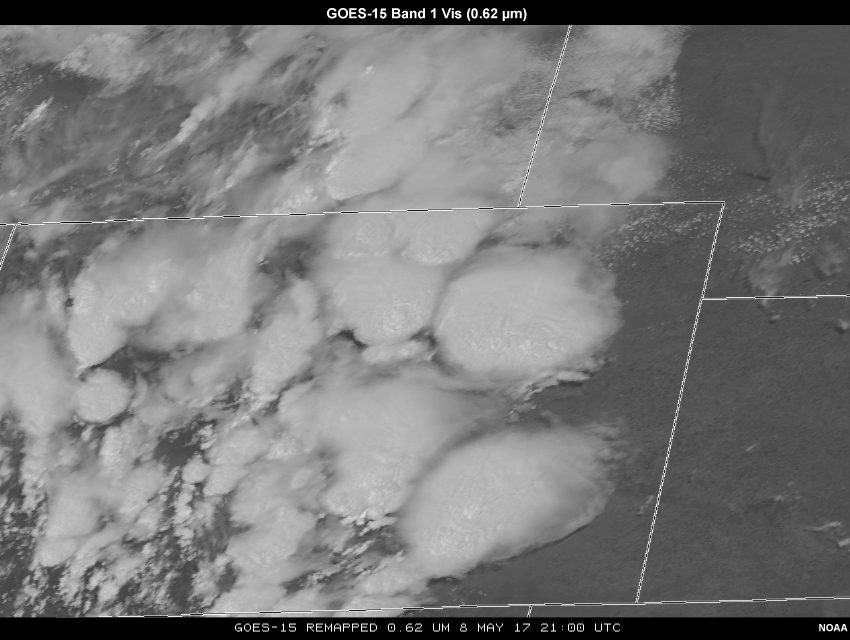
Here is a GOES-15 (west) loop of visible and IR data from the same times as the previous loop. The GOES-15 loop has 4 km spatial resolution and 15-minute temporal resolution, and has been parallax-corrected. Examine it in conjunction with the GOES-16 loop to answer the following question or have a discussion.


Practice Discussion
How did GOES-16 data improve detection of the following as compared to GOES-15?
- Convective indicators, like cumulus congestus and orphan anvils
- The presence and detail of enhanced-Vs
- The presence and detail of overshooting tops
- The coldest cloud top temperatures
Further examples are shown after entering your feedback and clicking "Done".
Here are just a handful of specific cell examples of the timing, feature identification and intensity improvements that GOES-16 allows over legacy GOES products:
From 1915Z to about 1945Z, GOES-16 visible provided much clearer details on the continued development of cumulus congestus, orphan anvils and inflow bands along the main low-level convergence line identified just north of the Palmer Divide at earlier times. These better-observed features provide important information on cap strength and potential for storm maintenance.

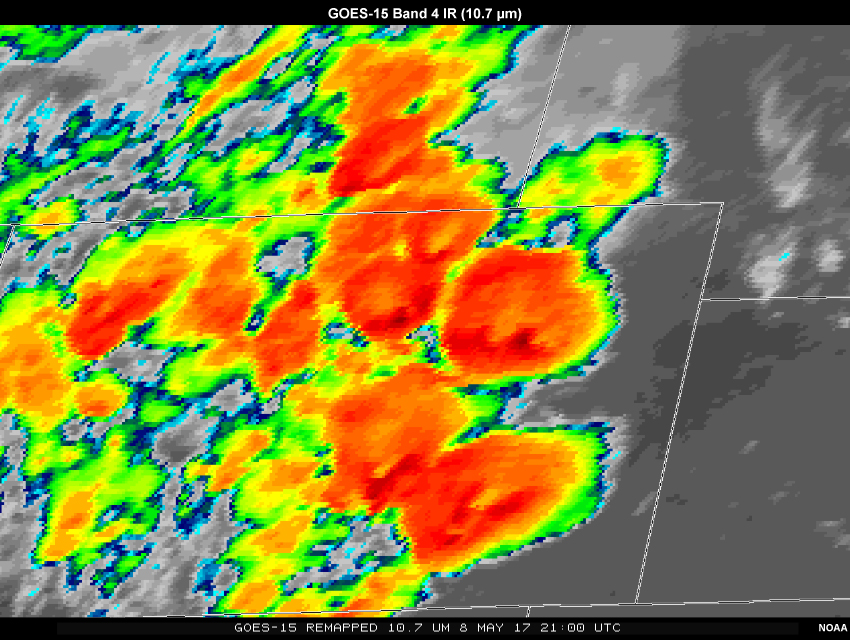
At 2045-2115Z, the advantages of viewing GOES-16 IR data are clear in terms of tracking overshooting tops - the strong, hail-producing updrafts of cell B are much more apparent in terms of lower cloud top temperatures and more detailed horizontal sampling than in GOES-15.
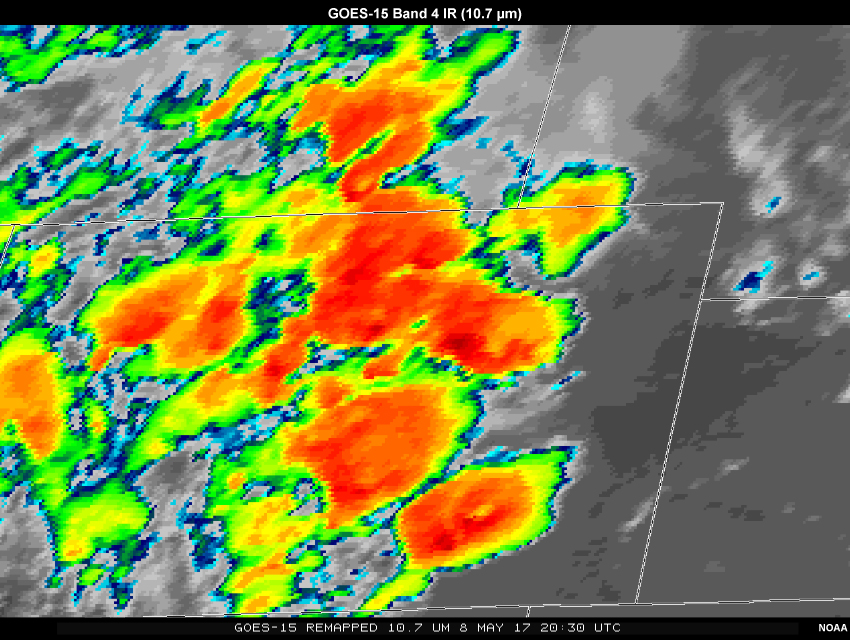

At 2112Z, we can see the detail GOES-16's increased spatial resolution provides across many cells, especially on IR with regard to the presence of enhanced Vs and the intensity of the overshooting tops. Enhanced Vs are noticeable on the two easternmost cells in Colorado on GOES-15, but are much more defined on GOES-16 data. The lowest cloud top temperatures are lower by several degrees on GOES-16 than on GOES-15, due to the respective 2 km and blockier 4 km sampling. The overshooting tops themselves show much more detail on GOES-16, in terms of visible gravity waves and richer texture on visible. GOES-15's infrared view of overshooting tops was limited to a handful of adjacent pixels that were of slightly-lower temperature.
Example Case and Exercises - 8 May 2017 Colorado Hail Event » Case Summary
Overall, several of the Colorado storms generated large hail, producing 26 hail reports in the state, eight of which were larger than 2 inches, with a maximum of 2.75 inches reported just west and north of Denver. This cell possessed a strong overshooting top throughout the 1830Z to 2100Z timeframe observed in this lesson, both in terms of cold cloud top temperatures (-70°C) and texture on visible imagery, including persistent, pronounced gravity waves emanating outward across the anvil. These convective details from this damaging cell, as well as several other strong cells, were readily apparent in GOES-16 data while legacy products afforded a view of the storms that did not fully capture their intensity or potential for continued maintenance. Low-level features, such as inflow bands, cumulus streets and orphan anvils were much more diagnosable using the new GOES-16 imagery.
You have reached the end of the lesson. Please complete the quiz and share your feedback with us via the user survey.
Resources and References
RAMMB Real-Time GOES-16 Viewer
Bedka, Kristopher, Jason Brunner, Richard Dworak, Wayne Feltz, Jason Otkin, and Thomas Greenwald. "Objective satellite-based detection of overshooting tops using infrared window channel brightness temperature gradients." Journal of applied meteorology and climatology 49, no. 2 (2010): 181-202.
Bedka, Kristopher M. "Overshooting cloud top detections using MSG SEVIRI Infrared brightness temperatures and their relationship to severe weather over Europe." Atmospheric Research 99, no. 2 (2011): 175-189.
Dworak, Richard, Kristopher Bedka, Jason Brunner, and Wayne Feltz. "Comparison between GOES-12 overshooting-top detections, WSR-88D radar reflectivity, and severe storm reports." Weather and Forecasting 27, no. 3 (2012): 684-699.
Line, William E., Timothy J. Schmit, Daniel T. Lindsey, and Steven J. Goodman. "Use of Geostationary Super Rapid Scan Satellite Imagery by the Storm Prediction Center." Weather and Forecasting 31, no. 2 (2016): 483-494.
Hartung, Daniel C., Justin M. Sieglaff, Lee M. Cronce, and Wayne F. Feltz. "An intercomparison of UW cloud-top cooling rates with WSR-88D radar data." Weather and Forecasting 28, no. 2 (2013): 463-480.
Roberts, Rita D., and Steven Rutledge. "Nowcasting storm initiation and growth using GOES-8 and WSR-88D data." Weather and Forecasting 18, no. 4 (2003): 562-584.
Contributors
COMET Sponsors
MetEd and the COMET® Program are a part of the University Corporation for Atmospheric Research's (UCAR's) Community Programs (UCP) and are sponsored by NOAA's National Weather Service (NWS), with additional funding by:
- Bureau of Meteorology of Australia (BoM)
- Bureau of Reclamation, United States Department of the Interior
- European Organisation for the Exploitation of Meteorological Satellites (EUMETSAT)
- Meteorological Service of Canada (MSC)
- NOAA's National Environmental Satellite, Data and Information Service (NESDIS)
- NOAA's National Geodetic Survey (NGS)
- National Science Foundation (NSF)
- Naval Meteorology and Oceanography Command (NMOC)
- U.S. Army Corps of Engineers (USACE)
To learn more about us, please visit the COMET website.
Project Contributors
Program Manager
- Amy Stevermer
Project Lead
- Andrea Smith
Instructional Design
- Andrea Smith
Science Advisors
- Bill Line, NOAA NWS
- Mel Nordquist, NOAA NWS
- Patrick Dills, COMET
- Bryan Guarente, COMET
- James Gurka, NOAA NESDIS & CICS-MD
- Scott Lindstrom, CIMSS
Data Resources
- Scott Lindstrom, CIMSS
Graphics/Animations
- Steve Deyo
- Bryan Guarente
Multimedia Authoring/Interface Design
- Bryan Guarente
- Gary Pacheco
COMET Staff, November 2017
Director's Office
- Dr. Elizabeth Page, Director
- Tim Alberta, Assistant Director, Operations and IT
- Paul Kucera, Assistant Director, International Capacity Development
Business Administration
- Lorrie Alberta, Administrator
- Tara Torres, Program Coordinator
IT Services and Production Services
- Bob Bubon, Systems Administrator
- Steve Deyo, Graphic and 3D Designer
- Dolores Kiessling, Software Engineer
- Gary Pacheco, Web Designer and Developer
- Sylvia Quesada, Production Assistant
- Joey Rener, Software Engineer
- Malte Winkler, Software Engineer
International Program
- Dr. Richard Jeffries, Principal Investigator
- Rosario Alfaro Ocampo, Translator/Meteorologist
- Bruce Muller, Project Manager
- David Russi, Spanish Translations
- Martin Steinson, Project Manager
Production Services
- Steve Deyo, Graphic and 3D Designer
- Dolores Kiessling, Software Engineer
- Gary Pacheco, Web Designer and Developer
- Sylvia Quesada, Production Assistant
Instructional Services
- Dr. Alan Bol, Scientist/Instructional Designer
- Tsvetomir Ross-Lazarov, Instructional Designer
Science Group
- Dr. William Bua, Meteorologist
- Patrick Dills, Meteorologist
- Bryan Guarente, Meteorologist
- Matthew Kelsch, Hydrometeorologist
- Andrea Smith, Meteorologist
- Amy Stevermer, Meteorologist
- Vanessa Vincente, Meteorologist