Introduction: 1045 am, 19 July 2018
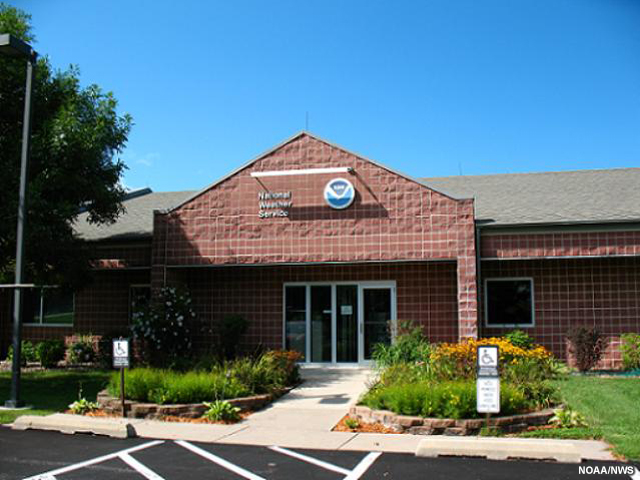
The National Weather Service Weather Forecast Office in Des Moines, Iowa.
It is 1545 UTC (1045 am local time) on 19 July 2018 in the Des Moines, Iowa, National Weather Service (NWS) Weather Forecast Office (WFO) and you are checking the latest guidance and products to determine how weather conditions might evolve into the afternoon.
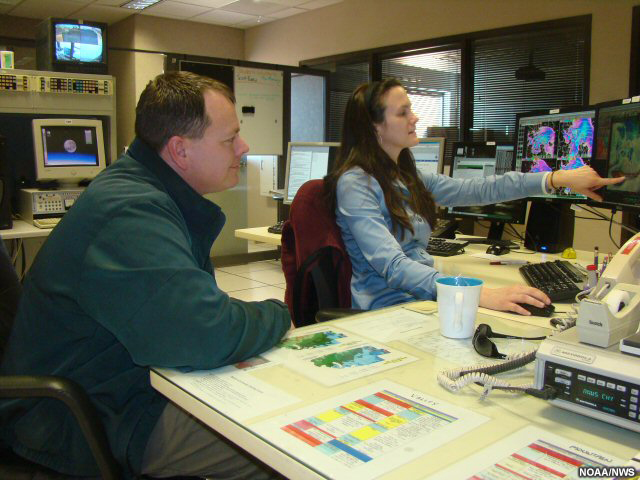
Two forecasters discuss the weather outlook for the day.
You turn to your forecast colleague on shift and remark, “The weather situation for today definitely looks concerning.”
She replies, “Yes, we’re already planning for most of us to stay on shift longer today. And we’re evaluating whether we should get some staff in early, to have more support ahead of the afternoon shift. Already there’s a lot of decision support going out prior to anything severe building. We’ve given a heads up to emergency managers in several counties that there is a potential for severe weather today.”
You look at the product displays on your workstation and comment, “Let’s check in on what the current guidance is showing. If it does look like things will start to spin up this afternoon, we can start planning now for what we might need.”
Question
If severe weather develops in your area, your office will be using all available tools to produce the most accurate and timely forecasts. Which of the following outcomes will depend on you having a full suite of information about the current environmental set-up to inform your forecasts? Choose all that apply.
The correct answers are highlighted above.
All of the above depend on having a full suite of information about the current environmental set-up so that you can produce the most accurate and timely forecasts, particularly if severe weather develops in your area. As part of your job on the forecast desk, you will continuously monitor the weather, adjust your forecast to reduce uncertainties, and consider other factors that may increase the significance of the expected weather.As you complete your forecast tasks for today, you will explore how GOES-R and JPSS satellite information can be used to help build situational awareness of the weather, by using satellite products to help assess the pre-convective environment and identify convective initiation signatures.
This training lesson uses a convective case as an example to illustrate satellite applications; it is not a ‘one size fits all’ lesson. One goal of this lesson is to help you understand the utility of certain satellite products in convective situations so that you can apply these skills to your own convective weather forecasting situations.
Let’s begin by taking a look at the weather conditions across southern Minnesota, Iowa, and the surrounding area this morning.
Environmental Set-up
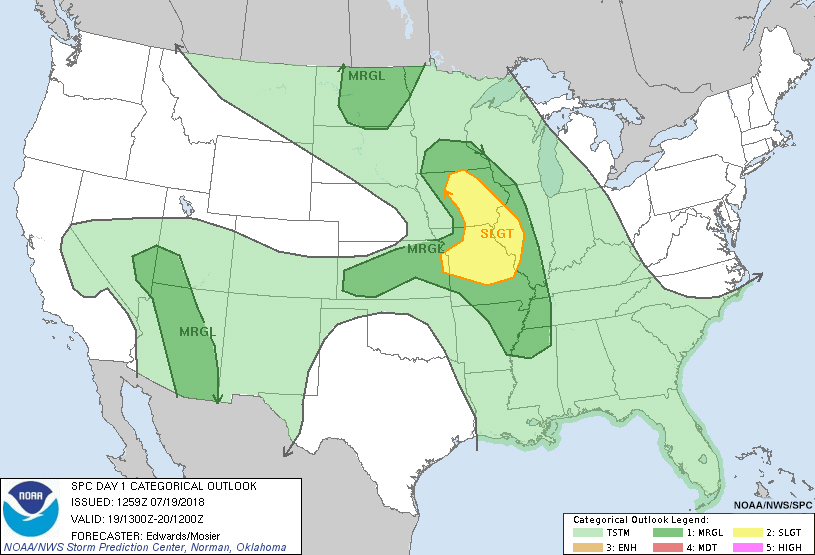
SPC Outlook
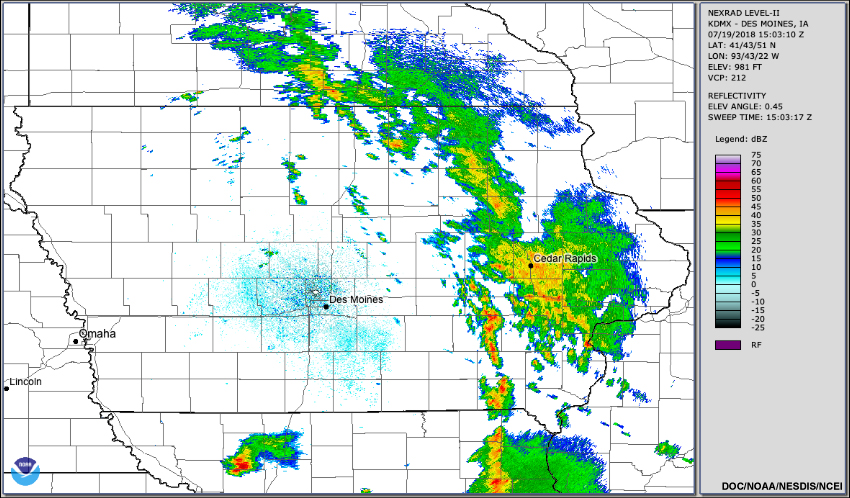
Radar Composite
Surface Analysis
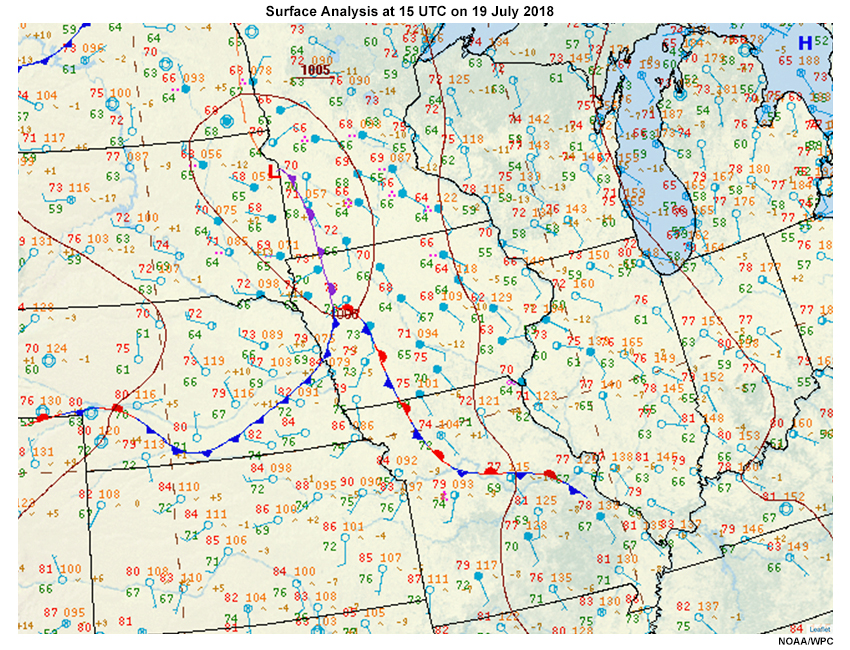
It is 1600 UTC (1100 am local time) on 19 July 2018. The Storm Prediction Center (SPC) has issued a Slight Risk of severe thunderstorms this afternoon and early tonight over parts of Iowa. Supercells capable of producing large hail, damaging winds, and tornadoes are possible.
Currently, early morning convection continues to move out of eastern portions of Iowa. The convection is ahead of a stationary front associated with a surface low tracking across southern Minnesota.
You click through some of the available products. “The guidance from this morning definitely indicates the potential for severe weather later today. I’m trying to get a better grasp on precisely when.”
Your colleague remarks, “From what we observed so far, the boundary is likely to move north/northeast as a warm front into the afternoon. That warm front will be the focus for convective redevelopment as skies clear up to support destabilization.”
“Based on the movement, we’ll probably have the potential for significant convection by mid-afternoon,” you reply.
Your colleague nods. “Terrence is scheduled to come in at 3. Let’s get him here early.”
You begin loading some more products to view. “That sounds good. I’m taking a look at some of the satellite analyses now to get a sense of overall moisture availability and other factors supporting convection later today.”
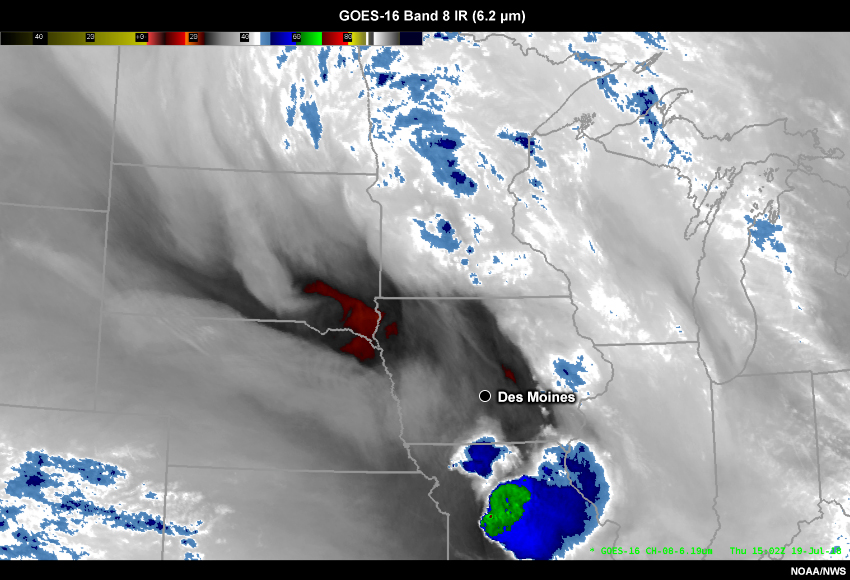
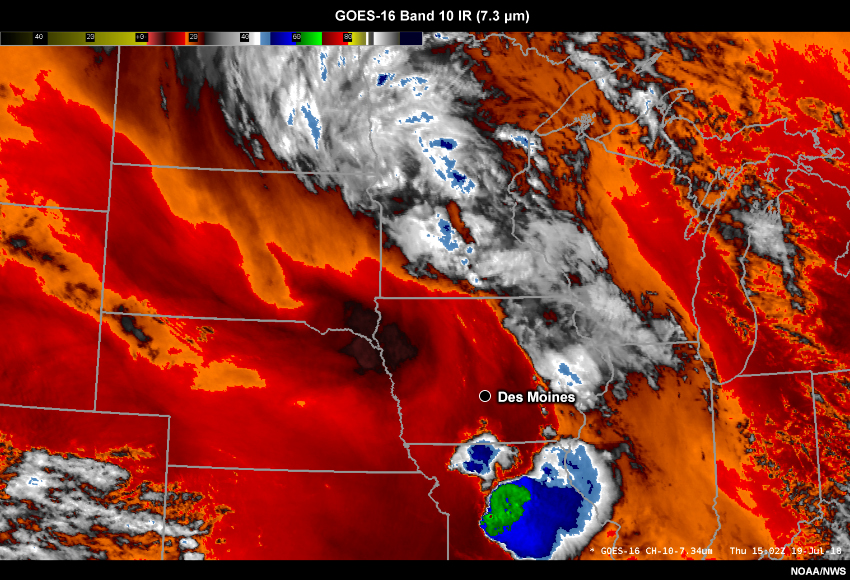
Environmental Set-up » Water Vapor Analysis
You start by looking at the water vapor satellite imagery to get an idea of the large-scale atmospheric setup and features of interest.
Upper-Troposphere Water Vapor
Low-level Troposphere Water Vapor
Question
Review the water vapor satellite imagery above. Which of the following statements best describes your assessment of the synoptic pattern? Choose the best answer.
The correct answer is d.
You have correctly interpreted the upper-level synoptic pattern and forcing that will play a role in convective redevelopment this afternoon. You will continue to monitor how these atmospheric conditions progress, especially given the forecast uncertainties resulting from this morning’s convection.Next, you would like to gain insight into the depth of moisture at different levels of the atmosphere, which may not be apparent in the water vapor satellite imagery, as well as moisture transport across the region.
Environmental Set-up » Advected Layer Precipitable Water
The product you select for a better view of moisture distribution and transport is the Advected Layer Precipitable Water (ALPW) product. This product uses microwave retrievals from polar-orbiting satellites to provide information about layer moisture depth (in inches) and moisture transport in four atmospheric layers. It can be accessed via the NWS Local Data Manager (LDM) and from the CIRA website.
Question
Review the ALPW product loop above. What can the ALPW product tell you about the trend in convective instability and potential for convective redevelopment later this afternoon? Choose the best answer.
The correct answer is b.
You correctly interpreted the transport of moisture from the Gulf of Mexico into the region, which will increase surface dewpoints across the state. Meanwhile, drier air from the mid- to upper-levels of the atmosphere is moving into western portions of Iowa. If lift occurs in this environment, the mid levels will cool at a greater rate than the low levels of the atmosphere. Both the moisture advection and expected surface heating will help to build the instability and yield an environment favorable for convection later this afternoon.Cloud Features and Stability
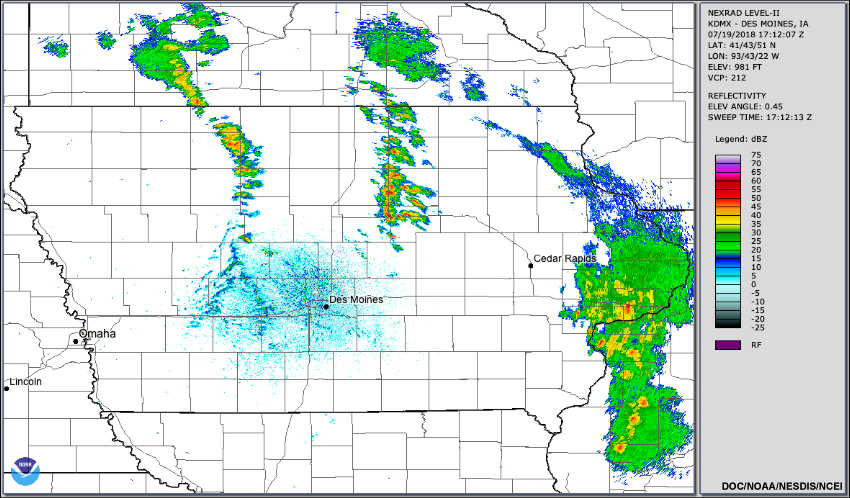
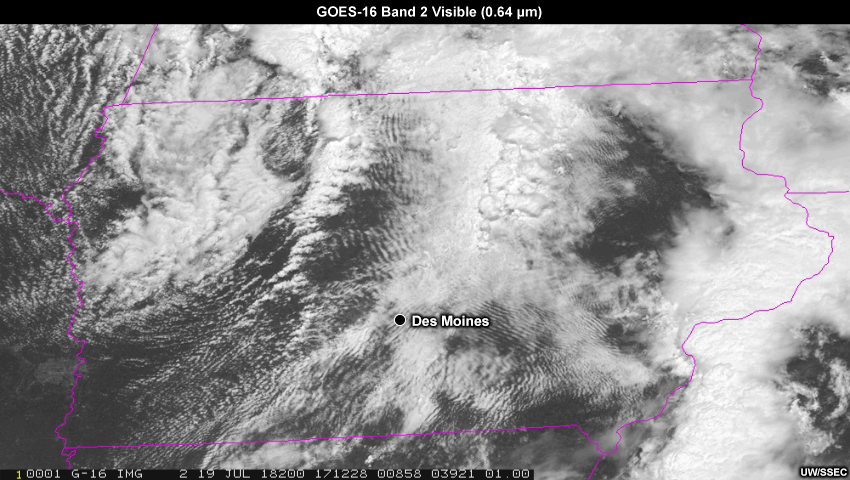
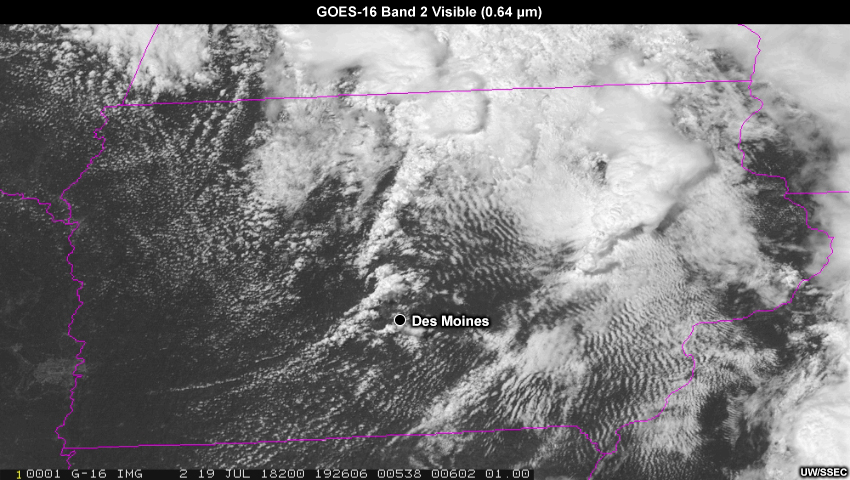
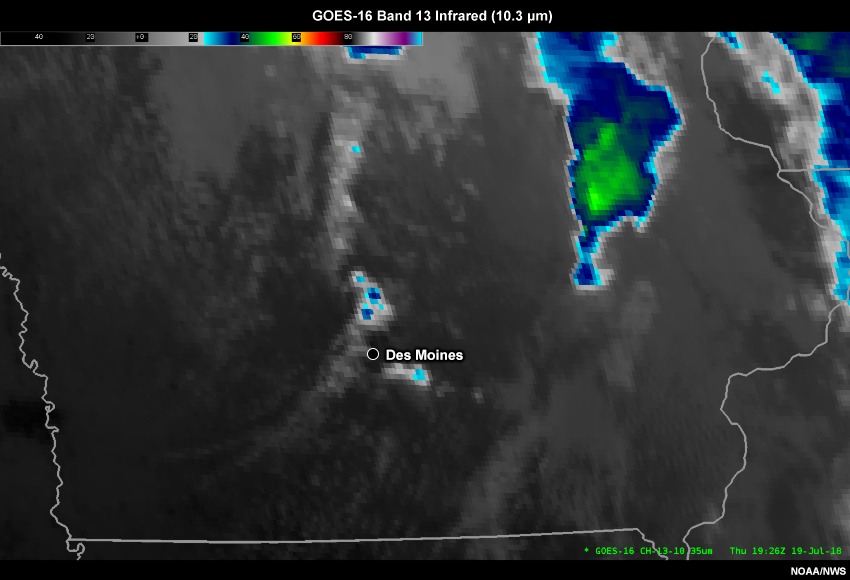
It's now 1715 UTC (1215 pm local time). You are looking at radar and visible satellite imagery to see how weather conditions are evolving during the late morning and into the afternoon hours.
Radar Composite
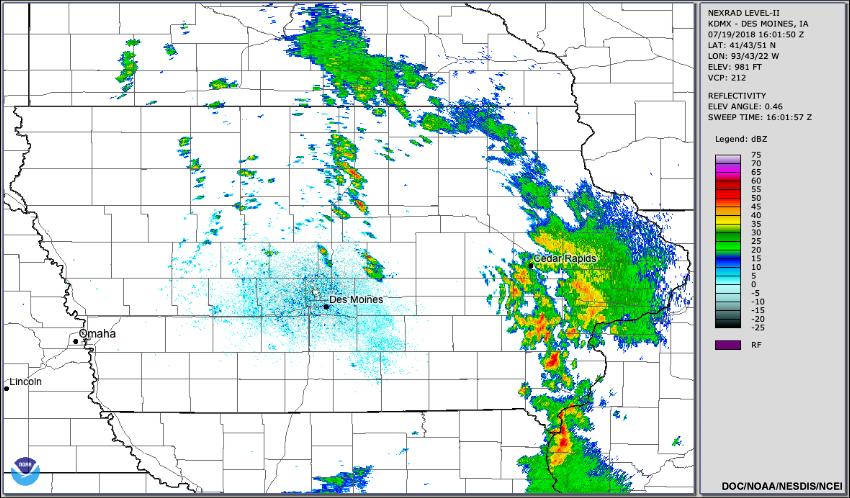
Visible Satellite
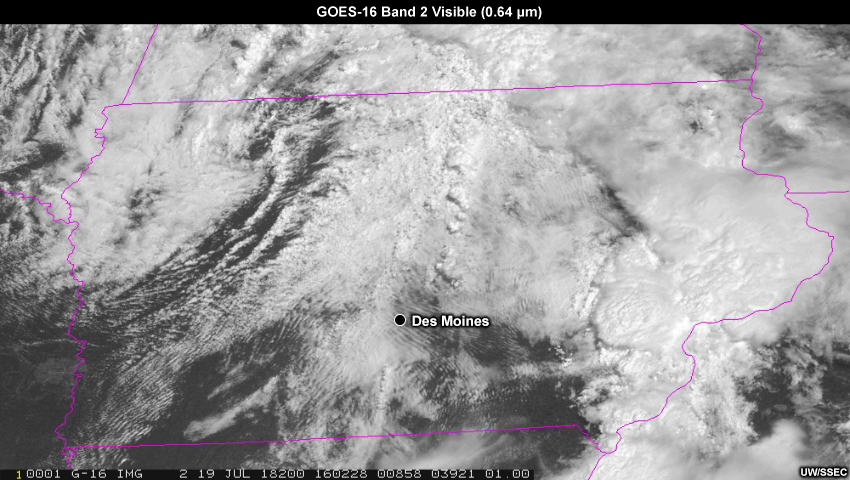
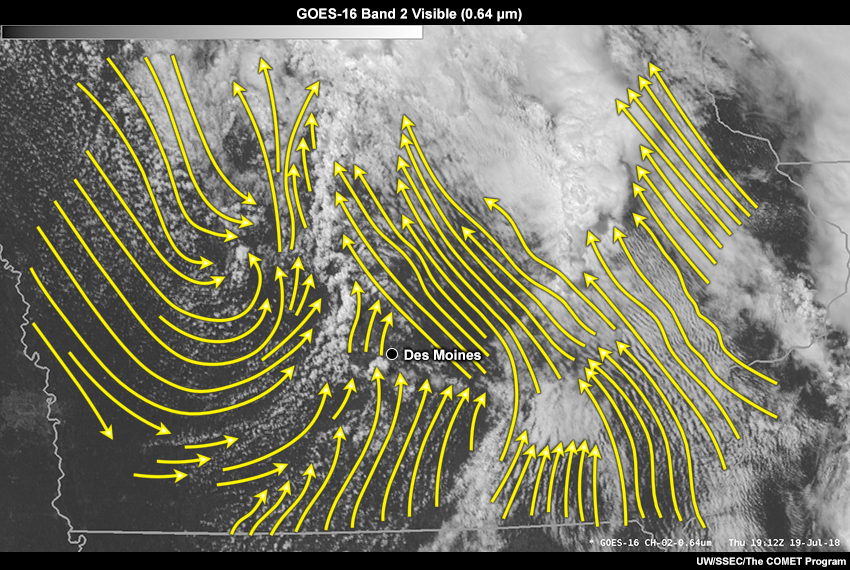
Question
On the visible satellite image below:
- Use the blue pen to outline areas of stable wave clouds.
- Use the red pen to outline areas of unstable cumulus cloud streets.
- Use the yellow pen to outline the area of low-level convergence that concerns you for afternoon convection.
- Challenge task: Given the potential for bores to emanate from the existing convection, use the green pen to outline where you would expect to see the leading edge of any undular bores.
You can view the additional satellite and radar loops above to help in your analysis.
When you have finished, click Done to view the expert analysis.
Compare your analysis to the expert analysis below.
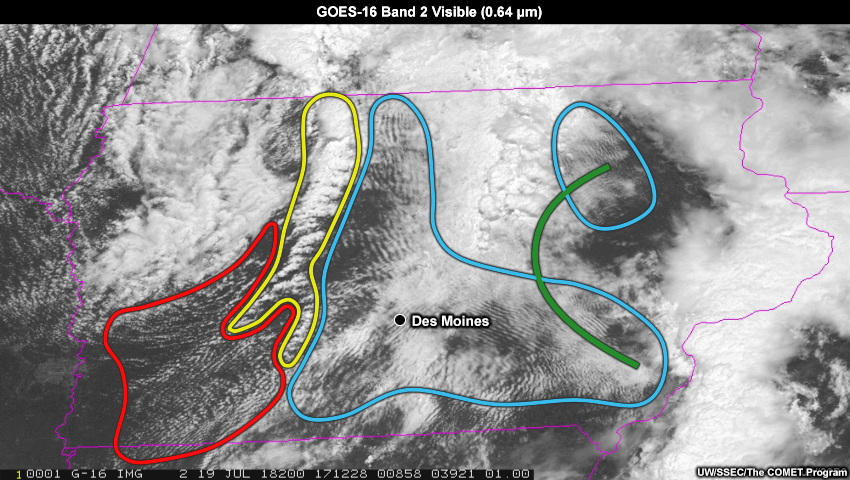
A convergence boundary generally oriented north to south across western Iowa is migrating eastward, with active convection on its northern side. Most of the cloud formations ahead of the convergence boundary over central and eastern Iowa are stable billow clouds, indicating the presence of a stable layer inhibiting surface-based convection. Within that stable layer, there is a trapped gravity wave. The appearance of stable billow clouds is more stratiform (lacking texture) as opposed to cumuliform (textured). There is a transition to unstable cumulus cloud streets and agitated cumulus closer to and along the convergence zone.
Boundaries where stable air masses are adjacent to regions of low-level, wind-parallel cumulus cloud streets are common regions of cumulus congestus and eventual convective development.
From the visible satellite imagery, we can determine that low-level convergence, moisture, and instability are present mainly where the north-south axis of deep convection is. Also, the visible satellite imagery indicates the presence of vertical wind shear as clouds at multiple layers are moving at different speeds and in different directions. There would be a component of flow around the stable layer normal to the billow orientation (trapped gravity wave within the layer). Considering that the surface winds are parallel to the billow orientation, this indicates low-level shear.
The expert analysis includes an added green outline representing the leading edge of a series of undular bores emanating from the dissipating convection over far eastern Iowa. These bores behave like a density current, which is another indication that this region is stable and not associated with convective cloud streets.
Please continue to the following questions.
Question
Review the visible satellite loop and answer the following questions. Use the pull-down menu to choose the best answer.
The correct answers are highlighted above.
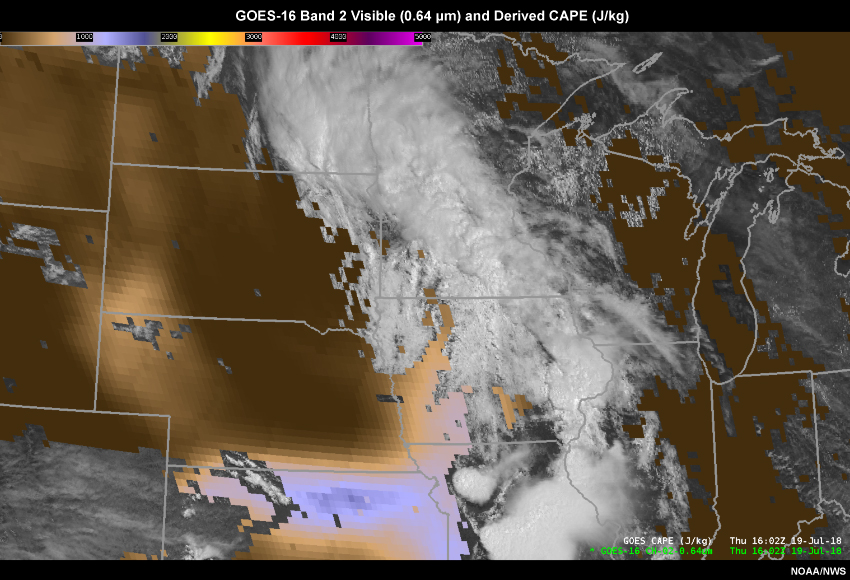
Skies are beginning to clear across central and western Iowa, which will help the atmosphere to recover during the afternoon from the morning convection and destabilize. In addition to the increasing convective instability, you would expect CAPE values to increase across the area. The product below shows visible satellite imagery and derived CAPE values. Increasing CAPE values (greater than 1000 J/kg) are evident across south-central Iowa, suggesting that the energy available for convection is increasing.
You continue to closely monitor the observations for convective development within the vicinity of the convergence boundary. It is a busy summer day with a couple county fairs going on within your county warning area. The forecaster coming in ahead of the next scheduled shift change has arrived, and you are glad for this extra staff to help with keeping on top of the weather situation. In addition to the forecasting duties within your office, your team is actively communicating with county emergency managers and other partners to inform them of the increasing potential for severe weather this afternoon.
Convergence Boundary and Convective Potential
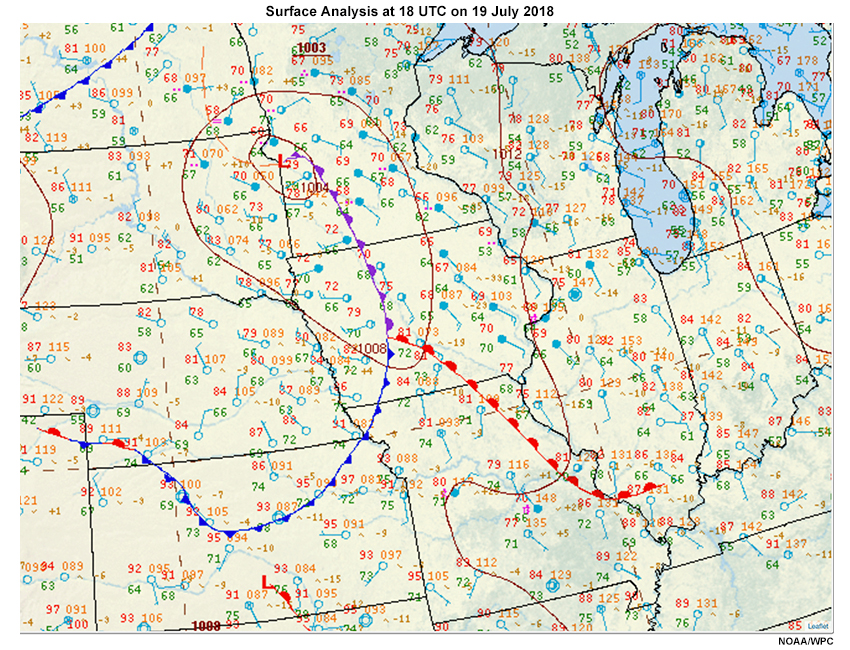
The surface analysis at 1800 UTC shows that the stationary boundary has progressed eastward as a warm front, and the occluded front has moved east and expanded further south into central Iowa.
At 1915 UTC (0215 pm local time), you examine the radar and visible satellite imagery to see how the convergence boundary signatures have evolved over the past couple of hours.
Radar Composite
Visible Satellite
Question
Review the radar and visible satellite loops above. Which of the following statements best describes what you are observing in these data? Choose the best answer.
The correct answer is d.
You correctly interpreted the characteristics of the convergence boundary and how the cloud field is changing. The visible satellite image below highlights the developing cumulus congestus along the convergence boundary and an example of a short-lived storm cell with orphan anvils.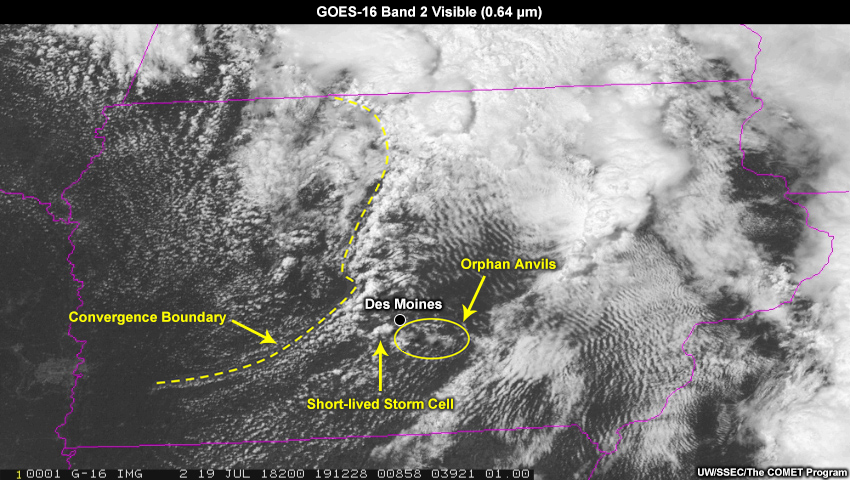
At the forecast desk, you decide to take a look at another product that might provide additional information to help you evaluate the potential for convection.
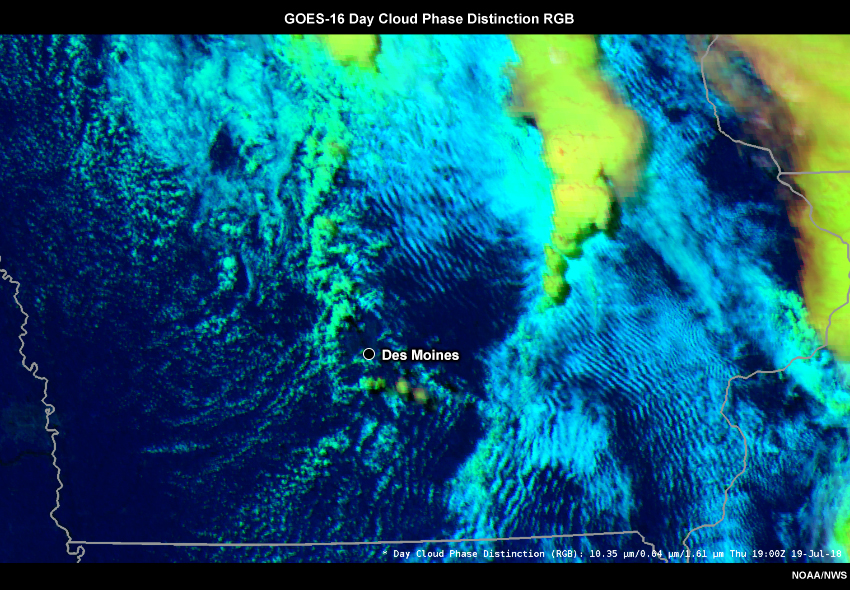
Convergence Boundary and Convective Potential » Day Cloud Phase Distinction
The Day Cloud Phase Distinction (DCPD) RGB can be used to evaluate changes in cloud top phase as indicators of convective storm development and growth.
Day Cloud Phase Distinction RGB
RGB Recipe
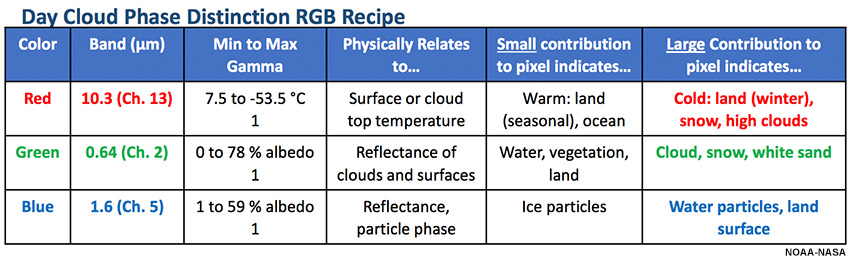
The recipe for the Day Cloud Phase Distinction RGB. For more information, see the Quick Guide.
Question
Review the DCPD product loop above and look for cumulus transitioning from shades of light blue to shades of green and yellow. What do you think this transition in color indicates about the characteristics of the cumulus field? Use the pull-down menu to choose the best answer.
The correct answers are highlighted above.
As shown in the DCPD loop below, cumulus clouds along and near the convergence boundary are transitioning from shades of light blue to shades of green and yellow due to increasing cloud ice and cooling IR brightness temperatures. The color transition implies increased vertical development and updraft speeds, which are a result of a weakening cap and/or increasing forcing for ascent. Similar to the visible satellite imagery, there are orphan anvils associated with the southernmost storm cell, indicating failed initiation but that the capping layer is likely close to breaking in this area before 'probable' deep convection initiates.
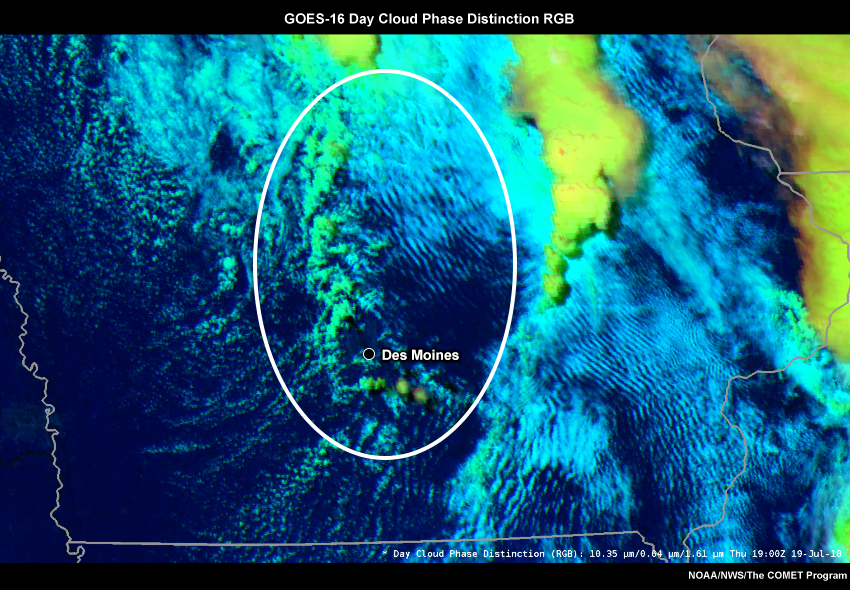
Glaciating cumulus clouds are observed in the 1-minute DCPD product imagery prior to when significant reflectivity (sustained, >= 35 dBz) can be seen in the lower time-resolution full-volume radar scans, providing you with advanced notice of strengthening cumulus congestus.
Question
What are the advantages of the DCPD RGB in diagnosing the likelihood of convective initiation? Choose all that apply.
The correct answers are highlighted above.
The 1-minute DCPD product imagery is very valuable for monitoring the real-time evolution of the pre-convective environment. The spatial resolution provided by the 0.5 km visible band allows for the identification of important cloud texture details. Unfortunately, the DCPD RGB relies on visible bands and provides information in the daytime only, so option a) is incorrect. Note that for this case, the Des Moines WFO did have 0.5-degree radar scans available every 1-2 minutes, but some of the early development was so close to the radar that echoes were not apparent in those scans (not shown). The 1-minute mesosector imagery can be extremely valuable when storms are developing close to the radar, even if the radar is providing frequent updates.
You decide to look at the current water vapor imagery to determine if there is any upper-level forcing that could allow the convection to finally break the cap and progressively develop in the Des Moines metro area.
Convergence Boundary and Convective Potential » Water Vapor Analysis
Upper-Troposphere Water Vapor
Low-level Troposphere Water Vapor
Question
Review the water vapor satellite loops above. Which of the following statements best describes your assessment of upper-level forcing influences on convective initiation in the vicinity of the Des Moines metro area? Choose the best answer.
The correct answer is c.
You correctly interpreted the upper-level forcings in the water vapor satellite imagery. There is initial convective development across central Iowa, but the cap is suppressing convective growth. However, positive vorticity advection from a lobe of vorticity may provide the upper-level forcing needed to initiate and support deep convection in the area.The cumulus field has become more organized with glaciating cumulus, a deteriorating capping layer, and incoming upper-level forcing to support deeper convection. Next, you decide to take a look at the surface wind field to get an idea of which cumulus are most likely to evolve into a healthy storm cell (considering all other thunderstorm ingredients in place).
Convergence Boundary and Convective Potential » Visible Imagery and Streamline Analysis
Question
You are looking at visible satellite imagery to assess where low-level convergence is the strongest. On the visible satellite image below, use the yellow pen to draw streamlines. Draw as many streamlines as you need to help you identify areas of convergence.
You can view the visible satellite loop above to help in your streamline analysis.
When you have finished, click Done to view the expert analysis.
Compare your analysis to the expert analysis below.
Notice how the shape of the convergence boundary has changed from 1712 UTC to 1912 UTC (review the visible satellite loop). The convergence boundary now exhibits a bent center in its shape, indicative of strong convergence and instability. This feature is also a reflection of the positive vorticity advection from the mid-tropospheric lobe of vorticity aloft.
While a visible satellite image overlaid with surface observations could give you a glimpse of the surface flow pattern, a forecaster can gain more information by assessing cloud formations and the movement of clouds in visible satellite imagery.
Note that across central and eastern Iowa, stable cloud streets remain, which are perpendicular to the low-level flow and parallel to the surface wind. Over south-central Iowa, unstable cloud streets are present, indicating instability across that area.
Please continue to the following questions.
Question
Based on all of your satellite analyses, answer the following questions. Use the pull-down menu to choose the best answer.
The correct answers are highlighted above.
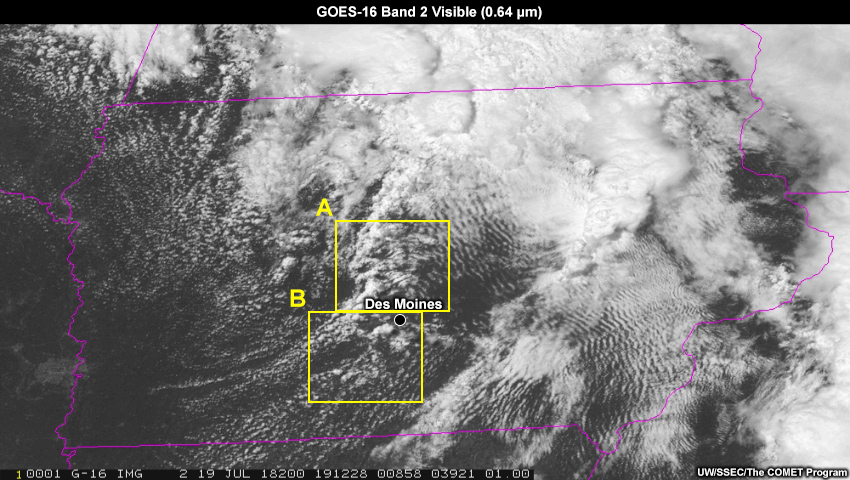
The visible satellite and DCPD product imagery both reveal progressively enhanced cumulus development and clumping northwest of Des Moines between 1800 UTC and 1900 UTC. Orphan anvils are also evident with the southernmost storm cell, indicating that the cap is about to break.
The DCPD product is able to provide more information about the developing cumulus field by indicating glaciation and strengthening updrafts. Furthermore, vorticity advection and strong surface convergence near the bent area of the boundary as evident in the streamline analysis are all clues that convective initiation and deeper growth are most likely in Area A.
Convective Development and Severity Potential
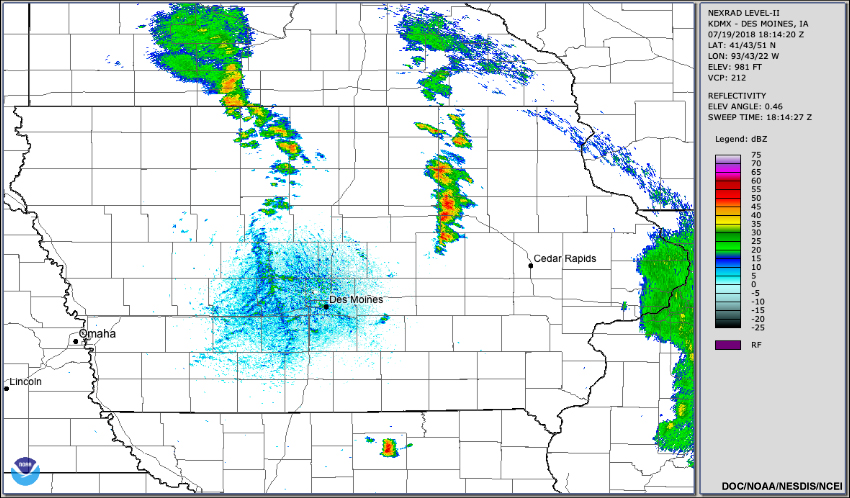
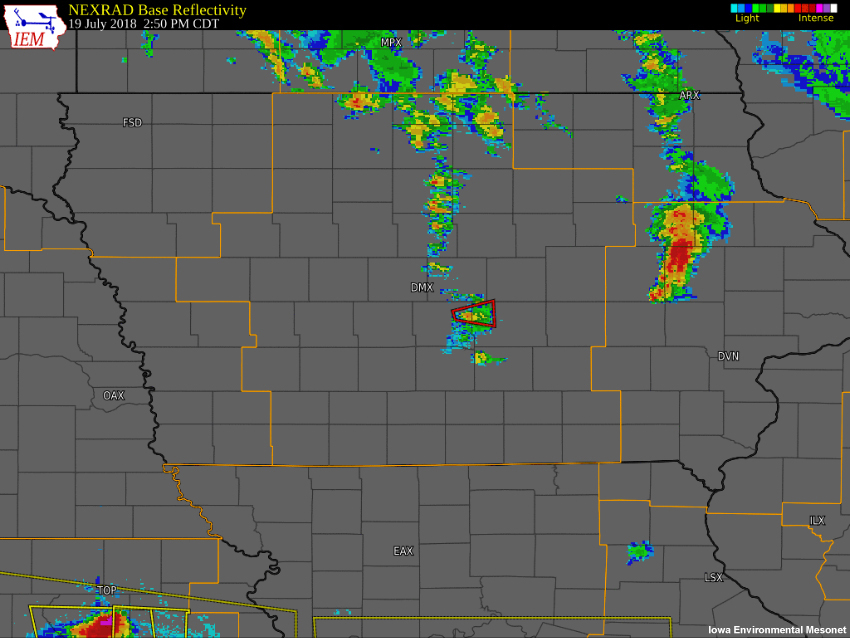
The radar composite loop below shows the initiation of convection within the Des Moines metro area.
In this timeframe from 1915 to 1947 UTC (0215 to 0247 pm), you now focus on anticipating which convective cells might become severe. Being able to identify these areas of potential severe convection can help you determine the locations at risk, so that you are able to get timely warnings out.
Question
What improvements from the current generation of GOES-R and JPSS satellites can help with convective weather analysis? Choose all that apply.
The correct answers are highlighted above.
Polar-orbiting satellites, including NOAA-20, provide high spatial resolution visible and infrared satellite imagery as well as vertical soundings of temperature and moisture twice per day over the contiguous U.S. The GOES-R satellites (GOES-16 and GOES-17) provide visible imagery at 0.5 km resolution and infrared imagery at 2.0 km resolution. With these new-generation satellites, combined IR-microwave retrievals allow derivation of atmospheric soundings and other products characterizing the vertical structure of the atmosphere. The larger number of spectral bands has increased the array of products providing useful information to forecasters. In hazardous weather situations, GOES-R mesoscale domain sector (MDS) data provide one-minute imagery useful for assessing rapidly developing and changing conditions. These one-minute data have been proven to be essential for monitoring evolving weather situations. More information about GOES-R and JPSS (S-NPP and NOAA-20) products and capabilities are available in several resources, listed in the References section at the end of this lesson.
Next, you want to take a look at the shear environment in the area where this convection is taking place to see if conditions are favorable for rotating updrafts. If the shear environment is conducive for rotation, these convective cells could become tornadic supercells.
Convective Development and Severity Potential » Derived Motion Winds
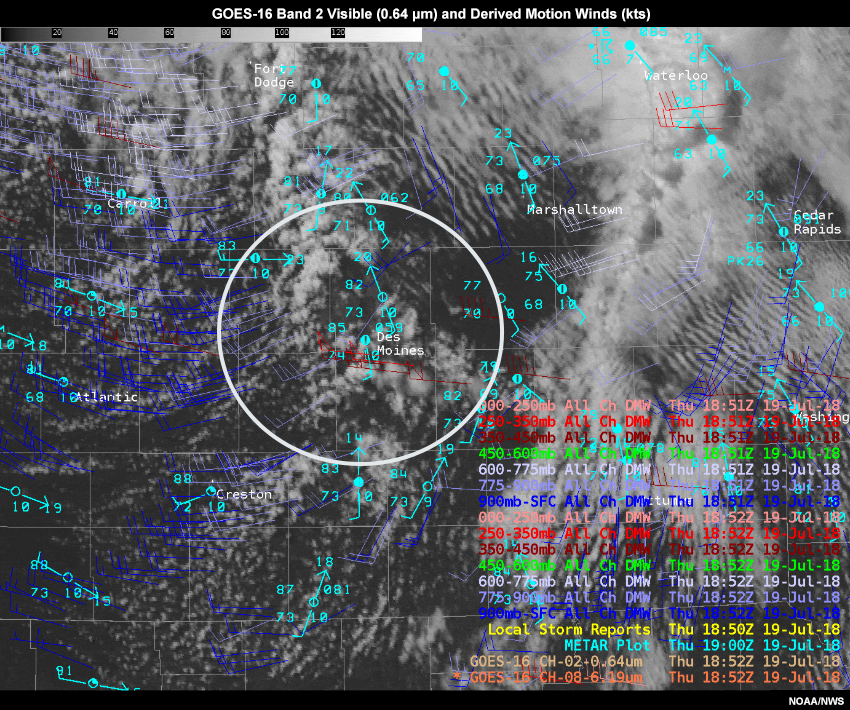
The Derived Motion Winds (DMW) product can provide important information about winds at different levels in the atmosphere.
Question
Review the DMW product loop above, and fill in the statements below relative to the city of Des Moines. Use the pull-down menu to choose the best answer.
The correct answers are highlighted above.
A snapshot of the DMW product at 1852 UTC is below. The outlined area shows enhanced low-level and deep layer shear prior to convective initiation. With surface winds of 15 knots from ~175° and the DMWs around 6 km at ~55 knots from ~273°, this yields a 0-6 km shear vector of ~59 knots, which is favorable for supercells. The DMWs indicated ~1 km winds of ~20 knots from ~225°, resulting in a 0-1 km shear of ~17 knots, which is favorable for supercell tornadoes.
Convective Development and Severity Potential » NUCAPS Soundings and Gridded NUCAPS
NUCAPS Soundings
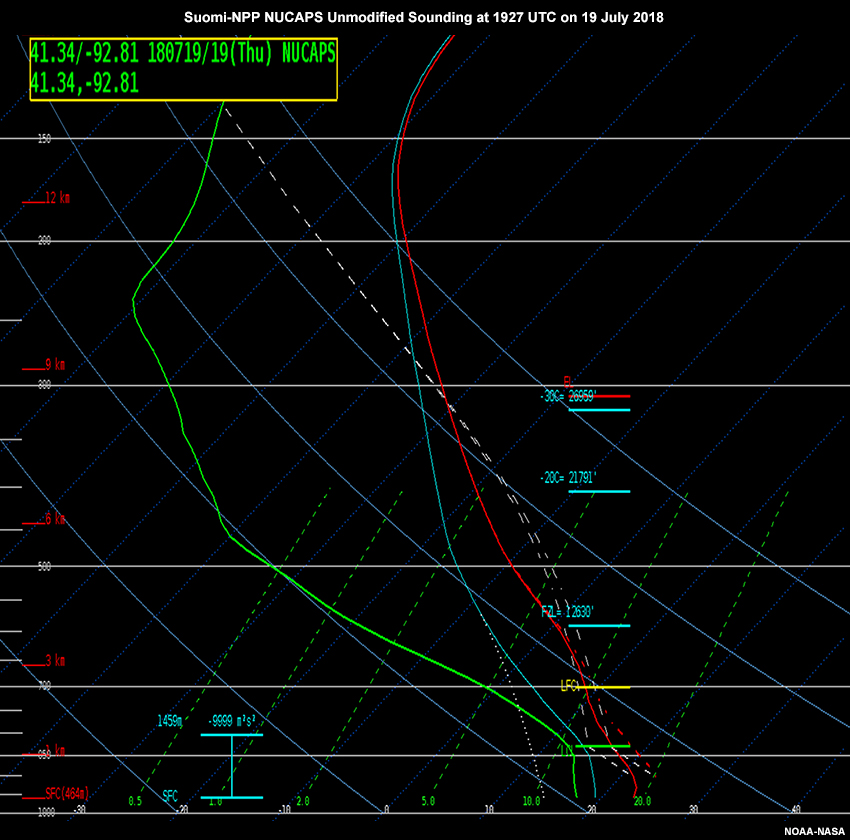
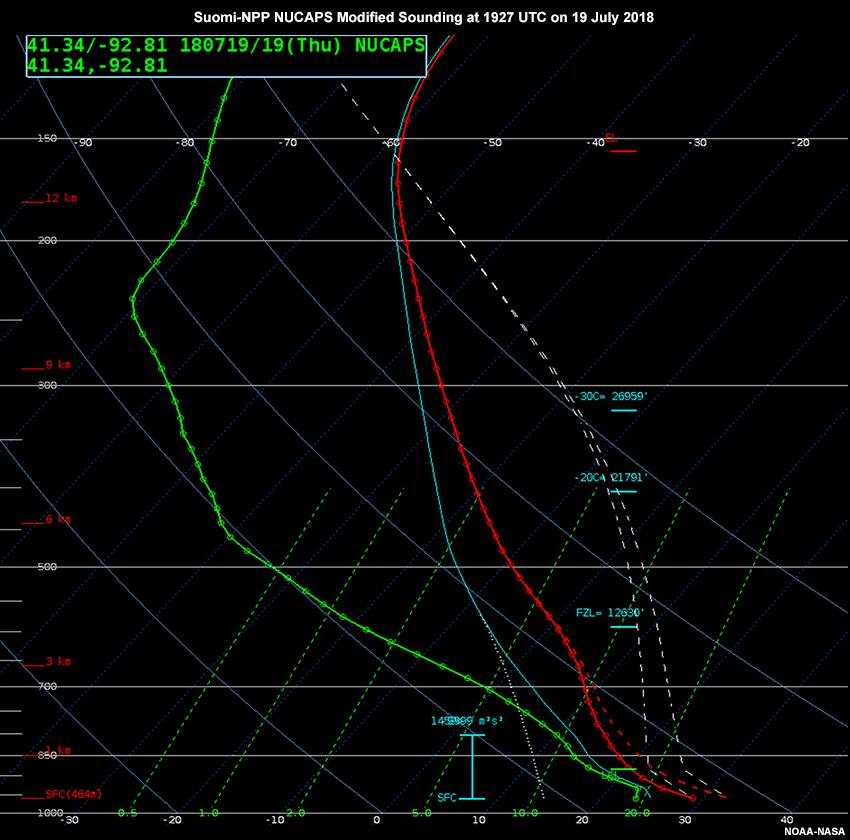
Unmodified and modified NUCAPS soundings for central Iowa at 1927 UTC.
NUCAPS Sounding Details
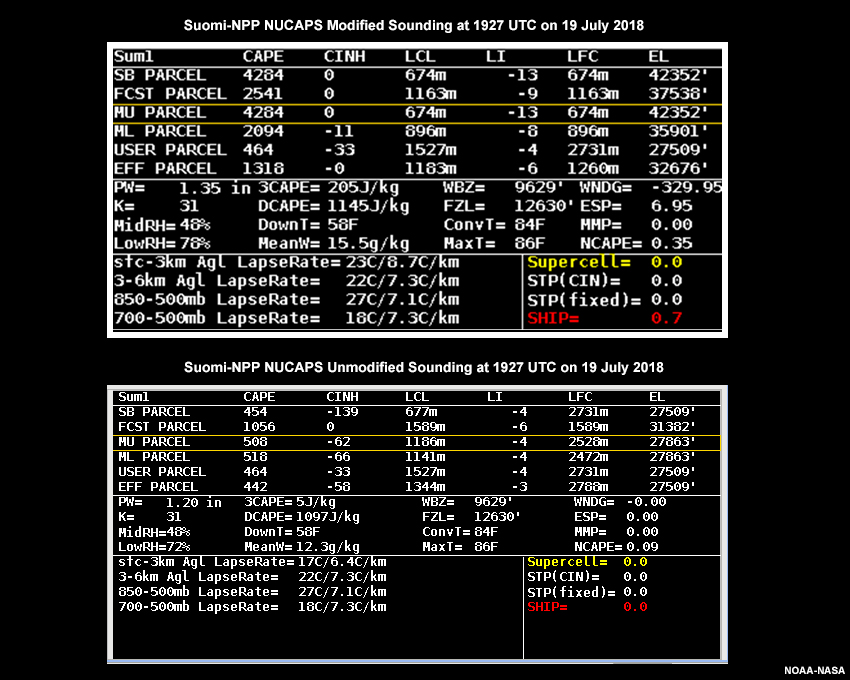
Suomi-NPP NUCAPS modified and unmodified sounding parameters southeast of Des Moines, Iowa at 1927 UTC on 19 July 2018.
An overpass of the S-NPP satellite provided NUCAPS soundings ahead of the time of convective initiation. Because central Iowa does not have a balloon launch, it represents a location where temperature and moisture profiles from polar-orbiting satellites have exceptional value, more accurately representing local conditions. Even in locations with traditional radiosonde observations, the availability of the NUCAPS soundings in the early/mid-afternoon hours for the U.S. provides important information. Beginning 2 July 2019, NUCAPS soundings are accessible in the NWS Advanced Weather Interactive Processing System (AWIPS) and via direct broadcast. There is a delay of about 60 minutes from the 0130 am/pm local overpass time. The surface conditions of the profiles sometimes need to be modified to match nearby observations due to limitations in NUCAPS’ ability to observe boundary layer conditions. For more information, see this training lesson on how users can modify a NUCAPS sounding in AWIPS. After modifying the lower-level value to the surface conditions, the profiles near Des Moines indicated around 2,000 J/kg of MLCAPE and up to 4,000 J/kg of SBCAPE, supportive of strong updrafts.
Question
What can be observed from the modified NUCAPS sounding? Choose all that apply.
The correct answers are highlighted above.
The modified NUCAPS sounding shows a steep low-level lapse rate, no CINH, high instability, and low LCL height. The mid- and upper-levels of the profile were dry above moist low-levels, indicating favorable convective instability. Also, there is a large amount of CAPE in the hail growth region (-10 °C to -30 °C), significantly increasing the potential for hail. These conditions support an environment conducive for severe weather.
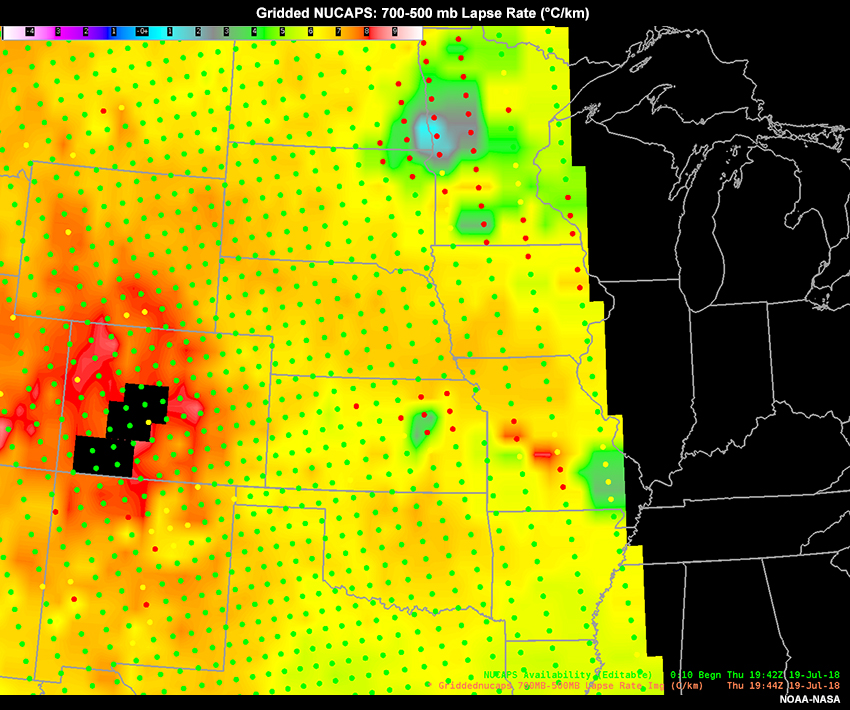
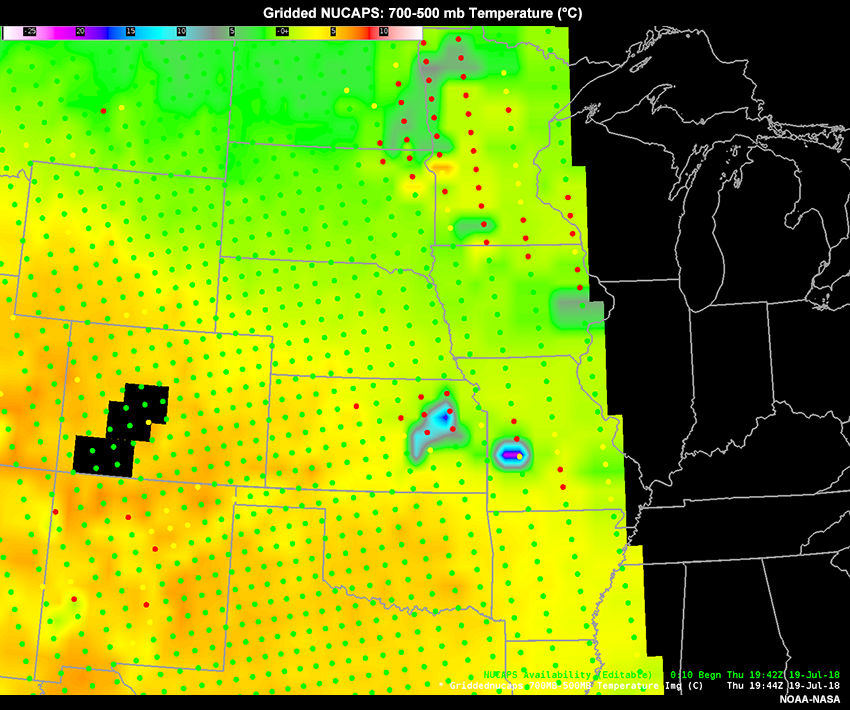
700-500 mb Lapse Rate
700-500 mb Temperature
700-500 mb Relative Humidity
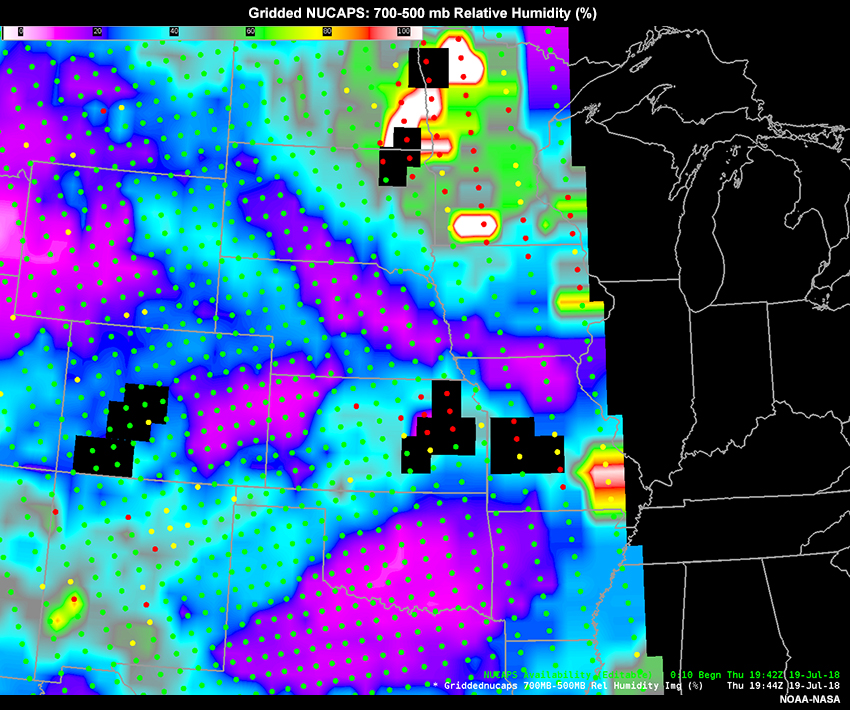
Gridded NUCAPS offers a visual way to assess environmental conditions such as temperature and relative humidity as well as derived fields such as integrated total precipitable water and mid-level lapse rates, with the data available at standard pressure levels. The products provide plan views and cross-section views, and are available about 60-70 minutes after overpass. The gridded products provide a way to diagnose environmental parameters over a broad region without interrogating the individual vertical soundings. In this example, the average 700-500 mb lapse rate across south-central Iowa is around 7.5 °C/km, indicative of conditional instability. Also, the gridded products show that a drier mid-level is present, which contributes to instability. Note the location of the southern edge of the 700-500 mb colder mean temperatures over southwest Iowa. This edge intersects the northern half of the stronger lapse rates extending across Nebraska into southwest Iowa and northern Missouri, indicating greater instability than would be present if mid-level temperatures were warm, as is seen over the Southern Plains.
It is clear that conditions are favorable for severe thunderstorms in the forecast area: sufficient low-level and deep layer vertical wind shear, convective instability, a broken cap, large CAPE, and low LCL heights. Everyone in your forecast office is on high alert. Let’s continue monitoring the situation for the Des Moines metro area.
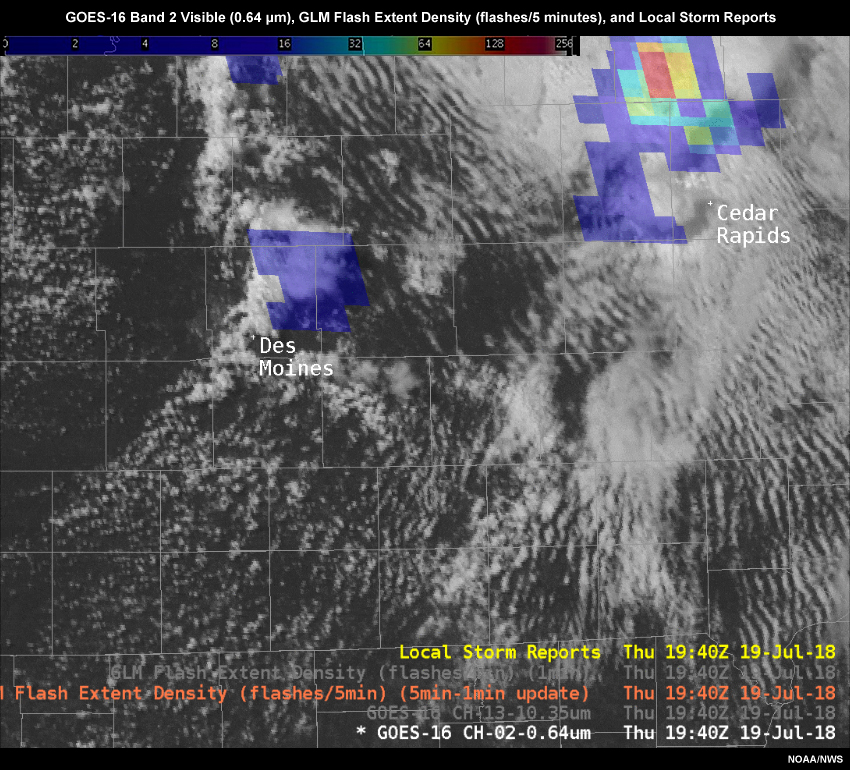
Convective Development and Severity Potential » 1-min Visible, IR, and GLM Imagery
GLM Flash Extent Density
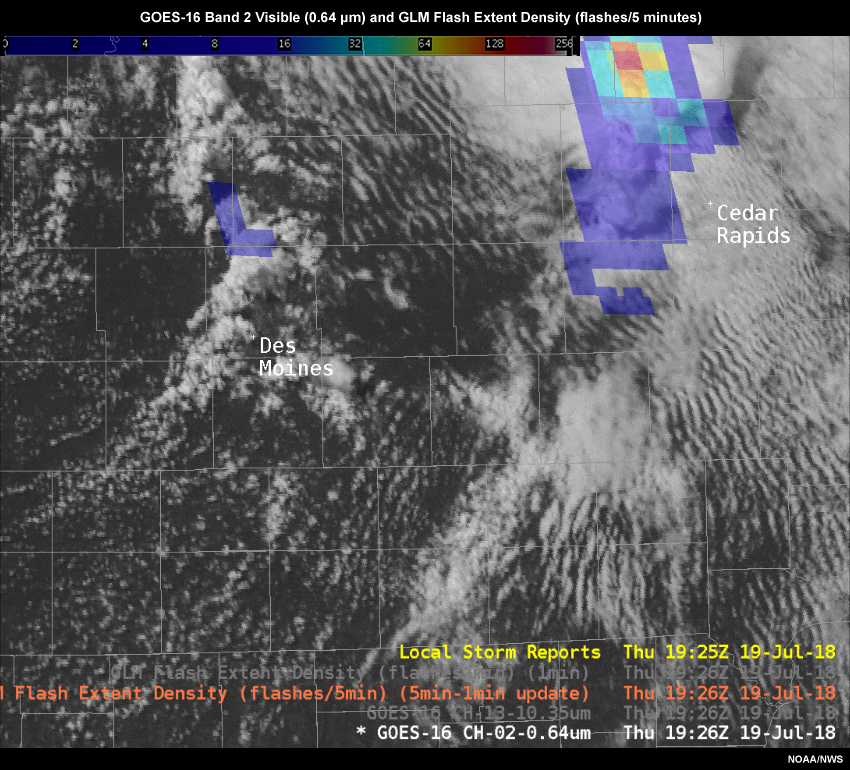
Visible Satellite
Infrared Satellite
Question
The first GLM lightning detection was at 1926 UTC, around the time the storm cell north of Des Moines first developed. Review the satellite imagery loops above. Relative to the storm cell, complete each statement below. Use the pull-down menu to choose the best answer.
The correct answers are highlighted above.
The number of FED detections is increasing as indicated by the change of color from dark to light purple. This upward trend in detections provides an early indication of developing thunderstorms. You can determine cooling cloud tops using the temperature scale on the infrared satellite imagery. Also, clear shadows and highly textured convective clouds extending vertically can be seen in the visible satellite imagery.
Question
Based on the trends in the satellite products, what can you conclude about the intensity of the storm cell near Des Moines? Choose the best answer.
The correct answer is a.
Increased lightning activity, cooling cloud tops, and increased vertical development are all indicators that the storm cell near Des Moines is strengthening. Recall that the environment in which this convection is occurring has sufficient low-level shear for tornadic supercells. Everyone in the office is keeping a very close eye on this storm cell.
Event Impacts
Through the next couple of hours, the office issued numerous tornado warnings and received a large volume of storm reports for funnel clouds, tornadoes, and hail. The volume of storm reports was particularly notable as the storms developed along northeastern portions of the Des Moines metro area and affected multiple communities to the north and east of Des Moines.
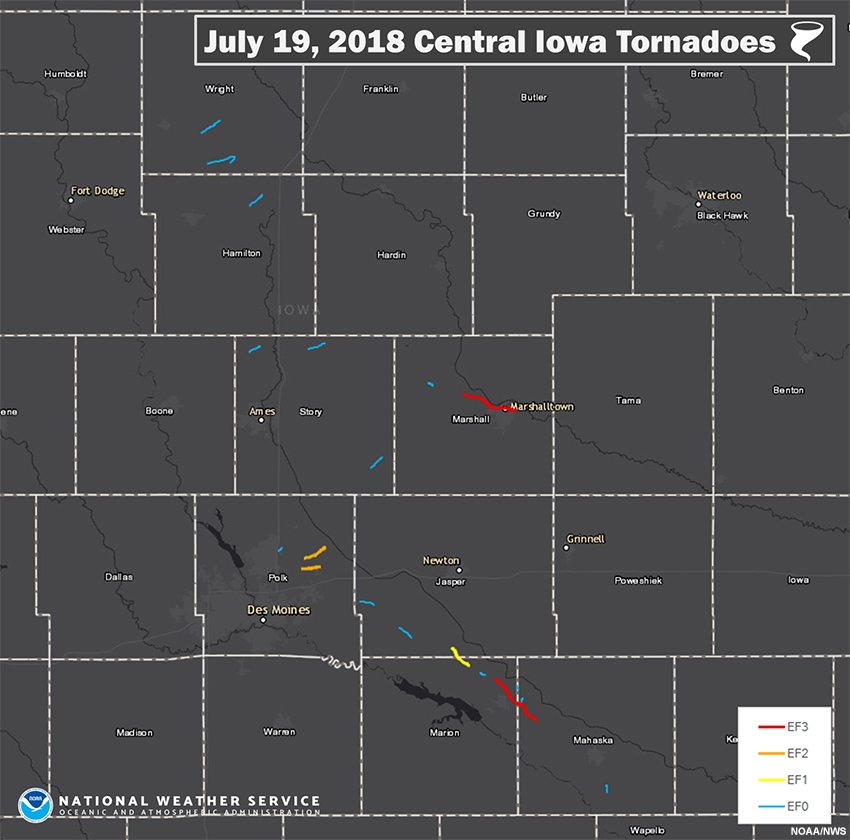
Map of tornado damage paths from the 19 July 2018 event. The damage from the tornadoes was assessed as EF0 to EF3.
At 2138 UTC, a Tornado Emergency was issued for Marshalltown as a large wedge tornado moved eastward into the town of approximately 30,000. This tornado, ultimately rated EF3, severely damaged buildings in the business district and in residential neighborhoods. This tornado caused 22 injuries but no fatalities.
The most significant severe weather lasted just a few hours, but it was an extremely active and busy few hours.
In total, the storms resulted in 19 tornadoes affecting seven counties. The Tornado Watch (covering a total of 17 counties) was cancelled at 2307 UTC. For a full summary of the event, see the Des Moines WFO Event Summary.
Summary
Multiple products available through GOES-R series satellites (currently operational as GOES-16 and GOES-17) and JPSS (S-NPP and NOAA-20) provide information for forecasting and diagnosing convective initiation.
|
Product |
Advantages |
|
GOES-R 1-minute meso-sector imagery |
|
|
Day Cloud Phase Distinction (DCPD) RGB |
|
|
Advected Layer Precipitable Water (ALPW) |
|
|
NUCAPS Soundings |
|
|
Gridded NUCAPS |
|
This case exercise was designed to offer you practice working with satellite products for anticipating and monitoring convective initiation. You are now ready to complete the quiz. As you incorporate these satellite products and their capabilities into your overall forecast process, please refer to the provided resources in the References section as needed for further information.
References
CIMSS GOES-R Series ABI Quick Guides
- 0.64 μm Visible Band 2 Satellite Imagery
- 10.3 μm Infrared Band 13 Satellite Imagery
- 6.2 μm Upper-level Water Vapor Band 8 Satellite Imagery
- 6.9 μm Mid-level Water Vapor Band 9 Satellite Imagery
- 7.3 μm Lower-level Water Vapor Band 10 Satellite Imagery
- Advected Layer Precipitable Water
- Day Cloud Phase Distinction RGB
- AWIPS modification for Day Cloud Phase Distinction RGB
NUCAPS Resources
- NUCAPS Soundings
- Gridded NUCAPS
- NUCAPS Soundings training presentation from CIMSS
- Community Satellite Processing Package NUCAPS software release
- NUCAPS Soundings information in the CIMSS Satellite Blog
Other Satellite Resources
Contributors
COMET Sponsors
MetEd and the COMET® Program are a part of the University Corporation for Atmospheric Research's (UCAR's) Community Programs (UCP) and are sponsored by
- NOAA's National Weather Service
(NWS)
with additional funding by: - Bureau of Meteorology of Australia (BoM)
- Bureau of Reclamation, United States Department of the Interior
- European Organisation for the Exploitation of Meteorological Satellites (EUMETSAT)
- Meteorological Service of Canada (MSC)
- NOAA National Environmental Satellite, Data and Information Service (NESDIS)
- NOAA's National Geodetic Survey (NGS)
- National Science Foundation (NSF)
- Naval Meteorology and Oceanography Command (NMOC)
- U.S. Army Corps of Engineers (USACE)
To learn more about us, please visit the COMET website.
Project Contributors
Project Leads
- Vanessa Vincente - UCAR/COMET
- Amy Stevermer - UCAR/COMET
Project Scientist
- Vanessa Vincente - UCAR/COMET
Instructional Design
- Amy Stevermer - UCAR/COMET
Science Advisors
- Emily Berndt - NASA SPoRT, Huntsville, AL
- Michael Bowlan - OU/CIMMS and NOAA/SPC, Norman, OK
- William Line - NOAA/NESDIS, Fort Collins, CO
- Jorel Torres - CIRA, Fort Collins, CO
- Thomas (TJ) Turnage - NWS, Grand Rapids, MI
- David Zaff - NWS, Buffalo, NY
Additional Science Consultants
- Allan Curtis - NWS, Des Moines, IA
- Rod Donavon - NWS, Des Moines, IA
- Bryan Guarente - UCAR/COMET
- Adam Hirsch - UCAR/COMET
- Jeff Johnson - NWS, Des Moines, IA
- Alex Krull - NWS, Des Moines, IA
- Scott Lindstrom - CIMSS/U Wisconsin, Madison, WI
Program Oversight
- Amy Stevermer - UCAR/COMET
Graphics/Animations
- Daniel Bikos - CIRA, Fort Collins, CO
- Steve Deyo - UCAR/COMET
- William Line - NOAA/NESDIS, Fort Collins, CO
- Jorel Torres - CIRA, Fort Collins, CO
Multimedia Authoring/Interface Design
- Gary Pacheco - UCAR/COMET
COMET Staff, May 2020
Director's Office
- Dr. Elizabeth Mulvihill Page, Director
- Tim Alberta, Assistant Director Operations and IT
- Dr. Paul Kucera, Assistant Director International Programs
- Dr. Wendy Gram, Implementation Manager
Business Administration
- Lorrie Alberta, Administrator
- Auliya McCauley-Hartner, Administrative Assistant
- Tara Torres, Program Coordinator
IT Services
- Bob Bubon, Systems Administrator
- Joshua Hepp, Student Assistant
- Joey Rener, Software Engineer
- Malte Winkler, Software Engineer
Instructional Services
- Dr. Alan Bol, Instructional Designer/Scientist
- Tony Mancus, Instructional Designer
- Sarah Ross-Lazarov, Instructional Designer
- Tsvetomir Ross-Lazarov, Instructional Designer
International Programs
- David Russi, Translations Coordinator
- Martin Steinson, Project Manager
Production and Media Services
- Steve Deyo, Graphic and 3D Designer
- Dolores Kiessling, Software Engineer
- Gary Pacheco, Web Designer and Developer
- Tyler Winstead, Web Developer
Science Group
- Patrick Dills, Meteorologist
- Bryan Guarente, Instructional Designer/Meteorologist
- Adam Hirsch, Meteorologist
- Matthew Kelsch, Hydrometeorologist
- Andrea Smith, Meteorologist
- Amy Stevermer, Scientist/Instructional Designer
- Vanessa Vincente, Meteorologist