Produced by The COMET® Program
Introduction
This module covers:
- The role of radiant energy (short and longwave radiation) and the influence of clouds, moisture, and trace gases on radiative transfer in the atmosphere.
- The role of surface characteristics in determining the amount and partitioning of solar radiation reaching the surface (land versus water, snow, and ice; and vegetation and soil moisture effects on surface water and energy balances).
- The role of turbulent transfer in the planetary boundary layer (from surface to free atmosphere) and in the free atmosphere (vertical and horizontal diffusion) in response to radiative forcing.
Working through the material will help you to:
- Develop a basic understanding of how radiation and associated processes are emulated in NWP models.
- Understand when model physics are most important to the model forecast (versus model dynamics).
- Understand that model physics are specifically tuned to work best in certain situations and specific models.
- Understand that model physics parameterizations affect other parameterizations, model dynamics, and data assimilation, which may result in feedbacks.
- Identify impacts of model physics and their errors on model forecasts both at and around the forecast location.
- Identify effects that are smaller than the model can emulate (for example, the resolution of surface characteristics is coarse but real effects occur at fine resolution).
The module is structured as follows:
- Processes presents an overview of radiative, land surface, sea surface, and turbulent processes.
- Physics Parameters presents an interactive environment for exploring the effect of physics parameters on the surface forecast. Since the importance of model physics to specific forecast problems varies greatly throughout the day from one season (or air mass) to the next, this section focuses both on how models emulate the diurnal cycle and on how model physics impact sensible weather forecasts. It uses data from a single column model forced with real advection data from observations.
- Operational Tips presents tips related to model physics that will help you make better use of model forecasts.
- Exercises presents a series of questions that should help you integrate the information presented in the module and apply it operationally.
- References gives supporting references for the module.
Physical Processes
Defining & Categorizing Model Physics
The phrase "model physics" generally refers to all processes other than dynamics, convection, and cloud and precipitation microphysics treated in numerical models. Ultimately, these processes primarily relate to model treatment of incoming solar (shortwave) and outgoing terrestrial (longwave) radiation, both in the atmosphere and at the surface.
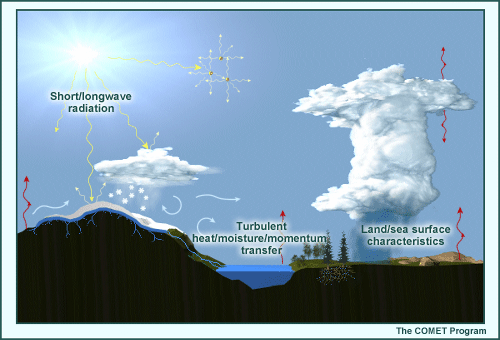
The effects that model physics parameterizations attempt to simulate are generally unresolvable at grid scales and can be categorized as follows:
- Shortwave (solar) and longwave (terrestrial) radiation in the atmosphere; this includes the effects of clouds, water vapor, trace gases, and aerosols.
- Land and sea surface characteristics and their impact on how incoming radiation affects surface energy and water balances; this includes the effects of vegetation type, soil type, soil moisture quantities, snow, water bodies, and land and sea ice.
- Mechanical transfer of heat, moisture, and momentum between the ground and the planetary boundary layer (PBL) and between the PBL and the free atmosphere by turbulence; this is affected by the treatment of radiation in the atmosphere and at the ground.
Importance of Physics to the Model Forecast
The influence of model physics on the forecast of sensible weather varies significantly depending upon the meteorological situation. In general, its influence is:
- Important when dynamic forcing is weak or when physical processes are strong, such as near the center of a high-presssure system or during a clear, calm night.
- Reduced when dynamic forcing is strong, such as during a frontal passage or near a developing low-pressure system.
To illustrate the importance of model physics on sensible weather forecasts, let's look at the temperature prediction equation at a fixed point.

The terms on the right side represent temperature changes resulting from model physics within a parcel of air moving over the fixed point, and the advection of temperature from upwind of the fixed point, respectively. Either term can dominate depending on the characteristics of the flow pattern.
From the equation, we can see that the effect of model physics on temperature is most important when:
- advection is weak (wind velocity and/or temperature gradient are small), and/or
- physical processes are strong (when individual air parcels experience large temperature changes through sensible heating or cooling, condensation or evaporation, or radiative cooling, etc.).
Near the earth's surface, for example, advection usually dominates the temperature change at a point:
- when there is a change in air masses or frontal passage, or
- in winter, when temperature gradients and winds both tend to be strong.
On the other hand, physics effects typically dominate when:
- the diurnal cycle of solar radiation is strong (summer),
- parcels are very near to the ground, and thus can be sensibly heated or cooled, or
- precipitation processes are significant (latent heating and evaporative cooling).
* Temperature Tendency Equation Question
Question

The following questions compare the relative values of the terms in the temperature tendency equation in summer with those in winter after a typical cold frontal passage. (Use the selection boxes to choose the best answer to complete the sentence.)
The correct answers are 1°C/hour for the first statement and 0.1°C/hour for the second.
When we compare physics and advection terms at the time of maximum heating, the physics term is 30 times larger (0.1°C versus 3°C/hour) than the advection term in summer, while the values of the physics and advection terms approximately offset each other in winter (each being about 1°C/hour). As a result of the offset in winter, there is little to no temperature change in winter on a sunny post-frontal day (as is commonly observed), as the dynamics are canceling out the effects of physics. In summer, solar heating dominates over advection so while the maximum and minimum temperatures may change from day to day as a result of advection (dynamics), the effects of the diurnal cycle (physics) on temperature still dominate. Similar arguments may be made for other forecast variables, such as atmospheric moisture content.
Errors in Sensible Weather Forecasts Introduced by Model Physics
From years of study, we can understand and predict the dynamics of the real atmosphere pretty well, especially at the synoptic scale. Can the same be said of real atmosphere physics? The short answer is both yes and no. There are several reasons…
While many of the processes involved in atmospheric physics are well understood on the very small time and space scales at which they occur, it is difficult to accurately translate this understanding to emulate these small-scale processes at the large scales of present NWP models. This is due to the fact that:
- The values of some important parameters that affect model physics are not well known at the scales represented by the models. For example, although we may understand the diurnal process at individual sites very well, we don't know how to generalize this knowledge to emulate the diurnal cycle well in all places and circumstances.
- Many physical processes are not well understood at the scales of the models. To further understand the challenge of emulating physics in NWP models, let's consider three examples. Click each of the following processes/characteristics to see how models emulate them.
* Model Emulation of Radiation
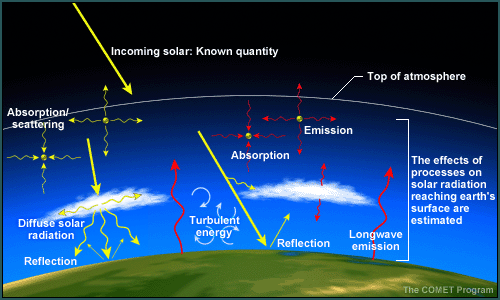
We know the amount of incoming solar energy at the top of the atmosphere at diurnal, synoptic, and short-range climate timescales. But uncertainties arise in emulating the effects of the atmosphere and earth's surface on incoming solar and outgoing terrestrial radiation, which involves the following:
- In the atmosphere
- Transmission/Absorption
- Reemission (for atmospheric longwave radiation)
- Reflection
- Scattering
- At the earth's surface
- Transformation from shortwave into other forms of energy at the earth's surface, based on the state of that surface over the area covered by the model grid box
- Net emission of longwave radiation from the earth's surface toward space
These uncertainties exist because:
- we can only crudely emulate the effects of the atmosphere and its constituents (for example, clouds, aerosols, and absorbing gases) on the incoming solar beam and outgoing terrestrial/longwave radiation;
- we can only estimate the state of the land and sea surface in models and its effects on the
absorption and subsequent conversion of incoming shortwave radiation into other forms of
energy.
- The real world data needed to fine-tune the emulation of land and sea surface physics (for example, soil moisture and surface fluxes) are incomplete.
Even if a radiation model were perfect, model forecasts would be subject to errors in:
- initial analyses of moisture and cloudiness
- predicting the location and thickness of clouds
- predicting the amount of moisture, aerosols, and trace gases in the atmosphere
- analyzing, predicting, and/or prescribing the land and/or ocean surface state
* Model Emulation of Soil Moisture
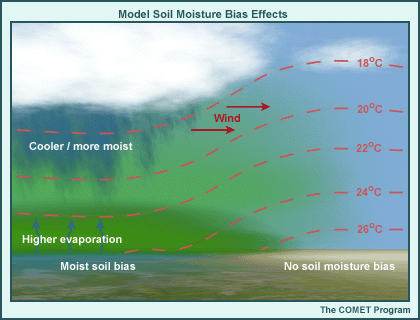
Model emulation of land surface processes, including the evolution of soil moisture conditions, often falls victim to systematic model biases and errors, which can result in model feedbacks that exacerbate the original bias. Such feedbacks may become inconsequential when model dynamics are strong and physical forcing is weak (for example, during the winter season) but become very important when model physics dominates the dynamics. The following gives an example of how such feedbacks work. For illustrative purposes, assume that a positive systematic model precipitation bias results in regional soils becoming too wet.
- This results in excessive evaporation, which leads to cooler and moister surface and boundary-layer conditions than those observed.
- Increased evaporation leads to higher relative humidities in both the region and adjacent downwind areas.
- This results in increased cloudiness and precipitation.
- Increased precipitation reinforces the high soil moisture and cool temperature bias already found in the model.
- Increased cloudiness reinforces the cool bias resulting from increased evaporation.
This example shows the interconnectedness of the model physics components and the domino effect of forecast errors. As you'll see throughout the module, sensible weather forecasts can be sensitive to relatively small differences in surface and atmospheric conditions and the emulation techniques used.
* Model Emulation of Surface Characteristics

The method by which surface characteristics are determined in a forecast model may lead to errors that affect sensible weather forecasts. In the graphic above, we show the actual surface characteristcs within a grid box in the first row, versus how the model emulates them in the second row. In model grid box 1 (on the left), we see:
- The model shows bare ground with a soil type of sand, while the actual surface within the grid box contains the bare sand area, plus a water surface and a forest. We’d expect that in such a situation, the model would not be able to capture the impacts of sub-grid scale surface air temperature and moisture variability on the surface variables, nor on the overlying atmosphere.
- Similarly, in model grid box 2 on the right, we have an urban area within a generally forested grid box, which is treated as deciduous forest in the model. Note the bare trees.
- Model grid box 2 also illustrates another kind of error. Note the actual surface shows leafy, rather than bare, trees. The amount of live vegetation is usually prescribed to a climatological value based on remote sensing. Here, perhaps because of early emergence of live vegetation due to a warmer than normal spring, we have a significant error in vegetation state, with implications on near-surface temperature and moisture, and planetary boundary layer depth and stability.
Finally, individual model physics emulations (parameterizations) are adjusted or "tuned" to work best in the models in which they are used and for situations that occur MOST frequently. This results in errors in emulating physical processes in extreme situations, which, unfortunately, are most important to forecast correctly! This is one of the reasons why future NWP improvements will focus, in part, on improving physics. (In addition, we are close to the limit of improving sensible weather forecasts by increasing resolution for dynamical calculations.)
Atmospheric Radiation
Shortwave and Longwave Radiation Processes
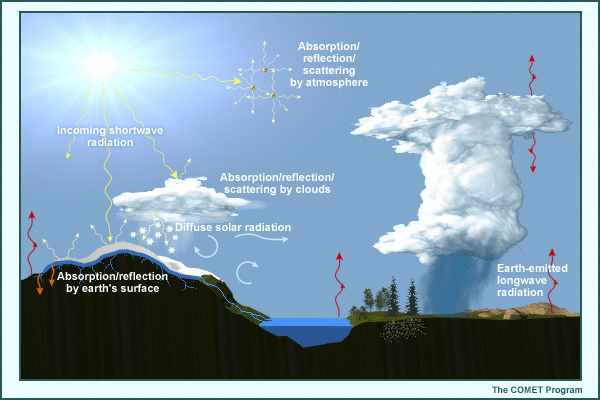
Shortwave (solar) and longwave (terrestrial) radiation processes occur on very small time and space scales and are strongly affected by the local composition of the atmosphere. Solar energy is spread through the ultraviolet, visible, and near-infrared frequencies, but peaks (with about half of the total solar energy) at visible wavelengths. As a direct beam of solar radiation moves down through the atmosphere, its intensity is reduced by:
- absorption by various gases, clouds, and aerosols;
- reflection and scattering by all gas molecules, clouds, and aerosols.
Some of the reflected and scattered solar radiation also reaches the surface as diffuse solar radiation. On average, about half of the incoming solar radiation at the top of the atmosphere (TOA) reaches the ground.
The earth emits energy back to space, but at longer wavelengths. This energy is absorbed by greenhouse gases, clouds, and aerosols as it radiates upward through the atmosphere. In turn, longwave energy is reemitted by these atmospheric absorbers, but in all directions and at intensities determined by the temperature of the radiating objects. As a result of the absorption and reemission of longwave radiation in the atmosphere, the mean temperature of the earth's surface is 33°C warmer than it would otherwise be.
* Shortwave (Solar) Energy Spectrum
The graphic shows the energy spectrum of the shortwave energy at the top of the atmosphere compared to that reaching the earth's surface under average conditions.
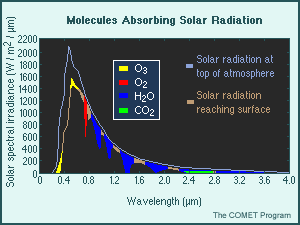
The colored bands highlight specific wavelengths at which incoming shortwave solar radiation is absorbed by ozone, oxygen, water vapor, and carbon dioxide. In the real atmosphere, shortwave radiation is absorbed at preferred wavelengths called absorption lines. The amount of absorption in each line depends upon the total amount of absorbing gas along the direct solar beam between the top of the atmosphere (TOA) and the surface. The remaining differences between the light blue TOA energy spectrum and brown surface spectrum in the graphic result from scattering and reflection by air molecules, aerosols, and clouds, which must also be emulated in NWP. Note that the energy absorbed by shortwave absorbers is reemitted upward and downward as longwave radiation.
* Longwave (Terrestrial) Energy Spectrum
Earth-emitted longwave radiation (and the small amount of near-infrared solar radiation) is also affected at preferred absorption lines, which are irregularly spaced through the longwave spectrum.

The graphic shows the absorption lines for longwave radiation between 3.7 and 16.7 microns, with the groupings or bands for the primary absorbing gases. Absorption of longwave radiation is a function of pressure, temperature, and the amount of the absorbing gas. The absorbed longwave radiation is reemitted both upward and downward, but at a different wavelength and intensity based on the temperature of the absorber. Because the actual absorptions and reemissions take place on molecular scales that cannot be simulated exactly within NWP models, they require radiation parameterizations.
Read the next page for a special note on ozone absorption.
* Ozone Absorption
Getting ozone concentrations correct in the stratosphere might not seem important to forecasters. However, the increasing use of satellite radiance observations in data assimilation systems requires that concentrations of all absorbing gases be accurate at all levels of the atmosphere. That's because satellite data must be used in conjunction with the predicted vertical structure of absorber concentrations to obtain the vertical temperature structure in the atmospheric column. Inaccurate specification of absorbing gases can result in vertical temperature errors and either the incorrect rejection of remote sensing data in data-rich areas or the incorporation of erroneous data in data-poor areas. Either way, the quality of the model's initial conditions and forecast is degraded.
Limitations & Impacts of Radiation Processes in NWP
Parameterizing atmospheric radiation processes in NWP models involves:
- Breaking the atmosphere into vertical layers (as for the dynamical calculations) and predicting, diagnosing, or prescribing the amount of cloud, absorbing gas, and/or aerosols in each layer.
- The effect of all absorbers, scatterers, and reflectors in each layer is then estimated to
determine the amount of incoming radiation absorbed by each layer and the total amount of
shortwave radiation reaching the surface.
- In some models, cloud effects are calculated over a few aggregated thick layers to speed up the radiation calculations.
- The amount of longwave radiation absorbed and reemitted by each model layer is calculated, based on the mean layer temperature, pressure, and amount of absorbing substance. Because absorbed shortwave radiation affects the layer temperature, its effects on longwave emission are included as well.
NWP radiation schemes are usually called much less frequently than the dynamical time step because they are so computationally time-consuming. For example, the WRF-NMM radiation scheme is only called once per simulated hour, while dynamics are calculated every 60 seconds. Therefore, in some instances, the model sun may still be shining after clouds and/or rain have been generated, especially in the case of convection. To reduce the amount of error introduced by the infrequency of radiation calculations, the effect of changes in the solar angle on radiation intensities is taken into account between radiation scheme time steps.
Simplifying assumptions about clouds and other radiatively active atmospheric constituents may be needed to speed up the model but limit how well the model handles incoming shortwave and outgoing longwave radiation. These include assumptions about:
- the overlap of clouds in different model layers;
- the geometry of clouds, cloud particles, and aerosols;
- the water phase (liquid or ice) of the clouds in cloud layers;
- the combining of short- and longwave absorption lines at specific frequencies into broad absorption bands to calculate radiation;
- the relationship of model layer RH and cloud water mixing ratio to fractional cloudiness;
- the relationship of convective precipitation amount to fraction of grid box covered by convective cloud.
The largest errors in short- and longwave radiation calculations result from errors in predicting or diagnosing the presence of model clouds. Large errors can also result from model deficiencies in determining the effects of partial cloudiness, particularly the relationship of the model RH and cloud water mixing ratio to the amount of model cloudiness. The simplifying assumptions listed above contribute further to errors in atmospheric radiative transfer.
Surface Processes
Why Surface Processes are Important
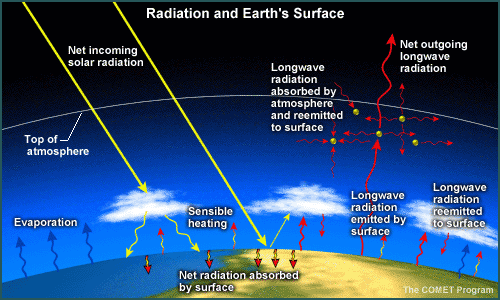
In the real world, Earth's surface interacts with incoming solar radiation that remains after scattering, reflection, and absorption by the atmosphere. The resulting surface energy balance depends upon surface albedo, availability of water to evaporate from the surface and/or its vegetation, roughness of the surface, surface type (soil, water, or ice), presence of snow, and other characteristics. The net surface energy balance directly determines surface temperatures and characteristics of the atmospheric layer directly influenced by the earth's surface (the planetary boundary layer or PBL).
The elements of the surface energy balance include:
- Net incoming solar radiation absorbed at the surface (determined by the solar angle and surface albedo)
- The amount of longwave radiation emitted by the surface and reemitted by the atmosphere back down to the surface (net longwave radiation)
- The amount of absorbed energy used to heat the surface (sensible heating) and for evaporation and sub-surface soil heating (ground heat flux)
- Ease with which the surface sheds its heat through sensible and latent heat flux
The actual absorption of solar radiation and subsequent exchange of sensible heat, moisture, and momentum between the surface and the atmosphere (and from the surface into the ground) is affected in reality by a detailed configuration of the:
- Type of surface (land, water, or ice)
- Type and amount of vegetation (through albedo, evapotranspiration characteristics, and amount of live vegetation, known as vegetation fraction)
- Type of soil (which determines porosity and thermal properties)
- Surface roughness (determined by vegetation and topography over land and by wind velocity over water)
Since the surface water balance is determined in part by precipitation minus evaporation, energy and water budgets at the earth's surface are linked through evaporation. Evaporation from the surface is affected by the:
- Amount of available incoming solar energy
- Amount of soil moisture available for evapotranspiration through vegetation
- Amount of water held on vegetation leaves for re-evaporation
- Existence and mass of snow cover
How Models Emulate Surface Characteristics
In NWP models, earth surface parameterizations emulate the interaction of the surface with incoming radiation to:
- Exchange heat, moisture, and momentum between the surface and atmosphere
- Drive the PBL
To do so, models must account for the effects of some or all of the characteristics mentioned previously.
With respect to a model's ability to emulate Earth's surface and accurately depict radiative processes, you should ask yourself:
- Which characteristics are accounted for in the land surface scheme? How are they modeled? What is the magnitude of their effects relative to dynamical processes such as advection?
- What is the source for initial data for each model surface characteristic? How representative are source data for each part of your forecast area?
- How is each characteristic handled as the model forecast evolves? For example, is it fixed or forecasted based on interaction with the model atmosphere?
- How realistically does the model account for surface processes? For example, many models emulate sub-surface soil temperature and moisture changes by using discrete soil layers. The number and thickness of soil layers in the land-surface model impacts its ability to accurately calculate soil moisture and temperature.
Errors in emulating surface processes result in errors in near-surface temperature and moisture forecasts, and stem from:
- Incorrect amounts of short- and longwave radiation reaching Earth due to incorrect forecasts of cloud and atmospheric moisture, etc.
- Incorrect surface albedo due to errors in surface representation (see below).
- Surface representation errors:
- the vegetation type and vegetation fraction prescribed in the land surface part of the model may not be representative of your area at forecast time;
- the soil type (coarseness and albedo) may not be representative;
- snow cover in winter may not be accurately predicted or prescribed.
- Incorrect evaporation from soil moisture errors, precipitation errors, or errors in surface condition representation of vegetation amount or soil type; or from incoming energy errors.
- Feedbacks from other errors. For example, incorrect evaporation may result in cloudiness errors, which will result in net solar radiation errors, which will amplify existing surface temperature errors.
Turbulent Processes in the Real Atmosphere
Heating of the atmosphere by radiation occurs primarily through the transport of heat, moisture, and momentum from the earth's surface to the PBL and free atmosphere. This is accomplished mainly through turbulent mixing at numerous small time and space scales by mechanically and buoyantly driven eddies. Turbulent processes produce these vertical transports many times more efficiently than molecular processes such as conduction. Among other things, these processes result in the modification of polar air masses as they move equatorward over warmer surfaces, development of diurnal convection, and frontogenesis along the horizontal edges of surfaces with contrasting characteristics such as land/sea boundaries.
The PBL exhibits strong diurnal, synoptic (3- to 5-day), and seasonal variations. In general, PBL depth depends upon:
- the amount of sensible and latent heating from the surface, which determines static stability and the growth of turbulent eddies;
- the amount of vertical wind shear, which determines the amount of mechanical turbulence available to grow turbulent eddies.
The surface temperature and vertical temperature and wind gradients in the lowest part of the atmosphere drive the diurnal development of the PBL. As a result, the observed PBL and associated vertical transport between the surface and free atmosphere are deepest on windy days and/or when the skin temperature is much warmer than the overlying atmosphere (for example, a sunny summer day with a dry land surface, or a winter day with strong cold air advection over a warm surface). The PBL also tends to be deeper over rough surfaces, since there is a direct relationship between the size of obstacles at the surface and the size of turbulent eddies near the ground.
On the other hand, the PBL is shallow and stable with little or no vertical transport between the surface and free atmosphere (decoupled) in calm conditions and when the earth's surface is colder than the overlying atmosphere (for example, on a calm night or a calm day with deep snow cover).
In the real atmosphere, turbulent eddy transport is most important near the earth's surface, where surface heating, evaporation, and friction are largest. However, turbulent mixing of heat, moisture, and especially momentum also takes place in the free atmosphere, and its cumulative effects must also be accounted for through parameterization.
* PBL Components
This page contains detailed information about the observed elements of the PBL in the real atmosphere and how NWP models account for them.
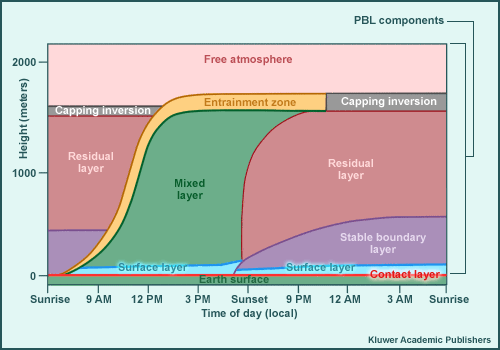
The daily evolution and variety of structures in the PBL are most evident in the warm season when the diurnal cycle of incoming solar radiation results in the largest differences in energy available for surface processes between day and night in middle latitudes.
The graphic illustrates the components that can constitute the PBL and shows how their depth and orientation change throughout the diurnal cycle. Note that as the depth of the actual and model PBL changes, so do the number of model levels that encompass it and the model's ability to capture PBL processes. The daytime components are driven by conduction, convection, and turbulence. Nighttime components are driven by conduction and radiational cooling. Click each label to learn more about the layer's characteristics and how models emulate them.
Contact Layer
Actual characteristics
- At the bottom of the PBL; a thin layer (centimeters in depth) in direct contact with the earth's surface.
- Transfers heat and moisture vertically by conduction and molecular processes.
- Located where the exchange between the earth's surface and the atmosphere begins.
- Temperature and moisture differences between air and material surface determine the direction of the exchange (for example, warm air over a cold surface results in heat conduction from air to surface, cooling the air and warming the surface).
NWP emulation
- Contact layer fluxes are usually estimated:
- using differences between the surface and first layer (or shelter-level temperature and moisture extrapolated from the first model layer if the model vertical resolution near the ground is too coarse) values for temperature and moisture to estimate vertical temperature and moisture gradients;
- using differences of surface and first layer (or 10-m level extrapolated as above)
values for wind to estimate the aerodynamic effects on sensible and latent heat
flux.
- Generally, stronger vertical wind gradients result in larger overall fluxes. Stronger vertical temperature and moisture gradients result in larger vertical fluxes of heat and moisture, respectively.
- The accuracy of vertical temperature, moisture, and wind gradients (and thus
fluxes) depends upon the:
- forecast "skin" temperature (which depends upon the accurate emulation of surface energy and water balances);
- predicted first layer temperature, moisture, and wind (and extrapolation to shelter level, if used);
- assigned surface roughness, which partially determines the vertical wind gradient. Depending upon the model, surface roughness may either be fixed, have an annual cycle (for example, deciduous vegetation), or be allowed to vary based on the wind speed (for example, emulating the effect of ocean waves on surface roughness). Over land, surface roughness may be assigned based on the vegetation type or from an independent dataset.
Free Atmosphere
Actual characteristics
- Above the top of the PBL, where the surface has no direct effect on flow.
- At its bottom, exchanges heat, moisture, and momentum with the PBL.
- Not directly forced by radiative processes.
- Horizontal and vertical transport by sub-grid scale motions (for example, horizontal and
vertical turbulent eddies and gravity waves), while smaller than in the PBL, still must be
accounted for.
- Eddies are generally forced by horizontal and vertical wind shears.
- Fast-moving gravity waves are forced by sharply peaked, high variance surface
topography, which behaves differently from momentum flux in the PBL created by the
vertical wind shears.
- The drag on horizontal momentum created by highly variable surface topography is dumped where gravity wave speed equals the horizontal wind speed.
NWP emulation
- Dynamical processes dominate.
- Determines turbulent mixing rates from stability and wind shear parameters (this is important, for example, in regions of strong temperature gradients and near jet streaks).
- Uses vertical gradients of moisture, heat, and momentum to determine the end result of mixing; tends to be small within the free atmosphere, but can be large at the PBL/free atmosphere interface.
- Gravity waves (a special case of turbulence).
- Effects are usually emulated using topographic variance within each grid box.
- Gravity wave speed is estimated based on stability criteria and topographic roughness.
- Need gravity wave speed to determine the amount and vertical distribution of
gravity wave generated momentum (where estimated gravity wave speed matches
horizontal wind).
- Vertical temperature and wind gradient errors (stability) and wind speed errors (location of regions to put gravity wave generated momentum) will result in effects on the jet stream location in the vicinity and downwind of mountains, lee side cyclogenesis, and movement of cold air to the lee of mountain ranges.
- Effects are usually emulated using topographic variance within each grid box.
Stable Boundary Layer (SBL)
Actual characteristics
- Forms on clear, calm nights and when warmer air moves over colder surfaces.
- Grows mainly by conduction with air in the contact layer, with additional contribution from radiative cooling.
- Forms after the superadiabatic surface layer breaks down as the ground cools after mid-afternoon heating maximum.
- Near sunset, the surface layer, contact layer, and SBL can merge. As night progresses and cooling by conduction from cool surface continues, the surface layer becomes a smaller fraction of the SBL, with constant, typically small and/or negative fluxes of moisture, heat, and momentum.
- There is no well-defined SBL top, but a gradual transition at the top of the nocturnal temperature inversion.
NWP emulation
Indirectly by:
- Estimating rates of conduction from the lowest model layers to the ground, using vertical gradients of temperature, moisture, and momentum.
- Usually uses the same scheme as for a mixed layer.
Surface Layer
Actual characteristics
- Heat, moisture, and momentum are transported by convection (thermal instability) during the day and by conduction with the contact layer at night.
- Comprises approximately the next 10% of the PBL above the contact layer in a well-developed daytime PBL or well-developed stable boundary layer (SBL) at night.
- The size of surface-layer transports depends upon fluxes out of the contact layer and are thus sensitive to near-surface temperature, moisture, and wind profiles.
- Acts as the source for buoyant eddies or thermals, which drive the mixed layer during the day.
- Acts as a 'buffer' between the contact layer and 'skin' and the rest of the atmosphere, through turbulence, with quasi-constant heat, moisture, and momentum transports between the contact and the mixed layer during the day and SBL at night.
- At night, evolution is somewhat more complicated, with initial merging of contact, surface, and SBL right after sunset with subsequent evolution of three separate entities.
NWP emulation
- Assigns or determines a depth for the surface layer based on observed behavior of the surface layer and the model's vertical resolution.
- Flux from the contact layer is assumed to be constant through the surface layer.
- Accuracy depends upon the contact layer flux calculation (see contact layer).
Mixed Layer
Actual characteristics
- Main mode of transport is through turbulence during the day when the surface is hotter than the overlaying atmosphere.
- Located between the surface layer and the area where dry free-atmosphere air is taken into the PBL (the entrainment zone).
- Vertical transports vary and depend upon the size and intensity of turbulent eddies.
- Vertical eddy size depends upon the vertical lapse rate, distance from the surface, and
vertical wind shear (so the rate of mixed layer growth depends upon the amount of surface
heating).
- Note: Individual large eddies created by differential heating of the surface at small scales (10s to 100s of meters) may transport quantities against or "counter" to the prevailing large-scale gradient before the large-scale vertical gradients become unstable, as noted in the description of PBL evolution above; this results in warm, moist air transport from what at grid scale is a cool layer to warmer layers above. This counter-gradient flux breaks the nocturnal inversion and builds the PBL sooner than might otherwise be expected.
- Has a well-defined top (or cap) characterized by a stable layer/temperature inversion.
NWP emulation
- Depending upon the model, the height of the PBL top is diagnosed using stability criteria in the bottom-most model layers.
- Calculates or prescribes mixing coefficients for each layer between the surface layer and PBL top.
- May allow mixing between non-adjacent layers in one time step or may limit mixing to adjacent layers only.
- May emulate vertical mixing by small-scale eddies before the large-scale vertical temperature and moisture gradients would otherwise allow (allow for counter-gradient flux).
Entrainment Zone (EZ)
Actual characteristics
- Area where parcels from the 'free atmosphere' can be brought into the PBL by turbulent mixing; builds upward as the depth of the superadiabatic layer increases.
- If the lifting condensation level (LCL) has been reached, will contain cumulus or stratocumulus cloud.
- The top of the EZ is frequently characterized by a temperature inversion resulting from large-scale subsidence and cooling/moistening through the evaporation of shallow cumulus. The existence of a temperature inversion tends to cap the vertical development of the PBL and allows buildup of moist static energy in the PBL.
- Cooling and moistening of the EZ through turbulent eddy exchange or through large-scale lifting can reduce or remove this cap, resulting in explosive convection if the PBL is sufficiently unstable.
NWP emulation
- Not directly emulated, although a transition zone between the PBL and free atmosphere is usually present in NWP models, which may include a stable inversion layer.
- Some models use a shallow convective scheme as an extension of the PBL scheme to handle EZ.
- If model vertical resolution is too coarse, this may not be captured at all and the inversion may be missed.
Capping Inversion
Actual characteristics
- A stable layer topping a residual mixed layer after the surface and atmosphere decouple, resulting from the earlier entrainment by the active daytime PBL.
- The inversion remains until the mixed layer reaches its level the next day.
- Prevents interaction with the free atmosphere.
- Advection and subsidence affect the capping inversion strength.
NWP emulation
- Not directly emulated, although a stable inversion layer usually appears in NWP models as a transition zone between the PBL and free atmosphere.
- Often too shallow to be represented well in models, especially when at elevations where model resolution is relatively coarse and when the PBL is unusually deep.
Residual Layer
Actual characteristics
- The inactive (no new mixing) well-mixed layer remaining after sunset, after the atmosphere decouples from the surface. Any remaining turbulent mixing action becomes negligible shortly after sunset.
- Retains the characteristics of the daytime mixed layer, changed only by radiative cooling or horizontal advection.
- Remains until the next day's surface heating "recouples" the surface to the residual mixed layer, resulting in a rapid 'jump' in PBL height.
NWP emulation
- Usually well emulated as the land-surface decouples from the atmosphere, but depends upon the adequacy of the model boundary layer structure.
Interface between PBL and Free Atmosphere, Shallow Convection
Actual Characteristics
Exchange of heat, moisture and momentum between the PBL and the free atmosphere take place in the entrainment layer. In the real world, such exchanges occur through turbulent eddies at a rate dependent on the vertical wind shear and the vertical gradients of temperature and moisture at the horizontal and vertical scales of these eddies. Visual evidence of these turbulent eddies is the fair weather cumulus clouds frequently seen on sunny days, especially during the warm season.
Emulation in NWP Models
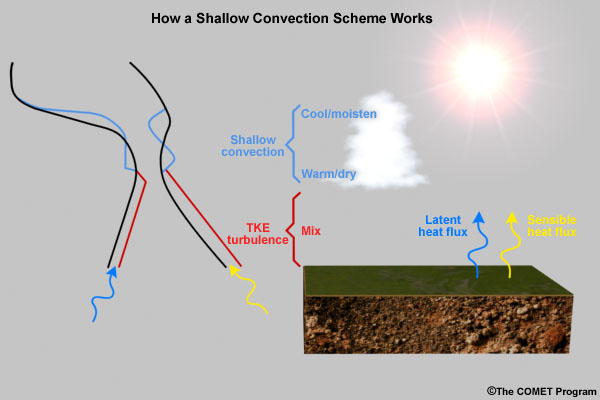
In NWP, the entrainment layer is parameterized through what is known as a shallow convection scheme. Such schemes are either an extension of the PBL scheme or a separate shallow convection scheme1. Either way, it is necessary to account for the downward mixing of heat and momentum, and upward mixing of moisture between the model PBL and the model free atmosphere. Without doing so, significant errors in both PBL forecasts and the transition zone between the PBL and free atmosphere occur, with ramifications on model forecasts of temperature and moisture, stability indices such as CAPE and CIN, and PBL cloudiness.
For non-hydrostatic models accounting for convective processes explicitly with no convective parameterization scheme, there needs to be a shallow convection scheme; otherwise the model will be missing this process.
Impact on NWP Models
An underactive shallow convection scheme will result in a PBL that:
- is too moist,
- is too shallow,
- is too cool,
- has too much stratus.
An overactive shallow convection scheme will result in the opposite effects on the PBL.
1 In 2009, some PBL parameterizations such as YSU include entrainment at top of PBL, others such as Mellor-Yamada-Janjic do not.Model Errors in PBL Prediction
The accuracy of vertical transports from the model surface through its PBL and into the free atmosphere is based in part on the accuracy of predicted model skin temperature and near-surface grid-scale model temperature, moisture, and wind. This may seem a daunting task especially:
- considering the scale of turbulent processes being emulated;
- because the accuracy of the surface energy balance and surface temperature depends upon:
- additional assumptions required in the radiation and surface physics parameterizations;
- the contribution to the forecast vertical structure of temperature, moisture, and wind by the dynamics.
In fact, individual grid boxes may be greatly affected by model physics errors within hours. However, experience shows that unless there are significant errors in large-scale cloudiness or surface temperature, the large-scale (synoptic) effects of turbulent processes are actually emulated fairly well. Even so, local errors that result from deficiencies in PBL and other model physics parameterizations may accumulate and feed back onto the larger synoptic scales over time.
Model PBL errors can be caused by errors in model physics and dynamics, such as:
- errors that result in incorrect model surface energy balance and thus model skin
temperature, including:
- cloudiness errors,
- snow cover errors,
- soil moisture errors,
- soil heat diffusion errors,
- surface characterization errors, for example vegetation type and amount, and snow cover and water equivalent;
- errors that result in incorrect lapse rates or vertical wind shear, including:
- temperature advection errors,
- skin temperature errors,
- wind forecast errors,
- incorrect prescription of model surface roughness;
- inaccuracies in the surface and PBL emulation itself, including errors in:
- the moisture and/or heat fluxes in the soil model,
- the assumed or diagnosed location of the PBL top,
- the assumed or diagnosed profile of wind, temperature, and moisture near the surface,
- an over- or underactive shallow convection parameterization (either within the PBL scheme or separately) mixing heat, moisture, and momentum;
- the assumptions made to close the PBL calculation loop, for example:
- the profile of heat, moisture, and momentum diffusion rates in the PBL,
- the match between the actual size of turbulent eddies and closure assumptions (local vs. non-local closure). See note below.
In the next section, we will explore how changes in the parameters used for model radiation and surface physics processes affect the model forecast, including the development of the model PBL.
Closure Assumptions
In general, closure is what links the assumptions in a model parameterization to the forecast variables themselves. For the PBL, the forecast surface and near-surface winds, temperatures, and moisture are used to estimate the amount of buoyant and mechanical energy that will be available to create the model PBL. The resulting PBL transports are then used to further adjust the forecast variables. Closure accuracy partly depends upon the level of internal interactions included in the calculations (order of closure). For example, first order closure only estimates the effect of the turbulent eddies on PBL growth, while second order closure estimates both these effects and the effect of turbulent eddies on each other. Additionally, PBL parameterization may assume that the full PBL or only adjacent layers mix at a PBL point during one time step (non-local versus local closure, see graphic below for pictorial description).
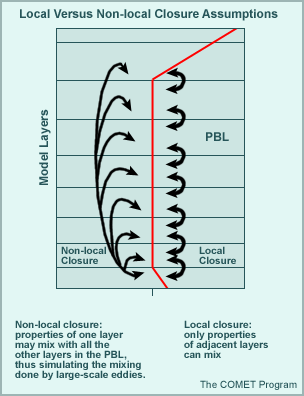
Theoretically, higher-order local closure should give more accurate PBL results (for example, improved forecasts of turbulence or parameters used to estimate turbulence, such as the Reynolds number). However, the vertical and temporal resolutions to effect improvements turn out to be higher than operational models currently employ. Hopefully, as resolution of the lower troposphere and near-surface atmosphere improves, PBL emulation will be enhanced.
Physics Parameters
Click each subtopic under Physics Parameters in the menu on the left. Each parameter subsection has three pages:
- Introduction: Discusses the impact of the parameter on other variables in the real world and the model forecast.
- Case Exploration: Presents cases run using a single column model that illustrate the effect of different parameter values on the model forecast sounding for temperature and dewpoint.
- Question: Presents a forecast scenario that asks you to assess the effect of the parameter on important forecast variables.
We recommend that you go through each subsection in its entirety. But, if you have sufficient knowledge of the parameter, you may want to start with the question and see how you do. You can then review the other pages as needed.
Cloud: Introduction
The emulation of model cloudiness affects energy available to heat the model surface through reflecting, scattering, and absorbing incoming solar radiation before it reaches the surface. Operational models now explicitly predict clouds in the precipitation scheme and pass the resulting cloud water information to the radiation scheme.
Clouds can be treated differently for radiation purposes than for precipitation. Some models cannot "see" parameterized shallow cumulus influencing radiation because, for example, there is no precipitation from the CP scheme from which to diagnose such clouds.
The presence or lack of clouds within a specific forecast can profoundly affect the energy available for the surface energy budget. Clouds are notoriously difficult for models to accurately predict.
Models may also diagnose other cloud characteristics important to radiation processes. For example, the fraction of a grid layer containing cloud (cloud fraction or "patchiness") may be estimated based on a critical cloud water mixing ratio. Where partial cloudiness is diagnosed, assumptions must be made about how cloud patches in different layers overlap each other. Also, because the radiative behavior of ice versus water clouds is different, cloud water phase effects must be emulated, even if cloud water phase is not dealt with in the precipitation and cloud parameterization.
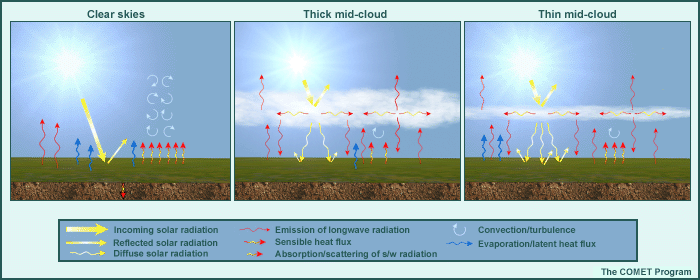
To examine the effect of cloud cover on the model forecast, the single column model was forced with real-time June and July data from the southern Great Plains with a moderate amount of soil moisture. Runs were begun at 12 UTC/6 AM local time. The only initial condition changed was cloud at mid-levels, as diagnosed by the model's radiation scheme. Therefore, differences between model runs result from differences in diagnosed model cloudiness and the resulting effects on model physics. The three cloud conditions used were:
- clear skies
- thick, mid-cloud cover
- thin, mid-cloud cover
On the next page, we will march through a diurnal cycle for each experiment and examine the evolution of the surface and PBL resulting from the different cloud cover and cloud thickness, using skew-T diagrams.
Cloud: Case Exploration
Each of the following three cases (clear skies; thin, mid-cloud cover; and thick, mid-cloud cover) is presented through an interactive two-panel graphic (conceptual graphic and skew-T) and a table with text explanations.
On the interactive graphic, click Next Frame and Previous Frame below the skew-T to step through the times, or Play Animation to run through the entire sequence. Skew-Ts are plotted against the clear sky case for comparison. On the skew-T, the tops of the planetary boundary layer (PBL) and stable boundary layer (SBL) are marked with horizontal lines to the right of the temperature profile as they evolve. Effects of differing cloud cover within the first hour of simulation on the vertical temperature structure are minimal, but as the day progresses, differences become quite significant. At the end of each case, scroll down below the table to see the diurnal cycle details of the temperatures in the surface layer.
When you have finished exploring all three cases, click the next page button; you will answer a question related to the cases.
1. CLEAR SKIES CASE
| Time of day | Surface Energy Balance | Temperature | Moisture | PBL | Winds |
|---|---|---|---|---|---|
|
Daytime effects |
With dry soil, high sensible heat flux, low latent heat flux/evaporation |
Strong heating, superadiabatic lapse rate near surface |
Drying as PBL entrains air from above |
Grows to maximum height of about 800-850 hPa |
Stronger due to downward momentum mixing |
|
Nighttime effects |
Large longwave cooling due to clear skies |
Rapid cooling as sun sets, more slowly later |
Moisture remains in elevated mixed layer |
Nocturnal inversion; stable layer at 40-hPa depth by 11 PM local time |
Winds calm rapidly as decoupling takes place |
Clear Skies Case, Diurnal Cycle
The graphic shows additional features not visible near the surface in the skew-T diagram. They determine how strongly surface heating will drive PBL development and are important since they indicate surface layer instability.
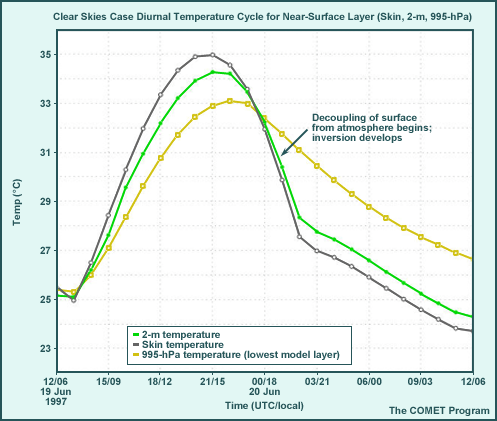
- PBL/mixed layer development during the day is driven by a superadiabatic temperature
gradient in the surface layer.
- The surface-to-995-hPa temperature difference, used to determine the surface sensible heat flux, develops by 0800 local time (14 UTC) and is maintained until 1700 local time (23 UTC); it is as high as 2.5°C (superadiabatic).
- The maximum shelter (2-m) temperature reaches 34.5°C.
- Stable PBL development is facilitated by cooler surface than air temperatures after 1700
local time (23 UTC).
- The temperature inversion between 995 hPa and the skin begins to develop around 00 UTC/1800 local time and intensifies through the night, reaching a maximum of 4.5°C by local sunrise.
- Minimum shelter (2-m) temperature drops to 24.4°C.
2. THICK, MID-CLOUD CASE
| Time of day | Surface Energy Balance | Temperature | Moisture | PBL | Winds |
|---|---|---|---|---|---|
|
Daytime effects |
Lower downward shortwave radiation, lower sensible and latent heat flux |
Weak heating, 3-4°C cooler |
Little change to PBL (less mixing but less evaporation) |
Grows to maximum height of about 910-920 hPa |
Weaker due to less downward momentum mixing |
|
Nighttime effects |
Less longwave cooling due to mid-level cloud deck |
Slower cooling |
Drier above the daytime PBL (less moisture mixed upward) |
Weaker nocturnal inversion; slower stable layer development |
Winds decrease less rapidly than with clear skies |
Thick, Mid-cloud Case, Diurnal Cycle
The graphic shows features near the surface not easily seen in the skew-T diagram. They are important, however, since they indicate surface layer instability and thus how strongly surface heating will drive PBL development.
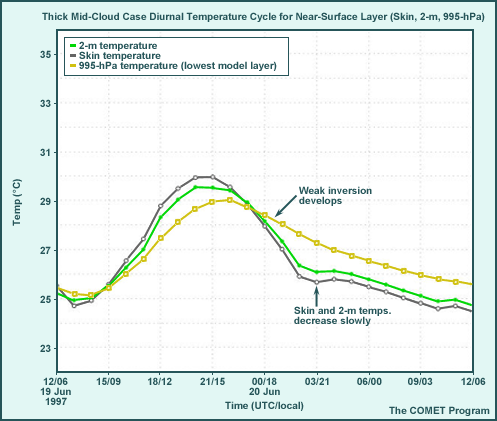
- With thick cloud, there is a less steep temperature gradient in the surface layer (and
the PBL will be shallower and slower to develop).
- The surface-to-995-hPa temperature difference does not develop until 0900 local time (15 UTC) and is maintained only until 1600 local time (22 UTC); it is only about 1° to 1.5°C.
- Maximum shelter (2-m) temperature reaches only 29.5°C.
- Stable PBL development is facilitated by the cooler surface.
- There are smaller (1° to 1.5° C) differences between the surface and 995-hPa temperatures after 1700 local time (23 UTC) than the clear skies case.
- The minimum 2-m air temperature is 24.7°C, slightly higher than the clear sky case.
3. THIN, MID-LEVEL CLOUD CASE
| Time of day | Surface Energy Balance | Temperature | Moisture | PBL | Winds |
|---|---|---|---|---|---|
|
Daytime effects |
Fluxes intermediate between clear and thick cloud |
Intermediate heating, 2-3°C cooler |
More moisture than thick cloud (because of more evapotrans-piration) |
Grows to maximum height of about 870 hPa |
Intermediate between clear sky and thick cloud |
|
Nighttime effects |
Intermediate rate of longwave cooling |
Slower cooling than clear sky, more rapid than thick mid-level cloud |
Drier above the daytime PBL (less moisture mixed upward) |
Stable layer timing and depth intermediate between clear sky and thick cloud |
Winds decrease less rapidly than with clear skies, more rapidly than with thick cloud |
Thin, Mid-cloud Case, Diurnal Cycle
The graphic shows features near the surface not easily seen in the skew-T diagram. They are important, however, since they indicate surface layer instability and thus how strongly surface heating will drive PBL development.
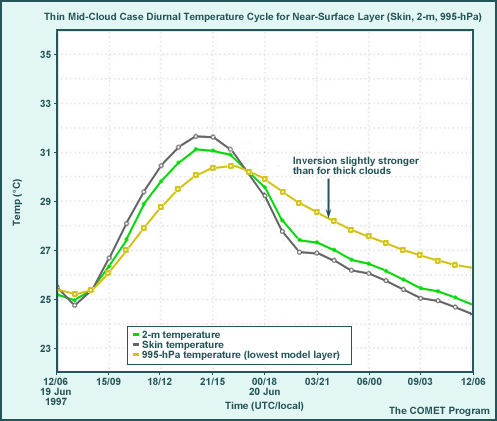
- With thinner cloud, results are somewhere between the thick cloud and clear sky cases.
- The surface-to-995-hPa temperature difference does not develop until 0900 local time (15 UTC) but is maintained until 1700 local time (23 UTC) and runs about 1.25° to 1.75°C.
- The 2-m-to-995-hPa temperature difference spans approximately the same time frame and is about 0.5° to 0.7°C.
- The maximum shelter (2-m) temperature is 31°C.
- Note the small 'blip' in temperature at 1700 local time (23 UTC). This is caused by an increase in incoming solar radiation due to a temporary further thinning of the relatively thin, mid-level cloud deck.
- After 1700 local time (23 UTC), nocturnal inversion development is facilitated by
surface temperatures cooler than the 995-hPa temperatures. The nighttime temperature
gradients are stronger than the thick cloud case but weaker than the clear sky case.
- The temperature inversion between the skin temperature and 995 hPa appears around 00 UTC/1800 local time, reaches a maximum around sunset, and then oscillates through the night. It ranges from 1.5° to 2°C.
- The minimum 2-m temperature is the highest in the cases at 24.8°C. This is because of the additional energy input during the day through the thinner, mid-level cloud deck.
Cloud: Question
Question
You are the lead forecaster for the nighttime shift during the month of June. Upwind of your location, a mesoscale convective complex (MCC) is dying out, leaving a considerable amount of mid-level cloudiness or "debris," which can be seen on IR satellite imagery. After examining the initial conditions of the forecast models, it is clear that the MCC has not been analyzed in the cloud water fields and that the associated cloud water fields will not be resolved. The models indicate that the next day will feature full sun with some afternoon airmass convection developing at the same time that the debris should be advecting over your area. You estimate that, in reality, it will take most of the day for the MCC-generated cloudiness to clear your area.
How would you modify the model forecast for the following parameters? (Use the selection boxes to choose the best answer.)
Discussion
The model will not account for the effects of MCC-generated cloudiness in predicting the following day's weather because the associated cloud water field is not correctly analyzed. As a result, model maximum temperature forecasts are likely to be too warm, as too much incoming solar radiation in the model will reach the surface. However, the error will be sensitive to the thickness of the residual cloud layer being advected over your area, so until you assess the thickness of the cloud, it will not be possible to determine the amount that the temperature should be reduced.
Because the MCC cloudiness will reduce incoming solar radiation below what the model expects, the PBL will be shallower than predicted. This will also result in weaker near-surface wind speeds and turbulence than forecast by the model.
In this situation, the amount of evapotranspiration from plant activity will be reduced depending upon how much incoming solar radiation is decreased, which in turn depends upon the thickness of the cloudiness. However, since there will be less mixing down of dry air from the free atmosphere, the PBL RH will be higher. The more vigorous vertical development of the forecast model PBL will result in incorrectly high RH above the actual PBL.
Even though the RH is somewhat higher than if the sky were going to be clear, the specific humidity will likely be less because of the reduced evapotranspiration, resulting in less latent energy available for convection. Combined with cooler actual PBL temperatures, actual PBL stability will be greater than in the model and it is likely that any convective precipitation generated by the model will be overdone. Forecasts of such convective precipitation should be reduced. However, on the upwind edge of this 'cloud caused cool pool,' the 'cool front' may enhance the probability of convection.
Water Surfaces: Introduction
Water surfaces in the real world
While near-saturated land surfaces can allow more evaporation during the day because higher surface temperatures and additional evapotranspiration by vegetation, at night, water surfaces allow more evaporation than near-saturated land surfaces because of their warmer temperatures and the shutdown of evapotranspiration from vegetation.
Heat added to the water surface by sunlight can be mixed to an appreciable depth by mechanical wind energy and, at times when the water surface is cooling, by convective overturning of the water. Water is also a better heat reservoir than land because of:
- Its high heat capacity,
- The depth to which heat can be mixed,
- Its relatively slow loss of heat at the water/atmosphere interface through longwave, sensible, and evaporational cooling because of its usually cool surface temperature.
Therefore, lake and sea surface temperatures usually change more slowly than land surface temperatures.
Finally, heat can be transported by water just as it can be by the atmosphere through surface and sub-surface ocean and lake currents.
NWP treatment of water surfaces
By necessity, NWP models not coupled to an ocean or lake model greatly simplify water surfaces by:
- Fixing water surface temperatures (WSTs) to an observed initial value, a water surface temperature climatology, or some combination of the two through the forecast,
- Assuming that the atmosphere is not affected by changes that might, in reality, occur to WSTs through the forecast,
- Assuming the real atmosphere cannot significantly impact WSTs through the forecast.
Because land is usually rougher than water, the effect of frictional forces over land is stronger. Therefore, the same amount of downward mixing of atmospheric momentum over land will generally result in weaker surface winds turned more toward lower pressure than over the oceans. Beware, however, of the effects of water on stability in the warm season; if the water is cooler than the overlying air, downward momentum mixing and wind speeds will be reduced.
NWP models with ocean/lake coupling use the forecast wind, temperature, and long- and shortwave radiation to force an ocean or lake model, which may be very simple (such as a "slab" model) or more complex (such as the Hybrid Coupled Ocean Model (HYCOM) with the Hurricane WRF model). See the bottom of this page for more information on modeling of atmosphere/ocean coupling.
Forecaster issues with NWP treatment of water surfaces
As a forecaster, you should be aware of:
- The data source for WSTs in the forecast.
- The frequency at which WSTs are updated (e.g., daily or weekly).
- Representation of shorelines and grid boxes that straddle shorelines.
- Effects of resolved but small features (less than five to seven grid boxes in length) that cannot be completely depicted and forecast.
- Sub-grid scale water bodies that are often not represented in the model. An area with numerous small water bodies that aren't represented on the forecast model's surface (for example, Minnesota) will have errors similar to those when the model has too little soil moisture or vegetation. Actual conditions should blend land and water surface conditions.
- Unrepresented water bodies that may provide potential discontinuities on which convection can develop.
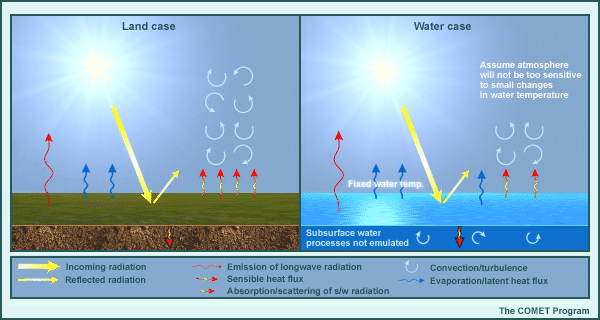
Forecasts for water surfaces are very different from that over land surfaces for the same initial radiative forcing. To examine these differences, a land and water surface simulation was run using the single column model forced with observed research data from the southern Great Plains. The land case is taken from the dry soil case for the soil moisture example. Runs were begun at 12 UTC. For the water case, the bottom boundary is changed from land to water, with all other initial conditions (including the initial skin temperature) and dynamical and solar forcing identical. Remember that when the earth surface is set to water in the single column model, the surface temperature is held fixed throughout the forecast.
On the next page, we will march through a diurnal cycle for each experiment and examine differences in the skew-T diagram that result from changing surface type from land to water.
Note: in this case we have relatively warm water (26.5°C), but similar effects would occur at other water temperatures when the SST and daily mean air temperature in the land case are about the same. Results are very different in situations with widely different air and water temperatures, such as
- Warm air over cold water (for example, marine stratus on the California coast)
- Cold air over warm water (for example, arctic outbreaks passing over the Great Lakes resulting in downwind lake-effect snows)
Atmosphere Coupling to Oceans and/or Lakes
Interaction of atmosphere and water surface in nature
The atmosphere and oceans or lakes of the world exchange heat, moisture in various states, and momentum at the air-water interface. Atmospheric winds drive surface ocean and lake currents, while density differences resulting from temperature and salinity gradients drive currents in the deep ocean. But these differences are ultimately the result of atmosphere-water surface interaction as well, through sensible and latent heat fluxes, incoming solar energy, surface wind stress "dragging" the water, and fresh-water inputs such as precipitation, runoff from land surfaces and melting of land ice.
Additionally, oceans and lakes have a mixed layer similar to the atmosphere's planetary boundary layer, driven through air-water interaction. Buoyancy can play a major role here when water is air- or radiation-cooled, or saltier water becomes denser than the water below. Under such circumstances, the cooler and/or saltier water will convectively sink, just as a heated air bubble will rise, establishing and deepening the mixed layer. More often though, the mixed layer is driven and maintained by mechanical mixing through surface wind stress.
As the atmosphere drives the oceans, so does the ocean drive the atmosphere, particularly in the tropics where atmosphere-water interactions and ocean temperature gradients impact large-scale circulations, and the large-scale convection that ultimately drives the global atmosphere. Atmosphere-ocean interactions are important to atmospheric phenomena at many scales, from convective complexes generating equatorial Pacific westerly wind bursts, to seasonal monsoon circulations and basin-wide interannual phenomena such as El Niño-Southern Oscillation.
The ocean is a huge reservoir of heat, and its currents advect large quantities of heat poleward in both hemispheres. On seasonal to interannual scales, advection of heat through ocean currents is a vital part of the global climate. On time scales of NWP models, though, this is not an important process.
Coupling the atmosphere and water bodies in NWP models
Coupling the atmosphere and water bodies in NWP model requires having a model of the water body, and periodic communication of atmospheric conditions to the water surface for determining the energy and salinity (for oceans) budgets. Because water bodies respond much more slowly than the atmosphere to forcing, communication from ocean to atmosphere must be done more frequently than from atmosphere to ocean. This is not inconsistent with the practice of holding water surface temperatures (WSTs) fixed for the duration of the NWP forecast, for short- and medium-range weather forecasts; in uncoupled models, it is assumed that any changes that occur to the water surface are not significant to the forecast.
The model water surface exchanges moisture and heat with the atmosphere through latent and sensible heat fluxes, momentum through surface drag (dependent on surface wave size), and radiation through reflected shortwave energy and radiated longwave energy. The model atmosphere provides a forecast of surface wind stress vector, net fresh water input through precipitation less evaporation (and sometimes runoff from the land surface), and downward short- and longwave energy fluxes.
When is atmosphere-ocean/lake coupling important?
Coupling the ocean and lakes to the atmosphere is important in seasonal or synoptic situations where WSTs may change rapidly, and such changes will impact the forecast. A partial, not nearly exhaustive list includes:
- During lake effect snow season downwind of the Great Lakes, where lapse rates are an important determinant of lake effect snow amounts during cold outbreaks.
- During hurricane season, when hurricane movement over warm oceans result in rapid upwelling of cooler water, which can weaken such storms, and affect development of future storms in their wake
- During calm periods in the tropics, when the ocean surface can be "insulated" from the deeper water through lack of vertical mixing, and warming results from solar heating in the first few centimeters of water. The diurnal range of WSTs under such circumstances has been observed to be as much as several degrees C, which may impact PBL development and static stability.
Water Surfaces: Case Exploration
Each of the following two cases (land and water) is presented through an interactive two-panel graphic (conceptual graphic and skew-T) and a table with text explanations.
On the interactive graphic, click Next Frame and Previous Frame below the skew-T to step through the times, or Play Animation to run through the entire sequence. The skew-Ts for the water case are plotted against the land case for comparison. The effects of differing surfaces on the vertical temperature structure after less than one hour are minimal with differences less than 1°C, but over the course of the day, they become quite significant. On the skew-T, the top of the planetary boundary layer (PBL) is labeled and marked with a horizontal line to the right of the temperature profile as it evolves. At the end of each case, scroll down past the table to see the diurnal cycle details of the temperatures in the surface layer.
When you have finished exploring the cases, click the next page button; you will answer a question related to the cases.
1. LAND CASE
| Time of day | Surface Energy Balance | Temperature | Moisture | PBL | Winds |
|---|---|---|---|---|---|
|
Daytime effects |
With dry soil and low land surface heat capacity, high sensible heat flux, low latent heat flux/evaporation |
Strong heating, superadiabatic lapse rate near surface |
Drying as PBL entrains air from above |
Grows to maximum height of about 750 hPa |
Lower than water because of surface roughness |
|
Nighttime effects |
Large longwave cooling due to clear skies |
Rapid cooling as sun sets, more slowly later |
Moisture remains in elevated mixed layer |
Strong nocturnal inversion; stable layer at 50-hPa depth by 3AM local time |
Winds near surface calm with decoupling, increase above nocturnal inversion |
Land Case, Diurnal Cycle
The graphic shows features that are difficult to see near the surface in the skew-T diagram. They are important, though, since they indicate the instability of the surface layer and thus how strongly surface heating will drive PBL development.
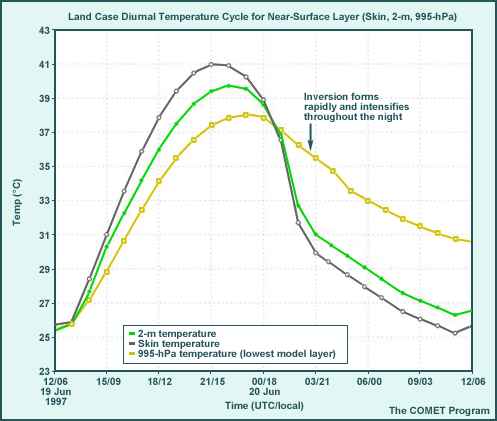
- From morning to mid-afternoon:
- a strong superadiabatic layer forms above the skin;
- skin temperatures warm above the 995-hPa temperature by 14 UTC/0800 local time;
- skin temperatures are as much as 4°C higher than the 995 hPa by 21 UTC/1500 local time;
- the maximum 2-m air temperature is almost 40°C.
- From late afternoon through the following night:
- decoupling of the surface from the atmosphere (when skin temperature becomes lower than the 2-m air temperature) begins about one hour before sunset (01 UTC/1900 local time);
- skin temperatures are consistently 4° to 6°C below the 995-hPa air temperature after 01 UTC/1900 local time;
- the minimum 2-m temperature is about 26.5°C.
2. WATER CASE
| Time of day | Surface Energy Balance | Temperature | Moisture | PBL | Winds |
|---|---|---|---|---|---|
|
Daytime effects |
Very small sensible heat flux, very large evaporation |
Water temperature fixed, strong constraint to overlying air |
Near-surface moistens rapidly with evaporation from surface, drier above PBL because of much less vigorous mixing |
Grows to maximum height of about 950 hPa, maintained by mechanical turbulence only |
Higher than land because of surface roughness |
|
Nighttime effects |
Fixed water surface temperature strongly constrans fluxes |
Little change after sunset near surface, more change due to advection above |
Moisture remains in near-surface mechanically mixed layer; more moisture from surface to 900-hPa, drier than land case above |
Strong nocturnal inversion; stable layer grows to 50-hPa depth |
Winds near surface stronger than land for full forecast |
Water Case, Diurnal Cycle
The graphic shows features near the surface that are difficult to see in the skew-T diagram. Note how severely constrained the temperatures are above the water surface and that the water surface temperature is fixed at its initial value.
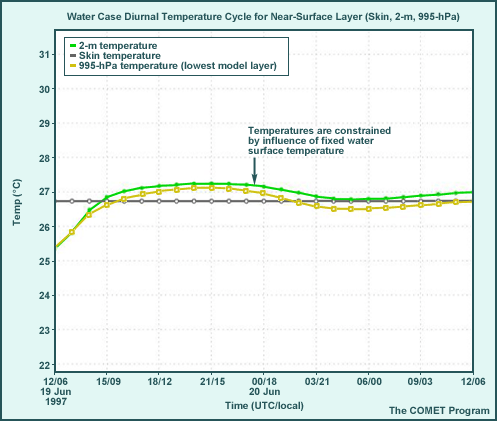
- The near-surface diurnal cycle is almost nonexistent.
- Skin, 2-m, and bottom (995-hPa) model layer temperatures are almost equal (after a 2-hr spin-up) through the diurnal cycle.
- After spin-up, the skin-to-995-hPa temperature gradient is never superadiabatic and in fact is often negative, so the water surface and atmosphere are always thermally uncoupled in the model. (The temperature difference required for a superadiabatic lapse rate between 1000 and 995 hPa is 0.44°C).
- There is virtually no evidence of a nocturnal inversion as skin, 2-m, and 995-hPa temperatures are nearly the same.
- Moisture changes as reflected in dewpoints, though not shown, are significant.
Water Surfaces: Question
Question
You are the lead forecaster for your field office on a summertime day shift in an area popularly known as "the land of 10,000 small lakes." Given that the model you're using has a horizontal resolution of 22 km, none of the lakes in your forecast area are depicted in its land surface model, which uses a land-water mask with 40- x 40-km resolution. Additionally, there is no provision in the land surface part of the model for partial sub-grid scale coverage by water. The model forecast is for sunny, hot, and humid weather today, with a slight chance of convective activity in the afternoon.
How, if at all, would you modify the following forecast parameters, knowing the model deficiency in depicted water surfaces in your forecast area? (Use the selection boxes to choose the best answer.)
Discussion
The sub-grid scale water surfaces in your forecast area will act both as water sources, since water bodies provide an essentially limitless source for evaporation (and use incoming solar energy impacting the water surfaces), and as heat sinks, since water has a high heat capacity and can be vertically mixed.
As a result, model maximum temperature forecasts are likely to be too warm by several degrees C as a large portion of the incoming solar radiation in the model will be used to heat land rather than to evaporate from undepicted water surfaces. Note, however, that for towns located well away from lakes (and therefore not as directly affected by the water surfaces), the temperature forecasts may not be too far off. This is an excellent case of local variability in forecasts.
Because of the generally cooler surface resulting from increased evaporation, the depth of the PBL will be significantly less than the model forecast PBL depth. This will also result in weaker near-surface wind speeds and turbulence than forecast by the model.
More evaporation from sub-grid scale water surfaces means more RH near the surface and within the PBL. Therefore, model RH is likely to be too low, making an upward adjustment in near-surface RH necessary. The shallower PBL will also leave slightly lower RH above its PBL than would have resulted if the land surface was actually all soil and the PBL had been able to grow deeper.
Finally, with the existence of sub-grid scale (and undepicted) water surfaces, more PBL moisture will exist for the development of diurnal convection and may overcome the reduced instability resulting from cooler PBL temperatures. To determine whether the probability of convection will increase or decrease, you'd want to create a modified sounding by adjusting for estimated temperature, dewpoint, and PBL height errors to assess the likelihood of convection. You will also have to assess the effect of the sub-grid scale variability in surface types (land vs. water) on the formation of sub-grid scale convection.
Snow: Introduction
The emulation of snow cover within models mainly affects the amount of incoming solar radiation available to the surface for heating (through differences in albedo). Model snow cover and snow depth are determined using various methods, two examples of which are listed below.
- Initial snow cover and water equivalent snow depth are incorporated from available analyses. Water equivalent snow depth is forecast through a simple snow budget, which requires diagnosis of precipitation type and water equivalent amount of snow accumulation, snow sublimation, and/or snowmelt over the forecast period. This method is used, for example, in the GFS in 2009. Effects of snow aging on, for example, albedo and snowmelt, and the insulating effects of snow with respect to the ground are not accounted for.
- Initial snow cover and water equivalent snow depth are incorporated from available analyses, but also snow density is diagnosed based on first atmospheric layer temperature as the snow accumulates. Snow melt and rain falling into snow pack are partially stored in the snow pack up to a critical snow density, beyond which all water runs off. This method is used in the WRF-NMM in 2009.
How models determine the initial snow amount and forecast the snowpack affects the model surface albedo. Additionally:
- Some models base the albedo of a snow-covered grid square on model snow depth relative to model-prescribed surface and topographic roughness. This estimates the effect of potentially bare surfaces, such as trees, hilltops, and rock outcroppings, on overall model surface albedo.
- Some models also account for the effect of patchy snow when snow cover is thin.
In both cases, the albedo ranges between the prescribed albedo for the underlying surface (such as grassland) and that for totally snow-covered surfaces.
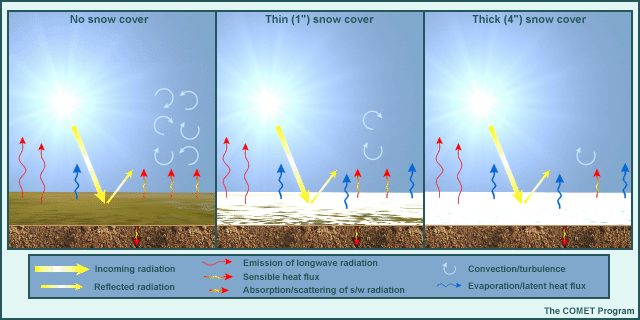
Some second-order effects include increased evaporation (because snow surfaces are treated as water surfaces for calculating evaporation rates) and the constrained model skin temperature in the presence of snow (cannot exceed 0°C until model snow vanishes, though where there is patchy snow, some models have a mixed bare ground/snow-covered temperature that may slightly exceed 0°C).
The presence of snow in a forecast model directly affects predicted surface and boundary-layer temperatures, moisture, and other forecast variables. It is thus important to consider how snow cover and snow depth in a forecast model are determined. The methods of initializing and forecasting snow cover and snow mass used in specific operational models (described in the Operational Models Encyclopedia) will help you determine whether model snow cover and snow depth are reasonably represented in and around your area and will offer clues on how to adjust the model forecast to account for potential model snow cover/depth errors.
To examine impacts of the presence and depth of snow cover on the model forecast for a specific location, the single column model was forced with real-time January data from the Great Plains. Runs were begun at 11 UTC. The only initial condition changed was the amount of snow on the ground. Three model forecast cycles were run:
- No-snow run with bare ground
- Thin snow cover run with 1" of snow
- Deep snow run with 4" of snow
All other initial conditions and forcings were left identical. On the next page, we will march through a diurnal cycle for each experiment and examine the different evolving surfaces and PBLs, using skew-T diagrams.
Snow: Case Exploration
Each of the following three cases (no snow, 1" snow cover, and 4" snow cover) is presented through an interactive two-panel graphic (conceptual graphic and skew-T) and a table with text explanations.
On the interactive graphic, click Next Frame and Previous Frame below the skew-T to step through the times, or Play Animation to run through the entire sequence. The skew-Ts are plotted against the no-snow case for comparison. On the skew-T, the tops of the planetary boundary layer (PBL) and (for the no snow case) stable boundary layer (SBL) are marked with horizontal lines to the right of the temperature profile as they evolve. You'll see that differing snow cover has only minimal effects on the vertical temperature structure after only one time step (much less than 1°C), but that the effects become quite significant as the day progresses. At the end of each case, scroll down below the table to see the diurnal cycle details of the temperatures in the surface layer.
When you have finished exploring all three cases, click the next page button; you will answer a question related to the cases.
1. NO-SNOW RUN WITH BARE GROUND
| Time of day | Surface Energy Balance | Temperature | Moisture | PBL | Winds |
|---|---|---|---|---|---|
|
Daytime effects |
Low sun angle, dry soil, inactive vegetation, low temperatures lead to dominant sensible heat flux and little evaporation (10:1 ratio), albedo ranges from 0.28 to 0.19 with higher values at sunrise/sunset |
Relatively strong heating, superadiabatic lapse rate near surface even in January! Max 2-m temp ~5°C |
Drying as PBL entrains air from above |
Significant PBL growth doesn’t start until local noon, PBL grows to max height of 850 hPa at mid-afternoon |
Stronger due to downward momentum mixing |
|
Nighttime effects |
Large longwave cooling due to clear skies |
Rapid cooling as sun sets, more slowly later; min 2-m temp -8.5°C |
Moisture remains in elevated mixed layer |
Collapses rapidly after 1500 local time, stable layer and inversion sets up but does not strengthen as in summer due to dry winter air |
Winds calm rapidly as decoupling takes place |
No-Snow Run with Bare Ground Case, Diurnal Cycle
The graphic shows features near the surface not easily seen in the skew-T diagram. They are important, however, since they indicate the instability of the surface layer and thus how strongly surface heating will drive PBL development.
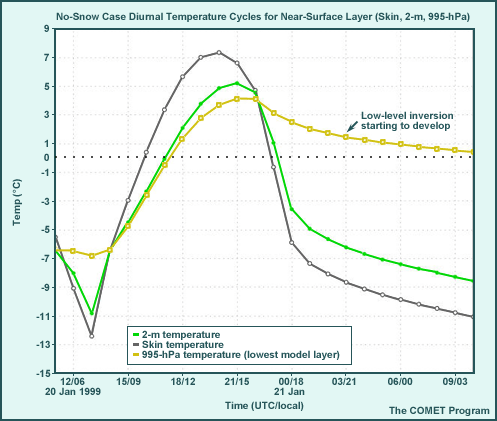
- The model maximum shelter (2-m) temperature is about 5°C, while the model skin temperature reaches over 8°C.
- The model skin temperature exceeds its 2-m air temperature from 15 UTC/0900 local time
through 21 UTC/1500 local time, producing:
- a superadiabatic layer immediately above the ground;
- vigorous turbulent mixing;
- strong model PBL growth and maintenance.
- After mid-afternoon, the model skin temperature drops below the air temperature and the
2-m air temperature cools rapidly from contact with the colder ground,
- decoupling of the surface from the atmosphere begins about one hour before sunset;
- a nocturnal inversion develops in the hour before 1700 local time (23 UTC).
- As the strong nocturnal inversion rapidly develops between the lowest model layer (995 hPa) and the ground, the skin temperature becomes as much as 9.5°C colder than the 995-hPa temperature just before dawn the next morning.
- The minimum shelter temperature is about -8.5°C.
2. 4" INITIAL SNOW COVER (compare to no snowcover)
| Time of day | Surface Energy Balance | Temperature | Moisture | PBL | Winds |
|---|---|---|---|---|---|
|
Daytime effects |
Due to 4” snow cover, albedo ranges from 0.7 to 0.61 with higher values at sunrise/sunset; very little sensible heat flux |
PBL 4-6°C cooler than no-snow case, max 2-m temp -2°C |
5-8°C higher dewpoints, drier above PBL than no-snow case (sublimating snow) |
Significant PBL growth starts around local noon, PBL grows to height of 950 hPa at mid-afternoon |
2-3 mph less than no-snow case |
|
Nighttime effects |
Even larger longwave cooling due to snow cover |
Rapid cooling as sun sets, more slowly later; min temp ~ -12.5°C |
Moisture remains in elevated mixed layer |
No well-defined stable layer, but deep layer with stable lapse rates gradually steepens above about 750-hPa |
Winds calm rapidly as decoupling takes place |
4" Initial Snow Cover Case, Diurnal Cycle
The graphic shows features near the surface not easily seen in the skew-T diagram. They are important, however, since they indicate the instability of the surface layer and thus how strongly surface heating will drive PBL development.
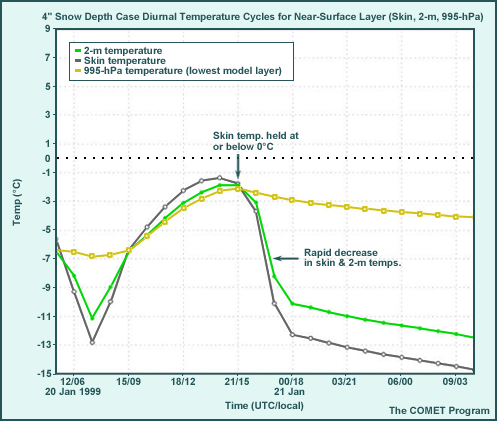
- Model surface and near-surface temperatures are considerably cooler after mid-morning
local time.
- Insufficient solar energy is absorbed and used to heat the snow surface to allow for the snow to reach the freezing point.
- The maximum skin temperature is over 9°C less than in the no-snow case.
- The maximum shelter temperature is -2°C or 7°C less than the no-snow case.
- Skin temperatures exceed 995-hPa temperatures by only about 1°C and only from 16 UTC/1000 local time to 20 UTC/1400 local time, which results in weak model PBL development.
- The shelter (2-m air) and skin temperatures rapidly decrease beginning shortly before sunset (23 UTC/1700 local time), falling well below the 995-hPa temperature and resulting in an inversion of as much as 10°C by just before dawn the next day, local time.
- Minimum shelter temperature is about -13°C or about 4°C less than the no-snow case.
3. 1" SNOW COVER (compare to 4" and no snowcover)
| Time of day | Surface Energy Balance | Temperature | Moisture | PBL | Winds |
|---|---|---|---|---|---|
|
Daytime effects |
Sufficient snowmelt for patchy snow effect; albedo is 0.48 at sunrise, 0.36 at noon, 0.32 minimum as model snow becomes patchy (less than 1-mm water equivalent) |
PBL 2-5°C cooler than no-snow case, max 2-m temp 1°C as snow becomes patchy |
6-9°C higher dewpoints (higher than 4” snow case, higher surface temps lead to more evaporation into shallow PBL |
Significant PBL growth starts around local noon, PBL grows to height of 940 hPa mid-afternoon |
2-3 mph less than no-snow case |
|
Nighttime effects |
Even larger longwave cooling due to snow cover |
Rapid cooling as sun sets, more slowly later; min temp ~ -11°C |
Moisture remains in elevated mixed layer |
No well-defined stable layer, but deep layer with stable lapse rates gradually steepens above about 800-hPa |
Winds calm rapidly as decoupling takes place |
1" Initial Snow Cover Case, Diurnal Cycle
The graphic shows features near the surface not easily seen in the skew-T diagram. They are important, however, since they indicate the instability of the surface layer and thus how strongly surface heating will drive PBL development.
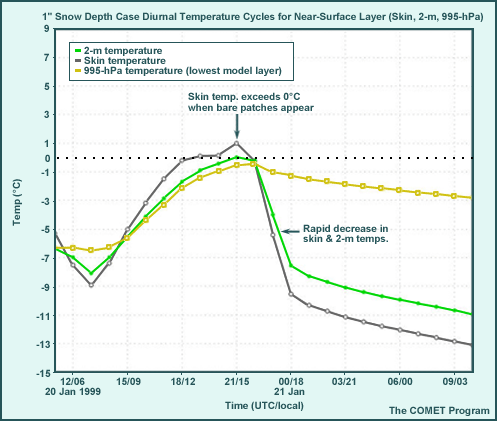
- Skin temperature exceeds the 995-hPa temperature from 15 UTC/0900 local time to 21
UTC/1500 local time, the same as the no-snow case and two hours more than the 4"
snow case.
- Because of the lower average albedo resulting from the effects of surface and topographic roughness on the thinner snow cover, more energy is absorbed at the ground.
- The maximum shelter temperature is 1°C or 5°C less than the no-snow case.
- Decoupling of the surface from the atmosphere (skin temperature less than air temperature) occurs at the same time as for the no-snow case.
- The skin temperature rapidly decreases below the 995-hPa temperature, resulting in an inversion of as much as 10°C by just before dawn the next day, local time.
- Minimum shelter temperature is -11°C or 2.5°C less than the no-snow case.
Snow: Question
Question
You are the lead forecaster for the daytime shift during December, downwind from Lake Erie. The first lake-effect snow event of the year (not adequately predicted by the operational forecast models) occurred last night, depositing 6 to 12" of snow in your area. The forecast for today is for full sun, as high pressure moves over your area and cold advection and onshore winds abate. While the models use datasets derived from satellite data to determine the existence of snow cover, snow depth data was unavailable and the model was initialized with diagnosed model snow depth from the previous model run. The model surface albedo for snow is reduced toward the characteristic albedo of the underlying surface for any snow depth less than 2". This morning's model snow depth is only about 1".
How, if at all, would you modify the model forecast for the following parameters? (Use the selection boxes to choose the best answer.)
Discussion
Going through the explanations in order, the model has a thin initial snow cover while there actually are several inches of freshly fallen lake-effect snow. As a result, model maximum temperature forecasts will likely be too warm by several degrees C, as too little incoming solar radiation in the model will be reflected away in areas where the lake-effect snow occurred.
A caveat on maximum temperature: Any areas in the forecast area where no lake-effect snow occurred might actually have higher temperatures than the model indicates. Mesoscale "snow-breeze" circulations may also result from differential surface heating of snow covered versus bare surfaces, which may also affect maximum temperatures, PBL development, and surface winds.
Because of the snow-covered surface and cold surface temperatures, the PBL will barely be able to develop in reality, while the model forecast PBL depth will be greater because of less snow cover and accounting for patchy snow. The misrepresentation of snow depth in the model will also result in weaker near-surface wind speeds and turbulence than forecast by the model. Sublimation from snow means more RH near the surface and near-surface PBL. Therefore, model RH is likely to be too low so an upward adjustment in near-surface RH is necessary. The development of the PBL in the model, with its lighter than observed snow cover, will result in incorrectly high RH above the actual PBL.
For wintertime low sun angles and stable PBLs, the model surface will have no significant effect on the forecast for precipitation amounts, with synoptic-scale forcing dominating. If the synoptic-scale is accurately forecast, the model can be used, with attention focused on the inherent limitations of the precipitation scheme in determining precipitation probabilities. If conditions become favorable for lake-effect snow in the forecast, the model's problems with forecasting lake-effect snow will also have to be considered.
Vegetation Fraction: Introduction
The portion of a model grid box covered by live vegetation, known as vegetation fraction, affects surface and boundary-layer temperatures, moisture, and other forecast variables through the:
- Amount of water transpired through plants (evapotranspiration)
- Amount of incoming solar radiation available to the surface for heating (mostly through differences in albedo, but also to a slight degree due to radiation used up in photosynthesis)
- Partitioning of incoming solar radiation into sensible and latent (evaporation) heat fluxes
Note that vegetation type also affects the surface energy balance in similar ways, based on the different albedos and amounts of evapotranspiration allowed by different vegetation types. This is covered in the vegetation type section.
It is important to consider whether a model emulates the effect of vegetation fraction on surface processes. If so, you should know the data source for the modeled vegetation fraction, and how seasonal variations and climate anomalies (particularly during spring greenup) that impact vegetation fraction are emulated, if at all. Also note that under conditions that greatly limit evapotranspiration, such as extreme drought, heat and cold, vegetation fraction will not matter, regardless of the amount of vegetation fraction. Data for vegetation fraction are typically derived from remote sensing, such as the Normalized Difference Vegetation Index (NDVI) and Leaf Area Index (LAI) climatologies. Future operational models will likely use real time vegetation health indices, converted to a model-useable live vegetation fraction.
Operational model treatment of vegetation fraction (found in the Operational Models Encyclopedia) will help you determine whether vegetation fraction in a model reasonably represents the amount of live vegetation in your area, and will offer possible adjustments necessary to model forecasts for your location.
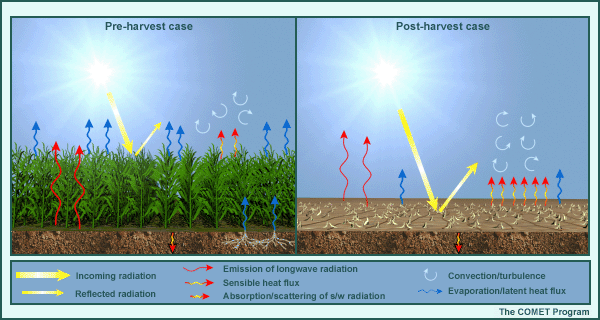
To examine the impacts of prescribed vegetation fraction on the model forecast, the single column model was forced with observed June research data from the southern Great Plains. Soil moisture was more than adequate for evapotranspiration. Runs were begun at 12 UTC. The only initial condition that was changed was the vegetation fraction. All other initial conditions and forcing were left identical. The conditions used were:
- Pre-harvest, with live vegetation covering 100% of the grid square. This could represent active crops a few weeks to a month before they are harvested, or a grid square dominated by a later maturing crop.
- Post-harvest, with live vegetation covering 32% of the grid square. This could also represent a grid square at the same time as the pre-harvest one, but with a crop that matures and is harvested a month or so earlier.
On the next page, we'll march through a diurnal cycle for each experiment and examine the different evolution of the surface and PBL resulting from different prescribed vegetation fractions using skew-T diagrams.
Vegetation Fraction: Case Exploration
Each of the following two cases (pre- and post-harvest) is presented through an interactive two-panel graphic (conceptual graphic and skew-T) and a table with text explanations.
On the interactive graphic, click Next Frame and Previous Frame below the skew-T to step through the times, or Play Animation to run through the entire sequence. The skew-Ts for the pre-harvest case are plotted against the post-harvest case for comparison. On the skew-T, the tops of the planetary boundary layer (PBL) and stable boundary layer (SBL) are marked with horizontal lines to the right of the temperature profile as they evolve. You'll see that differing vegetation amounts has only minimal effects on the vertical temperature structure after only one hour (much less than 1°C), but that the effects become quite significant over the course of the day. At the end of each case, scroll down below the table to see the diurnal cycle details of the temperatures in the surface layer.
When you have finished exploring the cases, click the next page button; you will answer a question related to the cases.
1. POST-HARVEST CASE
| Time of day | Surface Energy Balance | Temperature | Moisture | PBL | Winds |
|---|---|---|---|---|---|
|
Daytime effects |
Little transpiring vegetation, so high sensible and low latent heat flux/ evaporation (similar to dry soils) |
Strong heating, superadiabatic lapse rate near surface; max temp 41°C |
Drying as PBL entrains air from above |
Grows to maximum height of about 750 hPa |
Stronger from downward momentum mixing, smaller roughness (1-2 mph) |
|
Nighttime effects |
Large longwave cooling due to clear skies |
Rapid cooling as sun sets, more slowly later; min temp 26.5°C |
Moisture stays in elevated mixed layer above 800 hPa |
Nocturnal inversion; stable layer at 40-hPa depth by end of forecast |
Winds calm rapidly near surface, increase above stable layer with decoupling |
Post-Harvest, Diurnal Cycle
The graphic shows features near the surface not easily seen in the skew-T diagram. They are important, however, since they indicate surface layer instability, and thus how strongly surface heating will drive PBL development.
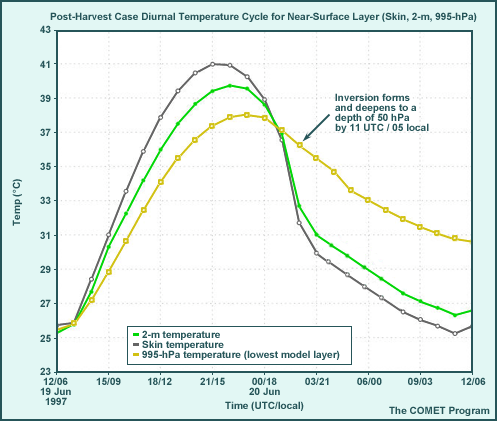
- More heat goes into sensible heating of the surface than into evaporation of water
because less live vegetation is transpiring. The ratio of sensible to latent heating
(Bowen Ratio) ranges from 1 to 2 through the course of the day.
- The surface relative humidity is lower.
- The skin-to-995-hPa lapse rate becomes superadiabatic by 15 UTC/09 local time and reaches a maximum difference of 4°C in the early- to mid-afternoon.
- The maximum shelter (2-m) temperature is 39°C or 5°C higher than post-harvest.
- As the sun sets, the model surface cools quickly relative to the air above it.
- Decoupling of the surface from the atmosphere begins about one hour before sunset (01 UTC/19 local time).
- A nocturnal inversion develops by 02 UTC/20 local time
- The inversion intensifies as the surface continues to cool during the night.
- By 11 UTC/05 local time, the nocturnal inversion is 50 hPa deep.
- The skin temperature is about 5°C cooler than the 995-hPa temperature by sunrise.
- The minimum 2-m temperature is 26.5°C or 1.5°C warmer than the pre-harvest case.
2. PRE-HARVEST CASE
IMPORTANT NOTE: With dry soils and vegetation wilting, there would be little to no difference between this and the post-harvest case.
| Time of day | Surface Energy Balance | Temperature | Moisture | PBL | Winds |
|---|---|---|---|---|---|
|
Daytime effects |
With sufficient soil moisture, large amount of transpiring vegetation, low sensible and high latent heat flux/ evaporation (similar to wet soils) |
Weaker heating, little to no super-adiabatic lapse rate near surface; max temp 34.5°C |
Moister near-surface and PBL, drier above pre-harvest PBL. Dewpoints 5-8°C higher |
Grows to maximum height of about 850 hPa, 4-6°C cooler than post-harvest case |
Weaker winds near surface, less turbulence. |
|
Nighttime effects |
Large longwave cooling due to clear skies |
Rapid cooling as sun sets, more slowly later; min temp 25°C |
Moisture stays in elevated mixed layer above 800 hPa |
Nocturnal inversion less pronounced; stable layer at 30-hPa depth by end of forecast |
Winds calm rapidly near surface, increase above stable layer with decoupling |
Pre-harvest, Diurnal Cycle
The graphic shows features near the surface not easily seen in the skew-T diagram. They are important, however, since they indicate surface layer instability and thus how strongly surface heating will drive PBL development.
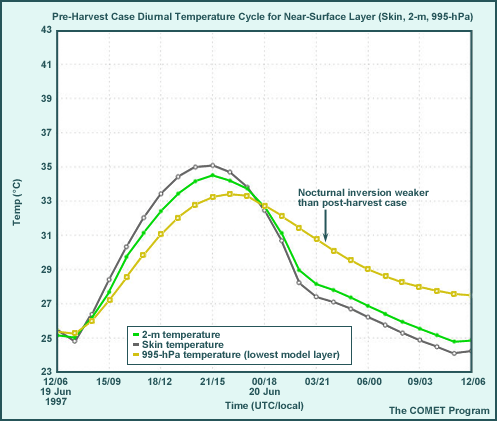
- The skin temperature is warmer than the 995-hPa temperature from 0800 local time (14 UTC) to 1800 local time (00 UTC). The resulting lapse rates are less superadiabatic (2° to 3°C) than the post-harvest case.
- Maximum shelter (2-m) temperature is about 34.5° or 5°C less than the post-harvest case.
- The skin temperature is cooler than the 995-hPa temperature from 1800 local time (00 UTC) to the next morning, but by a lesser amount than in the post-harvest case (3° to 4°C from 2100 local time/03 UTC on).
- The minimum 2-m air temperature is about 25°C, 1.5°C less than in the post-harvest case.
Vegetation Fraction: Question
Question
You are the lead forecaster for the daytime shift in a largely agricultural region. Because of cooler than normal conditions during the past few months, none of the local crops have been harvested. The forecast models prescribe a seasonal cycle of vegetation fraction reflecting the percentage of crops that have usually been harvested by this time in your region. The model forecast is for full sun much of the day, with scattered afternoon convection triggered by the model's convection scheme.
How, if at all, would you modify the model forecast for the following parameters? (Use the selection boxes to choose the best answer.)
Discussion
The model has significantly less vegetation prescribed than is actually present because of the later harvest. As a result, model maximum temperature forecasts are likely to be too warm by several degrees C as a large portion of the incoming solar radiation in the model will be used to heat the surface rather than for evapotranspiration through the vegetation canopy.
Because of the cooler land surface resulting from increased evaporation, the PBL depth will be significantly less than the model forecast PBL depth. This will also result in weaker near-surface wind speeds and turbulence than forecast by the model.
More evapotranspiration from plants means more RH near the surface and within the PBL. Therefore, model RH is likely to be too low so an upward adjustment in near-surface RH is necessary. The shallower PBL will also leave slightly lower RH above than would have resulted if agricultural plants had already been harvested and the PBL had been able to grow deeper.
Finally, with full vegetation, more PBL moisture will exist for the development of diurnal convection and may overcome the reduced instability resulting from cooler PBL temperatures. To determine whether the probability of convection will increase or decrease, you would want to create a modified sounding given the vegetation fraction error to assess the likelihood of convection.
* Vegetation Type: Introduction
Vegetation type, along with soil type and vegetation fraction, is required by a model's parameterizations to emulate vegetation effects on surface processes. In reality, vegetation growth, height, albedo, and areal coverage all affect surface interaction with incoming solar radiation and the resulting surface energy and moisture budgets. In areas with forest, the tree canopy acts to shelter the air, vegetation, and land surface beneath it from the effects of open air and sunlight. Therefore, real vegetation and land surfaces behave differently when there is tree canopy overhead.
In operational forecast models, many vegetation types are grouped into general categories with similar characteristics. Each of these categories can be assigned:
- A unique 'evaporability' function, which determines the amount of moisture that vegetation
'exhales' (or evapotranspires) into the atmosphere from the surface and particularly
sub-surface soil as a function of the:
- Available solar energy
- Soil moisture
- Temperature of the vegetation surface and air around it
- Specific humidity of the air around the vegetation
- Fractional area of live vegetation coverage
- A surface roughness based on the typical height and foliage of the plants, which affects the vertical profile of the wind near the surface and thus surface fluxes and near-ground mechanical turbulence
- An albedo, which affects the amount of incoming solar radiation that will be absorbed by the land surface
Model configurations usually assume that vegetation acts as one large plant affecting the entire grid box and is the land surface. The effects of shading and other sheltering of sub-canopy air, vegetation, and land surface are usually not modeled. This has significant implications for surface conditions in model forests versus other model vegetation types, as you'll see below.
Some surface parameters are assigned independent of vegetation based on other datasets. For example, albedo is sometimes assigned independently based on a remote sensing dataset rather than on the model's prescribed vegetation type.
Relatively coarse resolution models or high resolution models using coarse resolution vegetation type datasets, may not accurately emulate variations in vegetation type present in a region. Typically using the dominant vegetation type, large errors may result if the actual vegetation types in a grid box differ greatly.
Vegetation type has direct effects on surface and boundary-layer temperatures, moisture, and other forecast variables. For these reasons, it is important to consider the source data used for model vegetation type, and how vegetation type effects are emulated during a forecast. This information (found for specific models in the Operational Models Encyclopedia) will help you determine whether the vegetation type in the models you are using is representative for your area and, if not, will help you adjust the model forecast for your location.
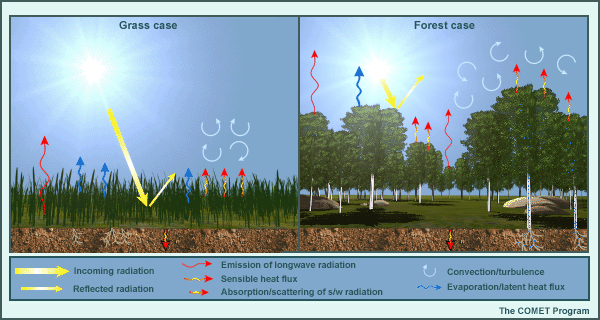
To examine potential impacts on the model forecast, the single column model was run forced with observed research data from the southern Great Plains for June. Runs were begun at 12 UTC/0600 local time. All initial conditions and forcing were identical except for vegetation type. The vegetation types were prescribed as:
- Prescribed grass
- Prescribed deciduous forest
A vegetation fraction of 0.7 and the same volume of soil moisture were assumed for each. On the next page, we will march through a diurnal cycle for each case and examine the differences in the evolution of the skew-T diagram that result from varying or potentially correcting the vegetation type at the land surface.
* Vegetation Type: Case Exploration
Each of the following two cases (prescribed grass and prescribed deciduous forest) is presented through an interactive two-panel graphic (conceptual graphic and skew-T) and a table with text explanations.
On the interactive graphic, click Next Frame and Previous Frame below the skew-T to step through the times, or Play Animation to run through the entire sequence. The skew-Ts for the two cases are plotted against each other in the forest case for comparison. On the skew-T, the tops of the planetary boundary layer (PBL) and stable boundary layer (SBL) are marked with horizontal lines to the right of the temperature profile as they evolve. You'll see that differing vegetation type has only minimal effects on the vertical temperature structure within the first hour of simulation (much less than 1°C), but that the effects become quite significant and differ over the course of the day. At the end of each case, scroll down below the table to see the diurnal cycle details of the temperatures in the surface layer.
When you have finished exploring the cases, click the next page button; you will answer a question related to the cases.
1. GRASS CASE
| Time of day | Surface Energy Balance | Temperature | Moisture | PBL | Winds |
|---|---|---|---|---|---|
|
Daytime effects |
Grass less stressed, high evapotransp-iration/ latent heat flux, low sensible heat flux (Bowen Ratio [ratio of sensible to latent heat]=0.2 to 0.5 |
A little bit super-adiabatic lapse rate near surface; max temp 34°C |
PBL moistens with evapotrans-piration from grass |
Grows to maximum height of about 850 hPa |
Winds increase as turbulence mixes down from free atmosphere |
|
Nighttime effects |
Large longwave cooling due to clear skies |
Rapid cooling as sun sets, more slowly later; min temp 24.5°C |
Moisture stays in elevated mixed layer above 800 hPa |
Nocturnal inversion; stable layer at 50-hPa depth by end of forecast |
Winds calm rapidly near surface, increase above stable layer with decoupling |
Grass Case, Diurnal Cycle
The graphic shows features near the surface not easily seen in the skew-T diagram. They are important, however, since they indicate surface layer instability and thus how strongly surface heating will drive PBL development.
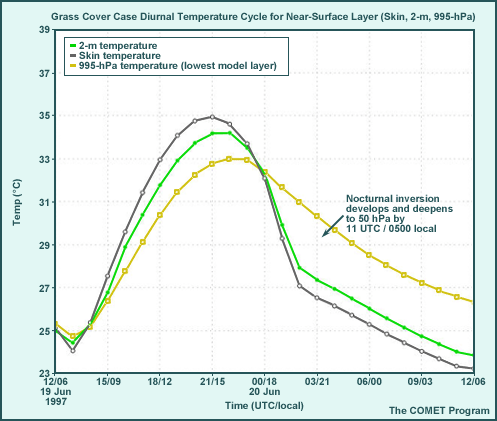
- During the morning to mid-afternoon:
- the superadiabatic lapse rate between the skin and 995 hPa develops by 16 UTC/1000 local time and drives development of the mixed layer PBL.
- skin temperatures are about 2° to 3°C higher than at 995 hPa from late morning through mid-afternoon.
- the maximum shelter (2-m) temperature is about 34°C.
- During the late afternoon through the following night:
- decoupling of the surface from the atmosphere (when the skin temperature becomes lower than the 2-m air temperature) begins about one hour before sunset (01 UTC/1900 local time).
- skin temperatures are consistently 3° to 4°C below the 995-hPa temperature after 01 UTC/1900 local time and drive the development of the nighttime stable boundary layer through surface contact cooling.
- the minimum shelter (2-m) temperature is about 24°C.
2. DECIDUOUS FOREST CASE
IMPORTANT NOTE: In the single column model, deciduous trees are less active at a given level of soil moisture than grass and thus evapotranspire less. Additionally, the top of the tree canopy is assumed to be the ground, so no sub-canopy effects are modeled. Thus, the evapotranspiration effect dominates and replacement of model grass with model deciduous trees is similar to starting with a drier initial soil moisture state. These factors result in what at first glance might be considered counter-intuitive effects.
| Time of day | Surface Energy Balance | Temperature | Moisture | PBL | Winds |
|---|---|---|---|---|---|
|
Daytime effects |
Forest more stressed than grass, lower evapotranspiration/ latent heat and higher sensible heat flux (Bowen Ratio [ratio of sensible to latent heat]=0.4 to 1.2 |
More super-adiabatic lapse rate near surface; PBL 1-2°C warmer, max temp 36.5°C |
PBL dewpoints decrease slightly from PBL mixing, are 2-3°C less than grass case |
Grows to maximum height of about 770 hPa |
Winds reduced because of forest roughness effects, in spite of more turbulent mixing |
|
Nighttime effects |
Large longwave cooling due to clear skies (though see under moisture) |
Rapid cooling as sun sets, more slowly later (with 20% partial cloud); min temp 25°C |
Moisture mixed higher into atmosphere than grass case; develops 20% partial low stratus |
Nocturnal inversion; stable layer at 50-hPa depth by end of forecast, but 1°C warmer |
Winds calm rapidly near surface, increase above stable layer with decoupling |
Forest Case, Diurnal Cycle
The graphic shows features near the surface not easily seen in the skew-T diagram. They are important, however, since they indicate surface layer instability and thus how strongly surface heating will drive PBL development.
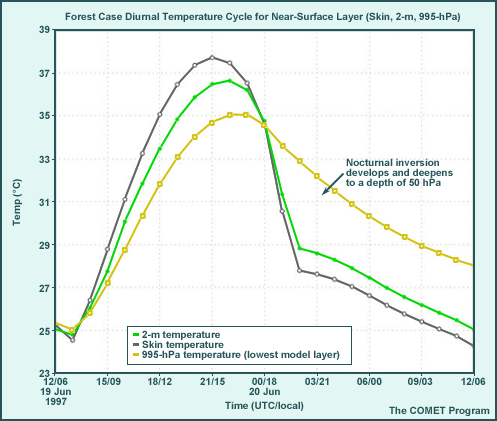
- During the morning to mid-afternoon:
- the superadiabatic lapse rate between the skin (top of tree canopy) and 995 hPa develops by 16 UTC/1000 local time and is already slightly steeper than that for the grassy vegetation case. This superadiabatic lapse rate will drive PBL development.
- skin/canopy temperatures run from 2.5° to 3.5°C higher than the mean temperature of the first model layer at 995 hPa from mid to late morning through mid-afternoon, rather than the 1.5° to 2.5°C of the grassy vegetation case.
- the maximum 2-m temperature is about 36.5°C. This temperature, however, is for 2 m above the model tree canopy, rather than above the ground and below the tree canopy. This difference must be taken into account in forecasts for heavily forested areas.
- During the late afternoon through the following night:
- decoupling of the surface from the atmosphere (when skin/canopy temperature becomes lower than 995-hPa air temperature) begins just after 00 UTC/1800 local time, about the same time as in the grassy case.
- skin/canopy temperatures are consistently 3.5° to 5°C below the 995-hPa temperature after 01 UTC/1900 local time and drive the development of the nighttime stable boundary layer through surface contact cooling.
- 2-m dewpoints are 2° to 3°C lower in the tree case than in the grass case.
- the minimum 2-m temperature is about 25°C, compared to 24°C in the grass case. Again, remember that the model 2-m temperature is for 2 m above the top of the forest canopy, rather than 2 m above the ground.
* Vegetation Type: Question
Question
You are the lead forecaster for your field office on a summertime day shift in the year 2005. The vegetation type database for the operational forecast models is from a land-use analysis done in 1980, in which your forecast area was designated as part of a 150- x 150-km grid box of deciduous forest. The area has undergone considerable cultivation, particularly in the last five years. It is now estimated that 60% of the area is used for cultivation, while 40% remains forested. While the new (2005) model's horizontal resolution is 15 times better than that used in 1980 (10 x 10 km), the vegetation type emulated in your area is still all deciduous forest. (The vegetation types are still based on the 1980 land-use analysis.)
The cultivated regions are in an active growing phase with large amounts of vegetation coverage and evapotranspiration on the day of the forecast. Since precipitation has been close to normal for the last several months, soil moisture levels are moderate. The new model still uses a simple emulation scheme for vegetation, which assumes that the trees are the model skin surface and with no forest sub-canopy processes.
How, if at all, would you adjust the model prediction of the following parameters in your forecast area? (Use the selection boxes to choose the best answer.)
Discussion
The key is the model error in vegetation type and its effect on the amount of available water to remove from the soil. The resulting behavior is similar to the difference between surface and PBL behavior between moderate and dry soils. Since grass transpires more than trees for the same volume of soil moisture, one can expect more solar radiation to be used for evaporation in reality than in the model. Therefore, actual maximum temperatures should be less than predicted. Given a similar scenario to that found in the cases, a correction of a couple degrees C would be reasonable.
With cooler surface temperatures, surface-layer lapse rates will be less superadiabatic, so the depth of the actual PBL should be less than the model forecast PBL depth. If the surface roughness of trees and grass were the same, this would result in weaker surface wind speeds and turbulence within the PBL than forecast by the model. However, the larger frictional effects of the trees actually result in slightly lower near-surface winds with trees than with grass. Further up in the surface layer, the effect of mixing down stronger winds because of the warmer tree surface reverses the surface roughness effect, and winds would be higher with deciduous trees.
The model PBL RH is likely to be too low, making an upward adjustment in the layer RH necessary. In addition, since actual instability and mixing will be weaker, this will keep higher RH air from mixing to as high a vertical depth as in the model forecast, resulting in a drier layer at or above the actual PBL height than forecast.
Finally, with more grass and less trees in the forecast area of concern, the PBL will be cooler but moister. Enough additional moisture may exist for the development of diurnal convection despite a less unstable PBL. Modification of forecast or extrapolated model soundings based on the known vegetation type errors may provide the best way to assess the probability for afternoon convection.
Soil Type: Introduction
Soil type, like vegetation type, determines the:
- Amount of evapotranspiration possible through plants for a given quantity of soil moisture based on the coarseness of the soil grains.
- Albedo of the surface, which affects the amount of solar energy available for use at the surface.
- Heat conductivity of the surface, which determines the amount of surface heating that can be transported down into the deep soil layers.
Of these three impacts, the evapotranspiration effect of soils is usually the most important to the near-surface operational forecast.
The coarseness or porosity of the soil also determines two other important factors for transpiration:
- Field capacity, the soil moisture level at or above which vegetation transpires at the maximum possible rate; and
- Wilting level, the soil moisture level at or below which vegetation will not be able to transpire.
Since finer soil particles hold onto more water than coarser ones, clay type soils have higher thresholds for both field capacity and wilting level. Vegetation needs more soil moisture with clay than with sandy soil to be able to transpire at the same rate.
Soil type has direct effects on surface and boundary-layer temperatures, moisture, and other forecast variables. For these reasons, it is important to consider how models obtain the soil types used and how the effects of the soil types are emulated. This information (found for specific models in the Operational Models Encyclopedia) will help you determine whether model soil type represents your area and, if not, will help you adjust the model forecast for your location.
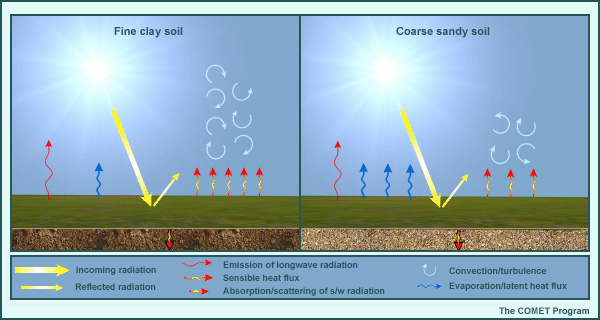
To examine potential impacts on the model forecast, two soil type cases were run using the single column model forced with real-time data from the southern Great Plains. Runs were begun at 12 UTC. Soil types used included:
- Clay loam (fine grain)
- Sandy loam (coarse grain)
All other initial conditions and forcing were left identical. A vegetation fraction of 0.7 and the same relatively small initial volume of soil moisture was assumed for each case. On the next page, we will march through a diurnal cycle for each experiment and examine the differences in the skew-T diagram, which result from varying the soil types.
Soil Type: Case Exploration
Each of the following two cases (clay loam and sandy loam) is presented through an interactive two-panel graphic (conceptual graphic and skew-T) and a table with text explanations.
On the interactive graphic, click Next Frame and Previous Frame below the skew-T to step through the times, or Play Animation to run through the entire sequence. The skew-Ts for the sandy soil case are plotted against the clay soil case for comparison. On the skew-T, the tops of the planetary boundary layer (PBL) and stable boundary layer (SBL) are marked with horizontal lines to the right of the temperature profile as they evolve. The effects of differing soil types after only one time step on the vertical temperature structure are minimal, with differences less than 1°C. Over the course of the day, they become quite significant. At the end of each case, scroll down below the table to see the diurnal cycle details of the temperatures in the surface layer.
When you have finished exploring the cases, click the next page button; you will answer a question related to the cases.
1. CLAY LOAM CASE
| Time of day | Surface Energy Balance | Temperature | Moisture | PBL | Winds |
|---|---|---|---|---|---|
|
Daytime effects |
With clay soil, more sensible heat flux, less latent heat flux/evaporation |
Strong heating, superadiabatic lapse rate below 975 hPa; max temp ~ 39.7°C |
PBL drying during the day, as PBL entrains air from above, moistening above |
Grows to maximum height of about 750 hPa |
Stronger due to downward momentum mixing |
|
Nighttime effects |
Large longwave cooling due to clear skies |
Rapid cooling as sun sets, more slowly later; min temp ~ 26.5°C |
Moisture remains in elevated mixed layer above stable layer |
Nocturnal inversion; stable layer at 50-hPa depth by sunrise |
Winds near surface calm rapidly, increase above stable layer during decoupling |
Clay Soil Case, Diurnal Cycle
The graphic shows features not visible near the surface in the skew-T diagram. They are important, however, since they indicate the instability of the surface layer and thus how strongly surface heating will drive the PBL development.
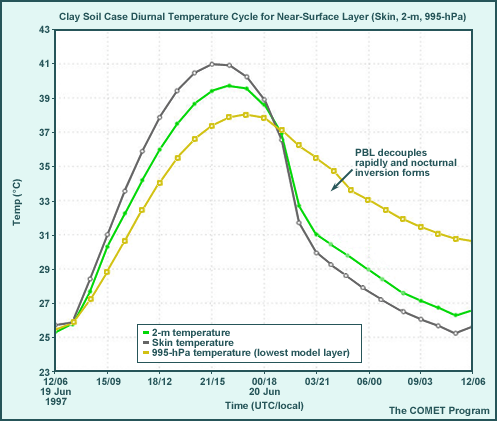
- During daylight hours:
- skin temperature is higher than 2-m and 995-hPa temperatures from 14 UTC/0800 local time to 01 UTC/1900 local time.
- the maximum 2-m temperature is 39.5°C.
- during the heat of the day, skin temperatures are 1° to 2°C higher than the 2-m air temperature, which is 1.5° to 2.5°C higher than the mean temperature of the first model layer, at 995 hPa.
- As the sun sets and night progresses:
- a surface layer inversion forms before sunset and gradually strengthens until dawn the next morning.
- skin temperatures are consistently about 1°C below the 2-m temperature after 01 UTC/1900 local time.
- the 2-m temperature is about 4° to 4.5°C lower than the 995-hPa temperature from 02 UTC/2000 local time to the following morning.
2. SANDY LOAM CASE
IMPORTANT NOTE: Coarse, sandy soils hold less soil moisture in a fixed volume than fine, clay soils. However, because of the porosity of coarse soils, surface and root zone soil moisture are more accessible to vegetation for transpiration.
| Time of day | Surface Energy Balance | Temperature | Moisture | PBL | Winds |
|---|---|---|---|---|---|
|
Daytime effects |
With sandy soil, less sensible heat flux, more latent heat flux/ evaporation |
Strong heating, superadiabatic lapse rate below 975 hPa; max temp ~ 36°C, PBL 2-3°C cooler |
Shallower PBL, moister than for clay, more evapotranspiration, less vigorous mixing out of moisture from PBL |
Grows to maximum height of about 850 hPa |
Weaker due to less downward momentum mixing than for clay |
|
Nighttime effects |
Larger longwave cooling due to clear skies than clay soil |
More rapid cooling as sun sets than clay; min temp ~ 24°C; temps generally 2-3°C cooler below 800 hPa |
More moisture below 800-hPa, less moisture from 800-650 hPa |
Nocturnal inversion; stable layer at 50-hPa depth by sunrise |
Winds near surface calm rapidly, increase above stable layer during decoupling |
Sandy Soil Case, Diurnal Cycle
The graphic shows features not visible near the surface in the skew-T diagram. They are important, however, since they indicate the instability of the surface layer and thus how strongly surface heating will drive the PBL development.
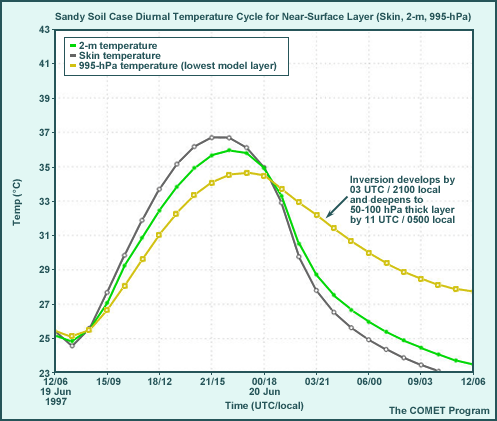
- During daylight hours:
- skin temperature takes an additional hour to increase above 2-m and 995-hPa temperatures with sandy soils than with clay soils (at 15 UTC/0900 local time) and drops below 2-m and 995-hPa temperatures an hour earlier (01 UTC/1900 local time).
- the maximum 2-m temperature is only 36°C.
- during the heat of the day, skin temperatures are only about 0.75° to 1.25°C higher than 2-m air temperatures, which are only 1.25° to 1.75°C higher than the mean temperature of the first model layer, at 995 hPa.
- As the sun sets and night progresses:
- the surface layer inversion forms earlier than with clay soils and gradually strengthens until dawn the next morning.
- the skin temperature is about 0.75° to 1.25°C less than the 2-m temperature, and the 2-m is about 3.5° to 4°C less than the 995-hPa temperature through the nighttime hours.
- 2-m and skin temperatures are about 3°C less than the clay soil case right after nocturnal inversion forms; this difference remains approximately constant through the night.
Soil Type: Question
Question
You are the lead forecaster for your field office on a summertime day shift. You have a soil type map for your region based on recent land use and soil analysis data, which shows your region to consist mostly of fine-grained clay soil. The models show that the model soil type for your area is mostly sandy loam, a coarse-grained soil. Other than the soil type difference, all other surface parameters, including vegetation type and amount, seem to be representative of your area, and soil moisture levels are identical and moderate. The region for which you forecast is in the center of a typical summer continental polar air mass.
How, if at all, would you adjust the model prediction of the following parameters in your forecast area? (Use the selection boxes to choose the best answer.)
Discussion
The model error in soil type will affect the amount of water available for evapotranspiration from the sub-surface soil layers through the vegetation. Clay soils are harder for vegetation to draw water from for the same amount of soil moisture. The resulting behavior is similar to the different effects that dry and moderately moist soils have on surface and PBL behavior. Since the actual clay soils allow less evapotranspiration for the same soil moisture volume than the model's sandy soils, one can expect more solar radiation to be used for sensible heating of the surface than indicated by the model. Therefore, actual maximum temperatures should be greater than predicted. Given a similar scenario to that found in the examples, a correction of a couple degrees C would be reasonable.
Warmer surfaces will produce steeper near-surface lapse rates, so the actual depth of the PBL will be expected to be more than the model forecast PBL depth. This will also result in stronger surface wind speeds and turbulence within the PBL than forecast by the model.
Because there is more evapotranspiration in the model than will take place in reality, the model PBL RH is likely to be too high so forecast PBL RH should be decreased. In addition, since actual instability and mixing will be stronger, this will mix higher RH air further upward into the troposphere, resulting in more moisture above the model PBL than forecast.
Soil Moisture: Introduction
Amount of soil moisture in an operational forecast model affects:
- partitioning of model's incoming solar energy into surface heating and surface evaporation
- the amount of water available for evaporation through model vegetation (evapotranspiration) and from the surface soil layer
The effect of soil moisture levels is also modulated by:
- the vegetation type and vegetation amount emulated in the model;
- the amount of incoming solar energy available at the surface, which in turn is affected by:
- model surface albedo;
- cloudiness;
- solar angle (and thus time of day and time of year).
Model soil moisture amount and its modulators have direct effects on surface and boundary-layer temperatures, moisture, and other forecast variables. For these reasons, it is important to consider how models obtain their initial and forecasted soil moisture conditions, how other aspects of model surface physics are emulated, and how all these can together affect a forecast. This information (found for specific models in the Operational Models Encyclopedia) will help you determine whether the soil conditions in the model you are using represent actual soil conditions and will provide clues on how to adjust the model forecast for your location.
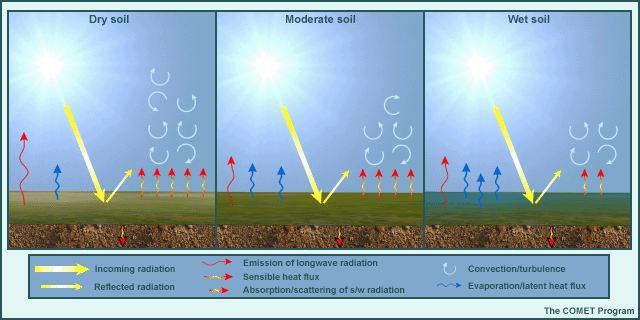
To examine potential impacts on the model forecast, three soil moisture cases were run using the single column model forced with observed research data from the southern Great Plains. Runs were begun at 0600 local time/12 UTC. The only initial condition that was changed was the amount of moisture in the soil; all other initial conditions and forcing were left identical.
On the next page, we will march through a diurnal cycle for each experiment and examine the differences in the skew-T diagram that result from varying the initial soil moisture values.
Soil Moisture: Case Exploration
Each of the following three cases (dry, moderate, and wet soil) is presented through an interactive two-panel graphic (conceptual graphic and skew-T) and a table with text explanations.
On the interactive graphic, click Next Frame and Previous Frame below the skew-T to step through the times, or Play Animation to run through the entire sequence. The skew-Ts for the dry and wet cases are both plotted against the moderate case for comparison. On the skew-T, the tops of the planetary boundary layer (PBL) and stable boundary layer (SBL) are marked with horizontal lines to the right of the temperature profile as they evolve. The effects of differing soil conditions on the vertical temperature structure are minimal after less than one hour, with differences less than 1°C. As the day progresses, however, differences among the cases become quite significant. At the end of each case, scroll down below the table to see the diurnal cycle details of the temperatures in the surface layer.
When you have finished exploring all three cases, click the next page button; you will answer a question related to the cases.
1. DRY SOIL MOISTURE
| Time of day | Surface Energy Balance | Temperature | Moisture | PBL | Winds |
|---|---|---|---|---|---|
|
Daytime effects |
With dry soil, more sensible heat flux, less latent heat flux/ evaporation |
Strong heating, superadiabatic lapse rate below 975 hPa; max temp ~ 39.5°C, CAPE = 2200 J |
PBL drys during the day, as PBL entrains air from above, moistening above PBL |
Grows to maximum height of about 750 hPa |
Stronger due to downward momentum mixing |
|
Nighttime effects |
Large longwave cooling due to clear skies |
Rapid cooling as sun sets, more slowly later; min temp ~ 27.2°C |
Moisture remains in elevated mixed layer (770-650 hPa) |
Nocturnal inversion; stable layer at 50-hPa depth by sunrise |
Winds near surface calm rapidly, increase above stable layer during decoupling |
Dry Soil Moisture Case, Diurnal Cycle
The graphic shows features near the surface that are not easily seen in the skew-T diagram. They are important, however, since they indicate surface layer instability and thus how strongly surface heating will drive PBL development.
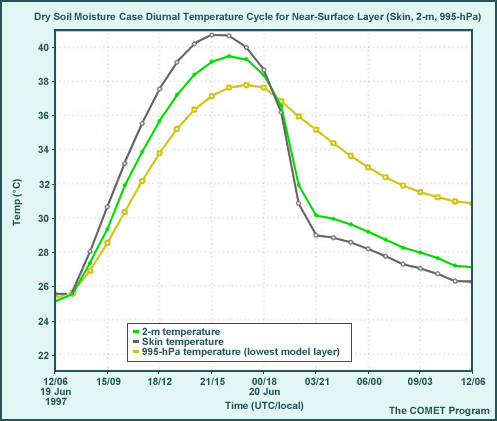
- Morning to mid-afternoon:
- The superadiabatic skin-to-995-hPa temperature gradient develops by 0800 local time (14 UTC), one hour earlier than in the moderate soil moisture case.
- The skin-to-995-hPa temperature gradient is as much as 4° at local noon to 1400 local time (20 UTC), compared to 3°C in the moderate soil moisture case.
- The maximum shelter (2-m) temperature is over 39°C, compared to 37°C in the moderate case.
- Mid-afternoon to dawn the next day:
- The skin-to-995-hPa temperature gradient reverses at 1900 local time (01 UTC), about one half hour later than in the moderate case.
- A temperature inversion develops rapidly between 1900 and 2100 local time (01 to 03 UTC), when it reaches almost 6°C, compared to 5.5°C in the moderate case.
- Skin temperatures are consistently 5° to 6°C below the 995-hPa temperatures after 02 UTC/2000 local time until dawn the next morning, about the same as in the moderate case.
- The minimum shelter (2-m) temperature is 27°C, compared to 25°C in the
moderate case.
- Because of drier near-surface dewpoints, dew is generally less likely to form in the dry soil case than in the moderate soil case.
2. MODERATE SOIL MOISTURE CASE
| Time of day | Surface Energy Balance | Temperature | Moisture | PBL | Winds |
|---|---|---|---|---|---|
|
Daytime effects |
With moderately moist soil, less sensible heat flux, more latent heat flux/ evaporation |
Less strong heating, but still superadiabatic lapse rate near surface; max temp ~ 37.2°C, CAPE = 2889 J, more than dry soil case |
PBL drys during the day, as PBL entrains air from above (but less than dry case), moistening above PBL |
Grows to maximum height of about 800 hPa |
Less strong than dry case, due to less downward momentum mixing |
|
Nighttime effects |
Large longwave cooling due to clear skies |
Rapid cooling as sun sets, more slowly later; min temp ~ 27.2°C |
Moisture remains in elevated mixed layer (centered around 800 hPa) |
Nocturnal inversion; stable layer at 50-hPa depth by sunrise |
Winds near surface calm rapidly, increase above stable layer during decoupling |
Moderate Soil Moisture Case, Diurnal Cycle
The graphic shows features not visible near the surface in the skew-T diagram. They are important, however, since they indicate surface layer instability and thus how strongly surface heating will drive PBL development.
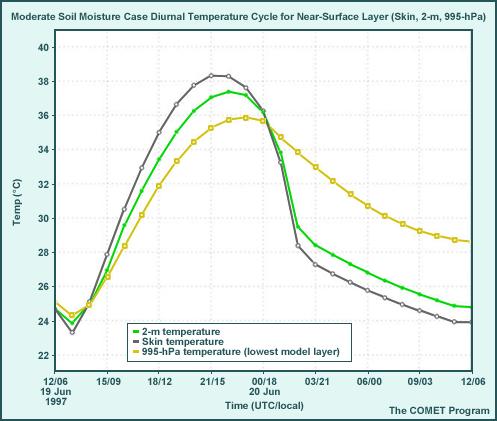
- From dawn until mid-afternoon:
- The superadiabatic skin-to-995-hPa temperature gradient becomes evident at 0900
local time (15 UTC). This gradient drives the model mixed layer PBL development.
- The skin-to-995-hPa temperature gradient maximum is 3° to 3.5°C between 1100 local time (17 UTC) and 1500 local time (21 UTC).
- The maximum shelter (2-m) temperature is only slightly over 37°
- The superadiabatic skin-to-995-hPa temperature gradient becomes evident at 0900
local time (15 UTC). This gradient drives the model mixed layer PBL development.
- From mid-afternoon through the following night:
- The skin-to-995-hPa temperature gradient decreases until it reverses sign after 1800 local time (00 UTC).
- A nocturnal inversion develops rapidly after 1800 local time (01 UTC) until 2100 local time, reaching 5.5°C at that time.
- The skin-to-995 hPa temperature inversion remains at 5° to 5.5°C for the remainder of the night.
- The minimum shelter (2-m) air temperatures is about 25°C
3. WET SOIL MOISTURE
| Time of day | Surface Energy Balance | Temperature | Moisture | PBL | Winds |
|---|---|---|---|---|---|
|
Daytime effects |
With wet soil, least sensible heat flux, most latent heat flux/ evaporation |
Weakest heating, only briefly superadiabatic; max temp ~ 32°C, CAPE = 5223 J! |
PBL moistens during the day, as evapotranspiration fills the shallow PBL with moisture, drier than other cases above PBL |
Grows to maximum height of about 870 hPa (lowest of three cases) |
Weakest due to lowest downward momentum mixing |
|
Nighttime effects |
Smaller longwave cooling due to greater moisture, higher heat capacity of moist soil. |
Less rapid cooling as sun sets than in other cases; min temp ~ 23.8°C, coolest of three cases |
Drier than other cases between 850-700 hPa, moister below |
Nocturnal inversion; stable layer at 50-hPa depth by sunrise |
Winds near surface calm rapidly, increase above stable layer during decoupling |
Wet Soil Moisture Case, Diurnal Cycle
The graphic shows features not visible near the surface in the skew-T diagram. They are important, however, since they indicate surface layer instability and thus how strongly surface heating will drive the PBL development.
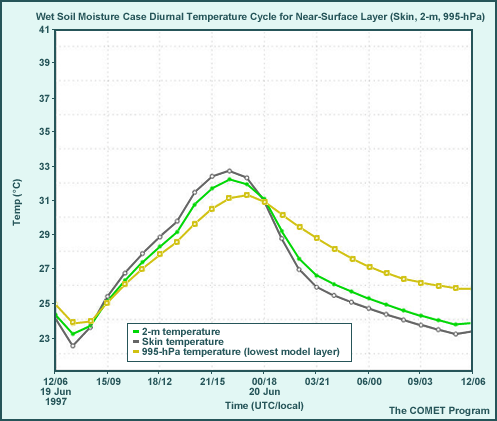
- From dawn until mid-afternoon:
- The skin-to-995-hPa temperature gradient becomes evident by 0900 local time (15 UTC), one hour later than in the moderate soil moisture case, and does not become superadiabatic until 1100 local time (17 UTC).
- The skin-to-995-hPa temperature gradient, though still superadiabatic, is only 1°C at local noon, with a maximum of 2°C by mid-afternoon local time.
- The maximum shelter (2-m) temperature is only slightly over 32°C, but dewpoints are 4° to 5°C higher than in the moderate case.
- From mid-afternoon to dawn the next day:
- The skin-to-995-hPa temperature gradient reverses between 1700 and 1800 local time (23 to 00 UTC).
- Skin temperatures are only about 2° to 3°C below the 995-hPa temperature after 01 UTC/1900 local time until dawn the next morning.
- 2-m and skin temperatures cool less quickly for the wet soil case than in the other two cases as a result of some low cloud and moisture, so that by dawn the next morning, the wet case is only about 0.5°C cooler than the moderate case and 2°C cooler than the dry soil case.
Soil Moisture: Question
Question
You are the lead forecaster for your field office on a summertime day shift. Over the past few days, the forecast models have been predicting significant rainfall over your area, but the rainfall has not materialized. The model uses its own precipitation forecast to update the model soil moisture fields. This morning's model forecast indicates clear weather and light winds through much of the day, followed by the development of scattered showers and thunderstorms.
How, if at all, would you adjust the model prediction of the following parameters in your forecast area? (Use the selection boxes to choose the best answer.)
Discussion
Soil moisture errors may result from earlier precipitation (and evaporation) errors in the forecast model, when the model uses its own forecast of precipitation and evaporation to calculate its soil moisture fields. Additional errors in soil moisture may also result from precipitation and evaporation errors that occur as the forecast evolves. These will affect subsequent forecast periods in similar ways to how initial soil moisture errors affect the first few periods of a forecast. Horizontal positioning of soil moisture errors upstream, within, and immediately downstream of the forecast area should also be taken into account in developing the forecast, as these may affect the creation of local moisture and temperature discontinuities on which significant weather may develop.
In this particular case, as a result of the precipitation and evaporation errors resulting from the erroneous precipitation forecast of previous days, the model initial conditions will likely contain moderate to wet soil conditions when actual conditions are likely to be closer to the dry scenario. The model maximum temperature forecast is likely to be too cool as a large portion of the model's incoming solar radiation will be used to evaporate the model's excess soil moisture. However, the amount of temperature error is dependent upon the actual amount of moisture present in the soil.
With actual soil conditions much drier than model soil conditions, PBL depth will be significantly deeper than the model forecast PBL depth due to increased surface heating and turbulent mixing. This will also result in stronger surface wind speeds and turbulence within the PBL than forecast by the model.
The model PBL RH is likely to be too high so a downward adjustment in the layer RH is necessary. In addition, since actual instability and mixing will be stronger, this will allow slightly higher RH to be mixed to greater vertical depths than the model forecast, resulting in a slightly moister layer at or above the actual PBL height.
Finally, with drier soil conditions, insufficient PBL moisture may exist for the development of diurnal convection despite an unstable PBL. Assuming no moisture advection, any in-situ moisture will be mixed through a deeper layer and may not result in sufficient saturation for cloud and shower formation. The best way to assess the effect of drier than forecast soils on forecasts of diurnal convection is to modify the projected sounding to correct for the soil moisture error, assess the CAPE and other instability measures, and then develop a modified convection forecast.
Summary of Impacts
Cloud Cover & Atmospheric Moisture
The tables in this section outline the impacts of various physics parameters on the model guidance for several variables commonly used in operational forecasts. Information is also presented on how to adjust for model forecast errors and biases caused by these physics errors. The information describes general issues to be aware of and ways to treat them when developing your forecasts. It is also important to remember that in making a forecast, you should consider how different physics parameter errors might amplify or offset each other.
The tables are divided into two primary physical processes that NWP models must emulate: atmospheric radiation and surface processes. The effects of both radiation and surface emulation errors on turbulent processes are covered throughout.
|
ATMOSPHERIC RADIATION: CLOUD COVER |
|
|---|---|
|
IMPACTS/CAUSES OF ERRORS |
CORRECTION TO MODEL FORECAST |
|
Advection of cloud water errors
|
Model has too much cloudiness at the forecast location
Model has too little cloudiness at the forecast location
|
|
ATMOSPHERIC RADIATION: ATMOSPHERIC MOISTURE (RH) |
|
|---|---|
|
IMPACTS/CAUSES OF ERRORS |
CORRECTION TO MODEL FORECAST |
|
Model too moist
Model too dry
Note that impacts will be greater at night when longwave processes dominate. |
Surface Processes: Surface Albedo
|
SURFACE PROCESSES: SURFACE ALBEDO |
|
|---|---|
|
IMPACTS/CAUSES OF ERRORS |
CORRECTION TO MODEL FORECAST |
|
Model albedo too high (for example, model snow cover where none exists)
Albedo too low (for example, no model snow, but actual snow exists)
|
Surface Processes: Soil Moisture
|
SURFACE SOIL LAYER MOISTURE & MOISTURE |
|
|---|---|
|
Model has too much moisture
Model has too little moisture
|
|
SUB-SURFACE (ROOT ZONE) SOIL LAYERS |
|
|---|---|
|
IMPACTS/CAUSES OF ERRORS |
CORRECTION TO MODEL FORECAST |
|
|
Surface Processes: Vegetation
|
SURFACE PROCESSES: VEGETATION TYPE |
|
|---|---|
|
IMPACTS/CAUSES OF ERRORS |
CORRECTION TO MODEL FORECAST |
|
|
|
SURFACE PROCESSES: VEGETATION FRACTION |
|
|---|---|
|
IMPACTS/CAUSES OF ERRORS |
CORRECTION TO MODEL FORECAST |
|
Actual vegetation fraction larger than modeled
Actual vegetation fraction less than modeled
|
Surface Processes: Water Surfaces
|
SURFACE PROCESSES: WATER SURFACES |
|
|---|---|
|
IMPACTS/CAUSES OF ERRORS |
CORRECTION TO MODEL FORECAST |
|
Over ocean
Inland water bodies (lakes and inland seas)
|
Ocean effects (generally larger at higher SSTs)
|
Exercises
Effect of Soil Moisture Tuning on Forecast Variables
Because of computational constraints and an incomplete understanding of how some physical processes work, modelers must determine values for parameters that will work best in the majority of weather situations. On this and the next three pages, we'll look at the effect of specific parameter tunings on forecast variables.
Question
If soil moisture were tuned as indicated below, what forecast errors would likely result for model 2-m temperature, 2-m RH, PBL height, and the chance of convective precipitation? (Use the selection boxes to choose the best answer.)
Discussion
We would expect the model soil to be too dry. Drier soils result in more incoming solar energy being used in sensible heating of the model surface, resulting in model skin and 2-m temperatures that are too high. Specific humidity will also be too low, so with too high 2-m temperatures, RH will be too low as well. PBL depth is determined in part by the temperature gradient near the surface. With the model skin and 2-m temperatures too high, the model's vertical temperature gradient in the surface layer will be too large and the model PBL will grow too deep.
Under sunny, warm, and humid conditions, the wetter soil condition in the real atmosphere will increase the moisture in the PBL even with PBL temperatures too low. Whether or not that will increase the risk of convective precipitation can only be determined by taking the model forecast skew-T, adjusting it for anticipated errors, and then reassessing the CAPE and CIN.
* Effect of Vegetation Fraction Tuning on Forecast Variables
Question
If vegetation fraction were tuned as indicated below, what forecast errors would likely result for model 2-m temperature, 2-m RH, PBL height, and the chance of convective precipitation? (Use the selection boxes to choose the best answer.)
Discussion
This scenario presents a mixed picture. If the actual spring green-up is late, the vegetation fraction will be too high in the model. This acts in a similar way to model soils being too wet and results in model 2-m temperatures that are too low, model RHs that are too high, and model PBLs that are too shallow, all else being equal. However, we also know that the model's surface soil layer is too dry, which has the opposite effect. As a result, we cannot determine whether the model forecast will be in error, and if so, what the error might be. Such conflicting signals are not unusual in operational forecasting. To evaluate model performance in such situations, it is best to look to recent trends in model forecast errors to gain insight as to how to correct the model forecast.
Effect of Snow Cover Tuning on Forecast Variables
Question
If snow cover were tuned as indicated below, what forecast errors would likely result for model 2-m temperature, 2-m RH, PBL height, and the chance of convective precipitation? (Use the selection boxes to choose the best answer.)
Discussion
This scenario is primarily influenced by model prescribed surface errors. You would anticipate that 2" of snow would melt within a few hours during a major thawing event while the model retains the snow throughout the period. This results in too little incoming shortwave radiation being available for surface processes in the model (through albedo errors) and also serious skin temperature errors because the model skin temperature is forced to remain at 0°C. Therefore, the model 2-m temperature will be too low. Snow is treated as a water surface until melted, so specific humidity will be too high, causing RH to be too high as well. Near-surface temperature gradients will be too small, causing the model PBL to be too shallow.
Finally, if there were a chance of convection, the cool PBL and near-surface temperatures would strongly inhibit its development in the operational model. But a caveat: some convective parameterizations may search for unstable parcels above the low-level inversion created by the snow cover, so this effect may vary with the parameterization.
* Effect of Land Use Tuning on Forecast Variables
Question
If land use were tuned as indicated below, what forecast errors would likely result for model 2-m temperature, 2-m RH, PBL height, and the chance of convective precipitation? (Use the selection boxes to choose the best answer.)
Discussion
This scenario is primarily influenced by sub-grid scale surface variability. Paved surfaces, such as those found in urban regions, do not hold water. Subsurface water cannot easily evapotranspire because of the relative lack of vegetation. If a model has vegetation in a grid square where there is actually an embedded urban area, the model results will be similar to having too much soil moisture and vegetation fraction. Therefore, we would expect too much incoming energy to be used for evaporation where in reality it should go into sensible heating. This results in model 2-m temperatures that are too low. Because of the excess evaporation, the model specific humidity (and thus RH) will be too high. Vegetation surfaces heat less rapidly than urban surfaces, so the model near-surface temperature gradients will be too small. The resulting model PBL will be too shallow. The chance of convective precipitation over the forecast area is not so simple to determine, as sub-grid scale variability can actually enhance the probability of convection by providing differential heating within a grid square that is not emulated in the operational models. The best answer is that the probability of convection cannot be determined with the data given.
* Relative Importance of Physics versus Dynamics
Question
For each situation listed below, what is likely to be most important in determining the 2-m air temperature during the next 12 hours: physics (changes in individual parcel temperatures), dynamics (advection of parcels with different temperatures), or both? All situations are for daytime and mid-latitude locations unless stated otherwise. (Use the selection boxes to choose the best answer.)
As you review the situations, consider the following:
- Are horizontal temperature gradients and/or winds strong? Is the dynamics term
in the temperature tendency equation important?

- Will the skin temperature be similar to or different from the overlying air?
- Will there be significant impacts on radiation from atmospheric (clouds, moisture) and/or ground (albedo) conditions?
- Will there be other significant diabatic (heat added or removed) processes taking place during the next 12 hours?
Discussion
Physics dominates for the situations described in (a), (d), and (f).
Center of polar air mass during January (a): In the center of a polar air mass during January (and actually in the center of any air mass during any season), winds and temperature gradients are weak to non-existent. Since dynamics are so weak, physics are more important, even when the sun angle is relatively low.
Region around an occluded cyclone in October (d): While the winds might be strong, the temperature gradients will be weak, and so the effect of dynamics on the 2-m temperature will be small. Clouds will reduce incoming solar radiation (physics), which will have a larger impact on the 2-m temperature.
Area of southerly flow over land to the west of the Bermuda High in July (f): This region is typically marked by small to non-existent temperature gradients, so that regardless of the wind velocity, the dynamical forcing of the 2-m temperature is weak to nil. The local 2-m temperature will be determined mostly by the amount of soil moisture in the ground and the amount of radiation reaching the ground through any cloudiness that might exist.
Dynamics dominates for the situation described in (c).
Arctic front to pass your location in the next two hours in February (c): This is the only clear-cut case where dynamics dominates the 2-m air temperature. Both winds and temperature gradients will be strong over the next 12 hours.
Both physics and dynamics are important for the situations described in (b), (e), (g), and (h).
Overrunning area north of a warm front in April (b): The warm frontal approach indicates that the advection of warmer air should affect the 2-m temperature. However, evaporative cooling (physics) in the overrunning region should also play an important role in determining the 2-m temperature as precipitation commences in the overrunning region.
Area of already established cold-air damming east of mountains in December, as low pressure begins to approach (e): Both physics and dynamics are important. Dynamics determines the track of the low, and causes lift for precipitation. Evaporation of this falling precipitation and the presence of clouds as low pressure approaches (physics) is important in maintaining the cold air wedge east of the mountains and will usually be a more important determinant of the 2-m air temperature than advection in an already established near-surface air mass, since most of the warm advection will occur aloft.
Warm, moist air mass moving into an area of snow-covered ground in January (g) and area downwind of a large body of water with a cold, dry air mass flowing in during November (h): Both physics and dynamics are important in situations such as these, where air masses pass over surfaces with very different temperatures. Both of these situations are typical events in the cold season.
* Interaction Among Physics Emulations & Dynamics
Question
As is evident throughout these discussions, the individual physics components do not act in isolation. Rather, they act and interact with each other and with the model precipitation emulation and dynamics in very complex and non-linear ways. The following question tests your ability to put the pieces together in a scenario loosely based on an observed situation that took place during a recent summer drought.
Excessive rainfall observed for the previous 30 days over an area of the western Great Lakes and upper Midwest has lead to the approximate actual soil moisture pattern shown for 1 July. From the graphic, it is apparent that a very strong soil moisture gradient exists across the region, ranging from wet and very wet (light and dark green areas) to dry and very dry (light to dark orange) relative to the climatological soil moisture in those regions.
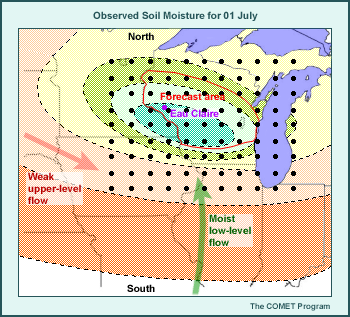
A moderate southerly to southwesterly low-level flow of hot, humid air is expected over the area for the next five days. The upper airflow with a building ridge over and south of the region will be relatively weak and from the west and northwest. An approximate 0.5° x 0.5° grid from an operational forecast model in use at the time has been superimposed on part of the map to give a sense of the horizontal scale of the soil moisture anomaly relative to the model resolution. While the model has a land surface model with multiple soil layers, it also nudges the soil moisture forecast toward climatology. This leads to moister model soils in the dry region and drier model soils in the moist region than shown in the graphic.
Assume you are lead forecaster for a hypothetical WFO in Eau Claire, WI and are developing the forecast for your area shown by the area enclosed by the light red line. Based on your knowledge of the actual soil moisture conditions and the model's representation of soil moisture, how would you adjust the model guidance to produce your temperature and precipitation forecasts for the next five days? (Use the selection boxes to choose the best answer.)
Discussion
This is a case where physics and dynamics work together to reinforce an existing precipitation and temperature regime. The forecast model is unable to completely capture the interactions that take place.
First the physics: The maximum temperatures over central Wisconsin are likely to be lower than model forecasts indicate because the higher than initialized soil moisture values will result in higher evaporation rates and thus cooler PBL temperatures than in the model forecast. Because soil moisture changes only slowly over time due to the deep layer of subsurface moisture, these temperature anomalies might persist for an extended period.
Dynamics/physics interplay: The south to southwest low-level flow of hot, humid air will move perpendicular to the soil moisture gradient. In the model, both the coarse resolution and the reduced soil moisture gradient will likely underestimate the north-south temperature gradient. In reality, the stronger north-south soil moisture gradient will result in a stronger temperature gradient than will appear in the operational forecast model. This stronger gradient will be a more significant temperature discontinuity boundary and will provide a focus for lifting of the hot, humid air as it flows north over the cooler land. In this scenario convection would be more likely to form along the temperature discontinuity boundary and progress northward along the flow. Also, since surface dryness to the south of the forecast area is underforecast, less convection might be expected in that area than may be indicated by the model, and thus more moisture should be available to fuel convection in the moister area to the north, which includes the forecast area. As a result, model forecast precipitation probability should be increased as well, especially to the south in the area of antecedent precipitation. The soil moisture 'front' will act as a 'lifting mechanism' for the southerly flow. To the south and north of the area of enhanced lifting, the precipitation probability would be less.
* References
Liou, K. N., 1992: Radiation and Cloud Processes in the Atmosphere: Theory, Observation and Modeling. Oxford University Press, 504 pp
Sellers, P. J., 1993: Biophysical models of land surface processes. Climate System Modeling, Kevin Trenberth, Ed., Cambridge University Press, 451-490.
Sellers, P. J., Y. Mintz, Y. C. Sud, and A. Dalcher, 1986: A simple biosphere model (SiB) for use within general circulation models. J. Atmos. Sci., 43, 505-531.
Stull, Roland B., 1993: An Introduction to Boundary Layer Meteorology. Kluwer Academic Publishers, 666 pp.
Single column model: Colorado State University, cited 2009. Single Column Modeling Home Page, available online from http://kiwi.atmos.colostate.edu/scm/scm.html.
Contributors
COMET Sponsors
The COMET® Program is sponsored by NOAA National Weather Service (NWS), with additional funding by:
- Air Force Weather (AFW)
- Australian Bureau of Meteorology (BoM)
- European Organisation for the Exploitation of Meteorological Satellites (EUMETSAT)
- Meteorological Service of Canada (MSC)
- National Environmental Education Foundation (NEEF)
- National Polar-orbiting Operational Environmental Satellite System (NPOESS)
- NOAA National Environmental Satellite, Data and Information Service (NESDIS)
- Naval Meteorology and Oceanography Command (NMOC)
Project Contributors
Principle Science Advisors
- Dr. Ralph Petersen — NOAA/NCEP/EMC (retired)
- Dr. William Bua — UCAR/COMET
- Dr. Stephen Jascourt — UCAR/COMET
Senior Project Manager
- Dr. Gregory Byrd — UCAR/COMET
Project Leads
- Dr. William Bua — UCAR/COMET
- Dr. Stephen Jascourt — UCAR/COMET
Instructional Design
- Bryan Guarente — UCAR/COMET
- Tsvetomir Ross-Lazarov — UCAR/COMET
Graphics/Interface Design
- Steve Deyo — UCAR/COMET
- Brannan McGill — UCAR/COMET
- Heidi Godsil — UCAR/COMET
Multimedia Authoring
- Bruce Muller— UCAR/COMET
- David Russi — UCAR/COMET
COMET HTML Integration Team 2020
- Tim Alberta — Project Manager
- Dolores Kiessling — Project Lead
- Steve Deyo — Graphic Artist
- Gary Pacheco — Lead Web Developer
- Justin Richling — Web Developer
- David Russi — Translations
- Gretchen Throop Williams — Web Developer
- Tyler Winstead — Web Developer
COMET Staff, October 2009
Director
- Dr. Timothy Spangler
Deputy Director
- Dr. Joe Lamos
Administration
- Elizabeth Lessard, Administration and Business Manager
- Lorrie Alberta
- Michelle Harrison
- Hildy Kane
Hardware/Software Support and Programming
- Tim Alberta, Group Manager
- Bob Bubon
- James Hamm
- Ken Kim
- Mark Mulholland
- Wade Pentz, Student
- Jay Shollenberger, Student
- Malte Winkler
Instructional Designers
- Dr. Patrick Parrish, Senior Project Manager
- Dr. Alan Bol
- Lon Goldstein
- Bryan Guarente
- Dr. Vickie Johnson
- Tsvetomir Ross-Lazarov
- Marianne Weingroff
Media Production Group
- Bruce Muller, Group Manager
- Steve Deyo
- Seth Lamos
- Brannan McGill
- Dan Riter
- Carl Whitehurst
Meteorologists/Scientists
- Dr. Greg Byrd, Senior Project Manager
- Wendy Schreiber-Abshire, Senior Project Manager
- Dr. William Bua
- Patrick Dills
- Dr. Stephen Jascourt
- Matthew Kelsch
- Dolores Kiessling
- Dr. Arlene Laing
- Dr. Elizabeth Mulvihill Page
- Amy Stevermer
- Warren Rodie
- Dr. Doug Wesley
Science Writer
- Jennifer Frazer
Spanish Translations
- David Russi
NOAA/National Weather Service - Forecast Decision Training Branch
- Anthony Mostek, Branch Chief
- Dr. Richard Koehler, Hydrology Training Lead
- Brian Motta, IFPS Training
- Dr. Robert Rozumalski, SOO Science and Training Resource (SOO/STRC) Coordinator
- Ross Van Til, Meteorologist
- Shannon White, AWIPS Training
Meteorological Service of Canada Visiting Meteorologists
- Phil Chadwick
- Jim Murtha