Media elements used in this module are protected by a variety of copyright licenses. Please use the "copyright terms" link associated with each item below for more information.
Description:
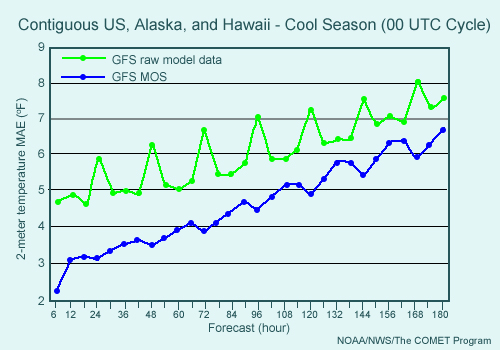
Contiguous US, Alaska and Hawaii 2-meter temperature mean average error (MAE, degrees Fahrenheit), for forecast lead times from 6 to 180 hours at 6-hour intervals, for the NCEP GFS versus GFS MOS), 1-19 Dec. 2006 and 1-15 Mar. 2007. GFS MOS 2-m temperature in blue and GFS direct model output of 2-m temperature in green.
File Name:
maegrphic2007.jpg
Credits:
NOAA/NWS/The COMET Program
Copyright Terms:
COMET Standard Terms of Use
Description:
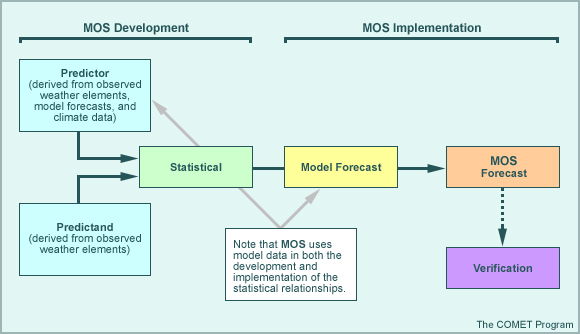
Diagram of how Model Output Statistics or MOS is developed and then implemented. A predictor (derived from observations, model forecasts, and/or climate data) is compared to a predictand (an observation of a variable that we want to predict) to develop a statistical forecast for that predictand. MOS uses model data both in the development and implementation of the statistical relationships, and this is the difference between it and perfect prog methods.
File Name:
mosgraph.jpg
Credits:
The COMET Program
Copyright Terms:
COMET Standard Terms of Use
Description:
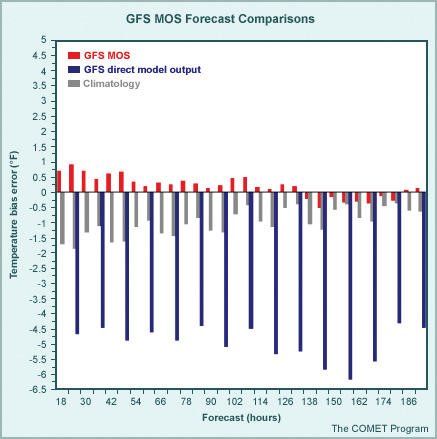
Hypothetical forecast from GFS MOS, GFS direct model output, and climatology for 2-meter temperature bias error at 6 hour intervals from 18 to 192 hours. Direct model output exhibits a strong cold bias of 4-6 degrees Fahrenheit, climatology a generally decreasing cold bias over time, and the MOS a decreasing warm bias trending to cold after about 132 hours. Increased climatology weighting at longer MOS forecast lead times is the reason for the MOS error trend.
File Name:
mrfmos.jpg
Credits:
The COMET Program
Copyright Terms:
COMET Standard Terms of Use
Description:
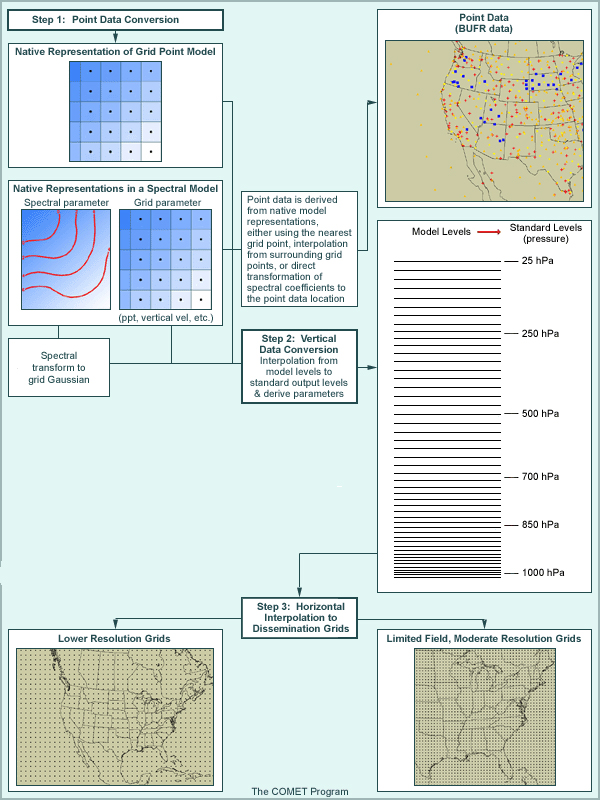
Graphic shows the method by which native horizontal and vertical grid model data is converted into usable forecast grids. For postprocessing at a station, either a nearest neighbor or interpolation to the location of the station is done, and then the results are vertically interpolated to pressure or geopotential levels. If forecast data is spectral, conversion to the station location is done first.
For postprocessed grids, interpolation from the native vertical coordinate to a more useful vertical coordinate (pressure or geopotential height) and vertical grid takes place first. If original data is from a spectral model, it is converted (as with station data) to a grid appropriate to its spectral resolution first. Then the data is interpolated horizontally from its native horizontal grid to one coarse enough that it can be disseminated to end-users in a timely manner.
File Name:
pprocess.jpg
Credits:
The COMET Program
Copyright Terms:
COMET Standard Terms of Use