Introduction to Ensemble Prediction
Any forecaster working with numerical weather prediction (NWP) output quickly becomes aware of the differences between models. These are more pronounced for high-impact events, as we see in the runs from several models below.
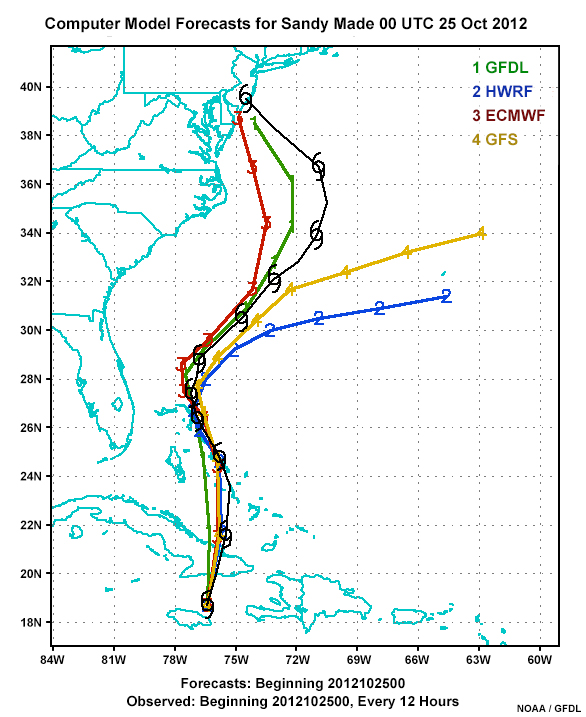
The forecast cyclone tracks are from four commonly used deterministic models. These models are run a single time from a single established set of initial conditions. The outcomes can vary, as in our example. Two models are predicting landfall while the other two show tracks going out to sea. Differences like this can occur for consecutive runs from a single deterministic model or from multiple deterministic models.
What causes the variability? Many factors are at play, notably differences in the models’ initial conditions, how they parameterize complex processes, their underlying physical approximations, their grid spacing, and the atmosphere’s inherent chaotic behavior over time.
While differences in model output may initially seem confusing and difficult to use in a forecasting process, they can be harnessed to help forecasters estimate uncertainty in predicted weather conditions and communicate that uncertainty to end users.
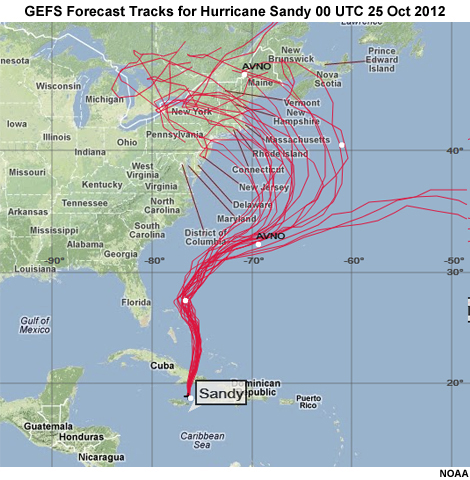
Improvements in modeling and computing time have enabled modelers to make slight changes to a model’s initial conditions, physics, parameterizations, or grid spacing, and run the model again to see the outcome. Doing this multiple times produces an ensemble of possible forecast outcomes, like those shown here from the Global Ensemble Forecast System (GEFS) for Hurricane Sandy. Note that some ensembles combine the results from several models, each of which is run multiple times with different conditions.
Ensemble Prediction System (EPS) output allows forecasters to use probabilistic forecast information, which better represents the state of the science, in their forecasts. Forecasters can also provide the probabilistic information and uncertainty estimates to a variety of customers, the majority of whom prefer it to single value deterministic information.
Typically, an EPS produces more data than can reasonably be integrated into most operational forecasting settings. Therefore, EPS products have been developed to summarize the data in different statistical forms, as shown in the two EPS products below.
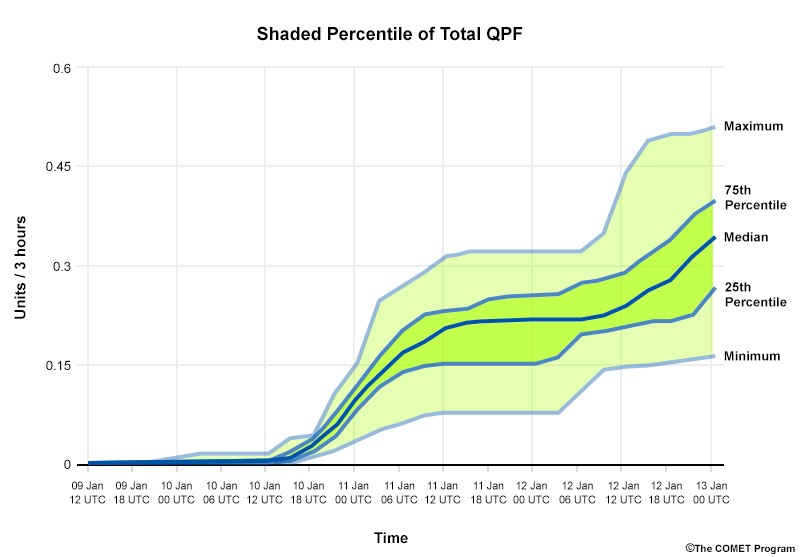
This sample point view product displays data using percentiles and color-shading so you can quickly view differences across time.
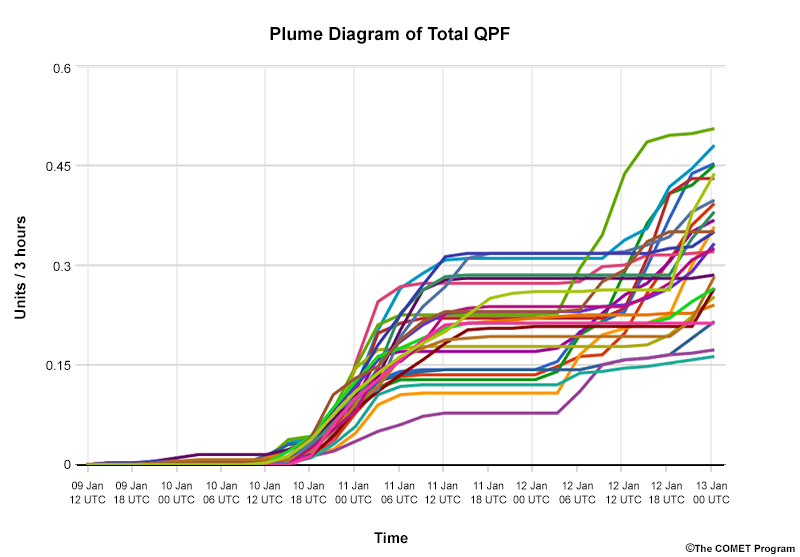
This sample point product displays the entire time series of EPS data so you can quickly view differences across time.
Ensemble output is mathematically complex so forecasters need to understand the underlying statistics in order to use it properly. The following section presents the basic concepts needed to interpret EPS products.