1. Introduction
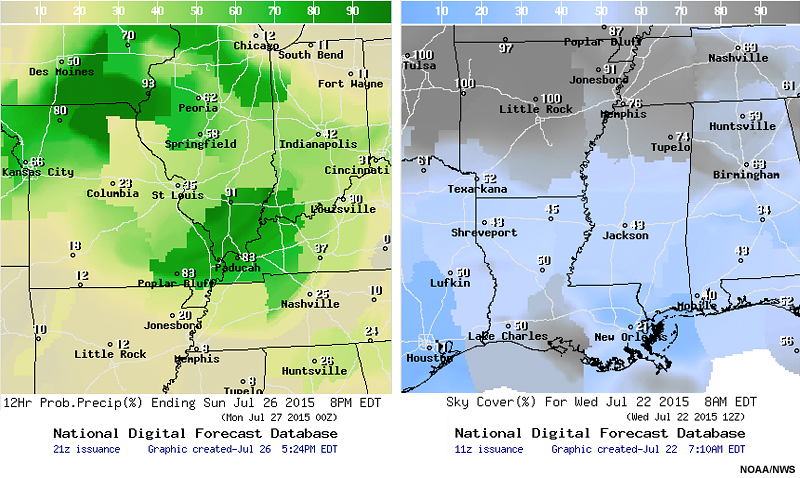
Regional examples of National Digital Forecast Database (NDFD) 12-hour probability of precipitation forecast issued on 26 July 2015 and sky cover forecast issued on 22 July 2015.
Question
How much time do you think forecasters on a shift currently spend updating the grids for the National Digital Forecast Database (NDFD)?
Feedback: The time spent will vary by office and weather scenario, but forecasters will sometimes spend up to 4 hours refining the NDFD grids.
Question
How often do the NDFD values for an area differ visually from the grids of neighboring offices?
Feedback: Qualitative views of the NDFD products suggests that inconsistencies in forecasts based on office county warning areas or political boundaries occur frequently, despite attempts by offices to have overall consistency with neighboring jurisdictions.
Question
Looking at the maps above, do you observe any inconsistencies in the forecast values based on forecast office areas of responsibility?
The National Blend of global Models (NBM) has been developed as a scientifically sound method with reduced errors and biases to provide a common starting point for a National Weather Service forecast. National Weather Service (NWS) Director Dr. Louis Uccellini provides some background on the NBM project:

Dr. Louis Uccellini, NWS Director (2015)
NWS Director Dr. Louis Uccellini talks about the inception of the National Blend of global Models.
“This effort started in the field. So my first encounter with the blend was with the Central Region and specifically the Sullivan forecast office. ... There was a number of issues that were being addressed here, and what I heard directly from the folks out in the field, as the blend gained popularity. First of all there is this consistency aspect trying to blend across the boundaries of the WFOs themselves so that we would not be building in these political boundaries into the NDFD grid sets. This as it turned out was an important complaint that was being levied against the weather service at large. … We then built this into the roadmap with the idea that we would provide a national basis for the blend, not just the individual efforts across the weather service. There were several reasons for that. I believe that from a scientific point of view, I believe this very strongly, I have said this in the past, you really need to start large and then work into the local areas. This is what synoptic and mesoscale meteorology has always been about and rather than trying to build up this national map from cobbling together 122 different WFO analyses. So it did provide a stronger basis moving forward in that regard.”
1.0 Introduction » 1.1 The Purpose for Creating the Blend
National Weather Service Forecasts are produced based on an assessment of input from model guidance, observations, and the expert judgement of forecasters. The purpose of the Blend is to have a seamless tool that National Centers and Weather Forecast Office (WFOs) can use as a starting point to create a large-scale national forecast. Prior to the implementation of the Blend, the NDFD forecasts generated across the offices did not always address larger-scale state, regional, and national needs. Inconsistencies across County Warning Area (CWA) or regional lines can lead to challenges for Impact-based Decision Support Services (IDSS). Dramatic discontinuities at forecast office boundaries can also reduce decision-makers’ confidence in the weather service’s ability to accurately predict weather and communicate information in a meaningful way.
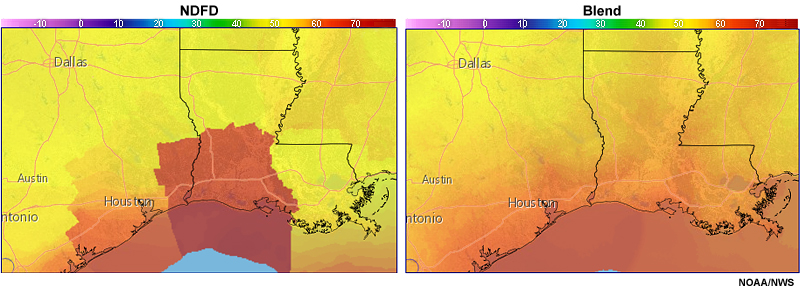
Comparison of regional boundaries in NDFD and Blend temperature forecasts.
In 2013, the National Academy of Public Administration (NAPA) study reported that NWS forecast products suffered from spatial inconsistency, making them potentially less useful than intended.The National Blend of global Models (NBM) project began as an effort to create a common starting point that is both nationally consistent and skillful, developed from a combination of both NWS and non-NWS statistically-calibrated deterministic and ensemble-based model information.
Consensus forecasts have been shown to perform better than individual models and forecasters when verified over long time periods (Vislocky and Fritsch, 1995; Fritsch et al., 2000; Baars and Mass, 2005; Roebber, 2010). A national blend grid product that is used by all WFOs will create a nationally consistent starting point for the NDFD by optimizing model output. The first two versions of the NBM are supported by NWS Sandy Supplement Projects funding, as part of the focus on Joint Polar Satellite System (JPSS) Gap Mitigation for projects that make better use of existing model data. The first version of the Blend (based on blends of global model guidance) will be implemented on the NOAA supercomputer in December 2015 with additional versions to be implemented over a five-year time period.
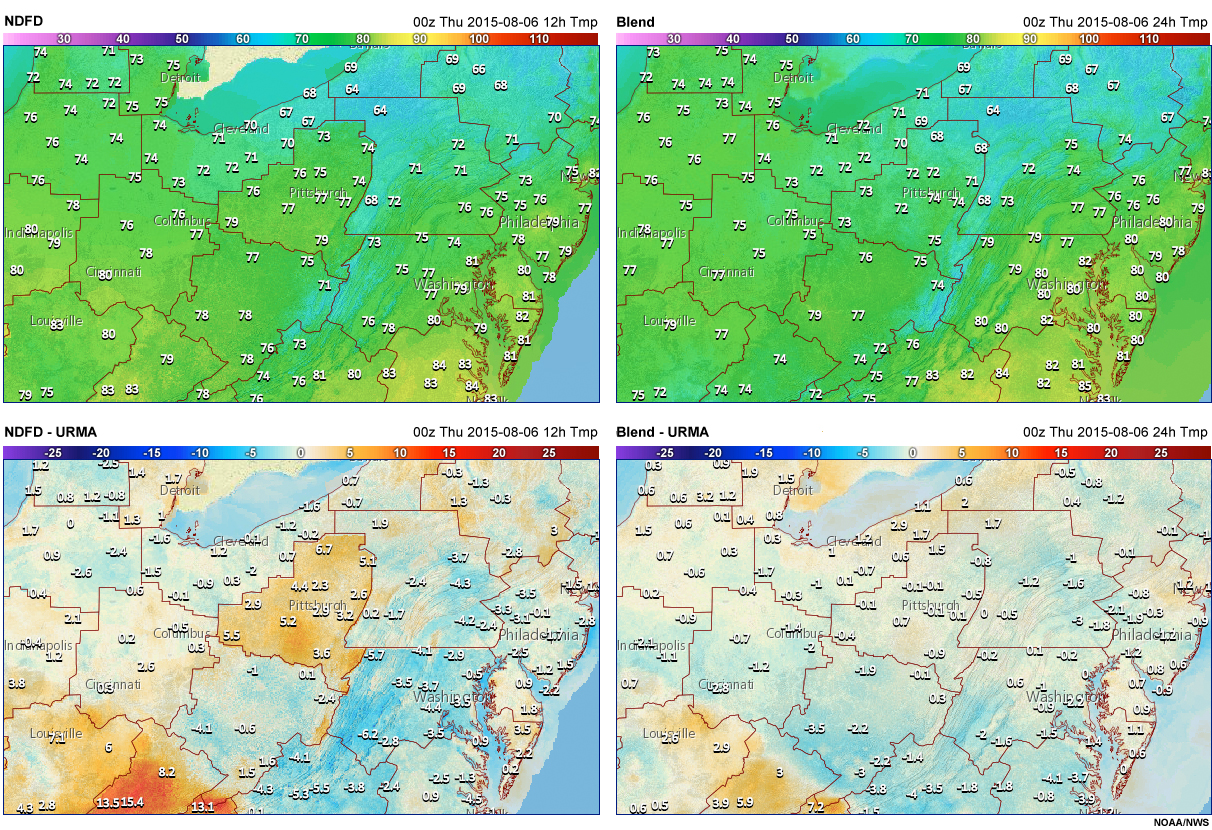
Temperature 12-hour forecast from NDFD and 24-hour forecast from the Blend in the Northeastern U.S., valid 00Z 2015 Aug 06, and the differences with URMA.
In the northeastern U.S., discrepancies at WFO boundaries are evident in the 24-hour temperature forecast from the NDFD vs Blend, and also in the its differences with the UnRestricted Mesoscale Analysis (URMA).
Here Dr. Uccellini summarize the goals of the NBM output.
Dr. Louis Uccellini, NWS Director (2015)
Dr. Louis Uccellini talks about the goals of the National Blend of global Models.
"The other goal here is to take full utilization of the model output that we are actually providing. So the truth in advertising, when I had the national blend project briefed to me by the Sullivan office and it was clearly impressive what they were bringing to the table, but one of the things that I noted was that they weren't making use of our ensemble model output. So what we have is a situation where we are increasingly relying on the ensemble model output that we do have access to, but it was not finding its way into the digital product stream; probably the main reason was that we didn't have the dissemination system to get the model output out to where the blends were being developed and tested. So let’s take full advantage of the ensembles that we have developed and implemented (across this time frame). So this was another driver for bringing this in and making sure that the blend itself, the blend product, made full utilization of the information that is there in the ensembles. And that it is reflected in our digital forecast, the same way that it is now being used to make other forecast products."
The Blend also takes advantage of the best possible science in terms of post processing techniques, downscaling and bias correction.
2. Overview of how the Blend Differs from Current Guidance
The current forecast process has involved WFOs generating gridded forecasts at a local level for the counties in their area of responsibility. Gridded forecasts are created by local forecasters, using their expert knowledge to modify the existing NDFD forecast with data from different model solutions and post-processed products such as model output statistics (MOS). Some offices also subjectively weight single model products using local tools to create “on-the-fly” blends, although this is generally considered a suboptimal approach. The National Digital Forecast Database (NDFD), which is part of the NWS strategy for provision of digital services to meet the evolving needs of its customers and partners, receives the local gridded forecasts and creates national and regional-scale mosaics.
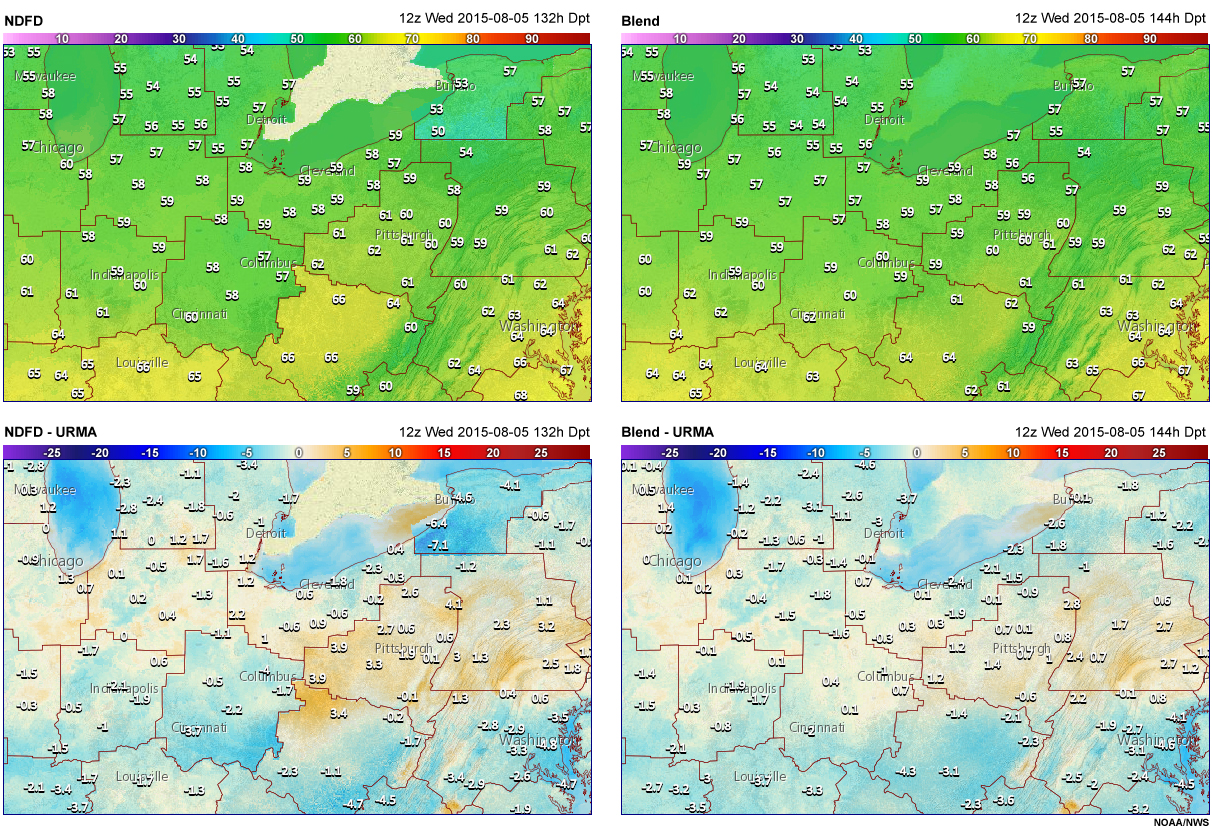
Dewpoint 132-hour forecast from NDFD and 144-hour forecast from the Blend in the Midwest valid 12Z 2015 Aug 05, and the differences with URMA.
In response to the lack of consistency seen among the local grids, some NWS Regions created their own regional model blends for the WFOs. The weights for the regional model blends are based on verification of the models, but are fixed for different locations and seasons. Therefore, a more dynamic, objectively weighted methodology was chosen to create the National Blend of global Models (NBM).
Dr. Louis Uccellini, NWS Director (2015)
NWS Director Dr. Louis Uccellini comments on the basics of the National Blend.
"What is the national blend project? It is recognition of the need to get the most out of the data we have and use it to improve consistency in our products on a state, regional, and national scale. I believe this is a scientifically sound approach to extract consistent weather information from all the models, especially the ensembles."
The NBM is not a way to reduce NWS staff, nor a way to remove the human completely from the forecasting process. The NBM is able to fully utilize high-resolution data and supercomputer processing power, using ensemble datasets and the full temporal resolution of the global models that are unavailable on AWIPS 2 due to dissemination limitations. The project goals of the NBM are to use an integrated and structured approach to:
- Develop a set of next-generation foundational gridded guidance products for NDFD weather elements based on NWS and non-NWS model information
- Create a NWS methodology for a national blend (“best”) product, starting with the Day 3 - 8 time frame (mesoscale models covering Day 1-3 are not included initially)
- Extend this methodology to a full set of NWS deterministic and probabilistic products covering days 1-10 in the future
2. Overview of how the Blend Differs from Current Guidance » 2.1 Overview of Blend Procedure
An example of the procedure used to create the NBM for temperature elements is shown below. The Gridded Model Output Statistics (MOS) and Direct Model Outputs (DMO or “raw” model output) forecasts are bias-corrected relative to a common high-resolution analysis (URMA). Bias-corrected components are then blended using a Mean Absolute Error (MAE) weighting technique. A bias-corrected and statistically downscaled guidance on the 2.5-km NDFD grid is subsequently produced. The NBM creates minor smoothing as a result of averaging multiple models. This smoothing is reduced by downscaling to the 2.5-km scale. It should be noted that the techniques used to create the blend of models will vary for different weather elements. A need to use a common NWS terrain has also been identified as a consistency issue and will be implemented as part of the NBM.
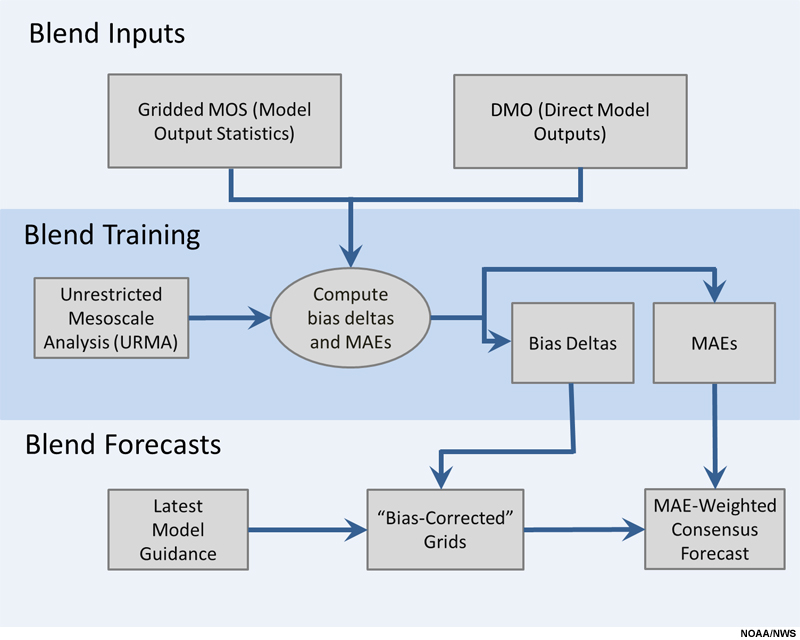
Conceptual flowchart of the NBM for temperature elements. In this chart, the "Bias Delta" is the bias or systematic error for each Blend component.
2. Overview of how the Blend Differs from Current Guidance » 2.2 Identifying Blend Components
Weather Elements
National Digital Forecast Database (NDFD) elements will be part of the National Blend package. Initially, two cycles per day (0000 and 1200 UTC) will be produced over the contiguous U.S. (CONUS) based on blends of global model guidance.
The initial weather elements (Version 1, Dec 2015) will include:
- Temperature,
- Dewpoint,
- Daytime Max T,
- Nighttime Min T,
- Sky Cover,
- Wind Speed/Direction,
- Relative Humidity,
- Wind Gusts,
- Apparent Temperature.
Version 2 elements (to be added by Fall 2016) will include the Version 1 elements, plus:
- 12-hr Probability of Precipitation,
- Precipitation Type,
- Snowfall Amount,
- QPF,
- Predominant Weather.
Development Scope
Products will be generated on NOAA’s Weather and Climate Operational Supercomputer System (WCOSS). Initial efforts will focus on blending global models to create a NDFD CONUS grid, and will be expanded to include other geographic domains in subsequent versions of the NBM. The global models included in the NBM Version 1.0, implemented in December 2015 will include:
- GFS and GFS Ensembles
- CMC Ensembles
It will expand to include higher resolution mesoscale models in the short term.
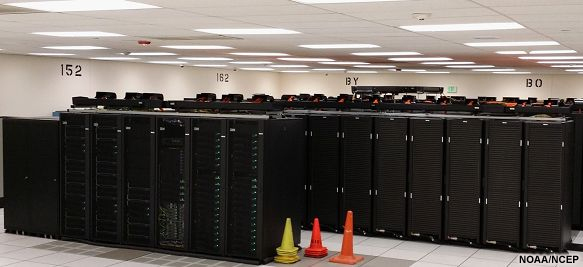
NOAA’s Weather and Climate Operational Supercomputer System.
2. Overview of how the Blend Differs from Current Guidance » 2.3 Optimal Dynamic Weighting Description
Bias-correction
The bias of each model is tracked using an Exponentially Weighted Moving Average (EWMA) (Roberts, 1959) or “decaying average” (Cui et al., 2012). Bias-correction is performed separately for each grid point, projection, and element. This is then used to create bias-corrected forecast grids. Statistically derived weights are then used to generate the NBM based on recent verification. All weather elements will be bias corrected and it is this objective method for determining weights that is the major distinction between regional blends and the new NBM. An example of how the model weights vary in different climates is shown below by comparing the weights for 120-hour NBM temperature forecasts in Albuquerque, Atlanta, and Seattle.
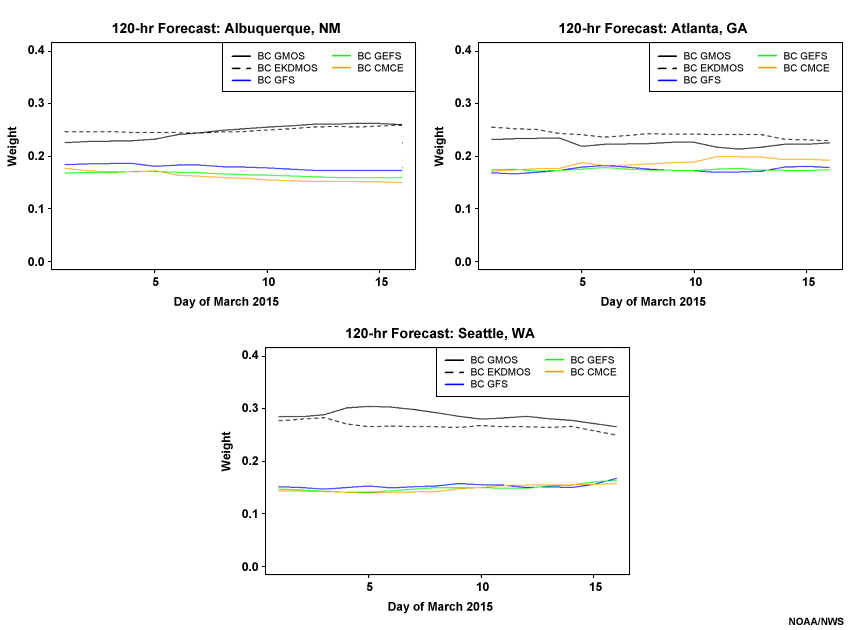
Model weights for the 120-hour temperature forecasts for Albuquerque, NM; Atlanta, GA; and Seattle, WA.
MAE-based Weighting (for temperature elements)
The MAE-based weighting tracks each bias-corrected component using an EWMA. Separate MAE estimates are produced for each grid point, projection, and element. The advantages of the MAE-based weighting are that it has simple computations, it’s straightforward to implement, it has reasonable results and it is easy to handle missing model forecasts. However, not all weather elements will use MAE-based weights.
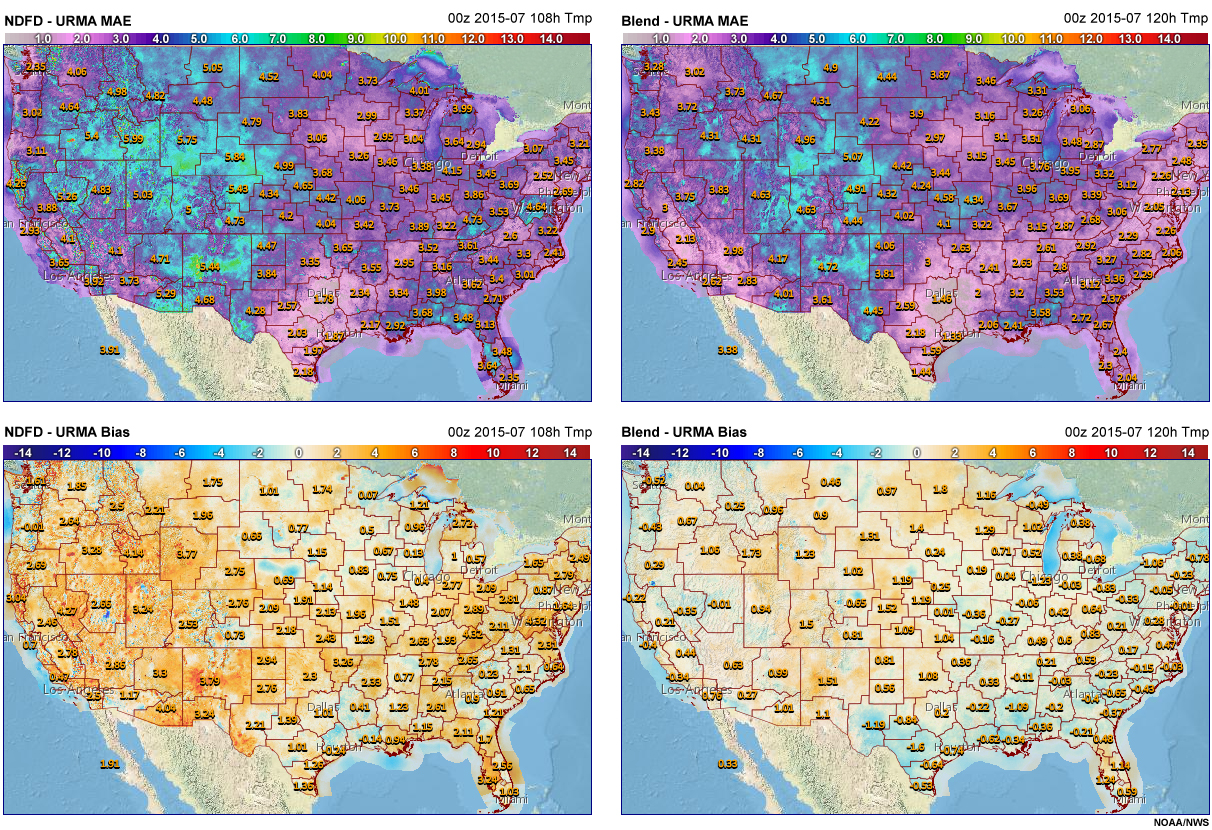
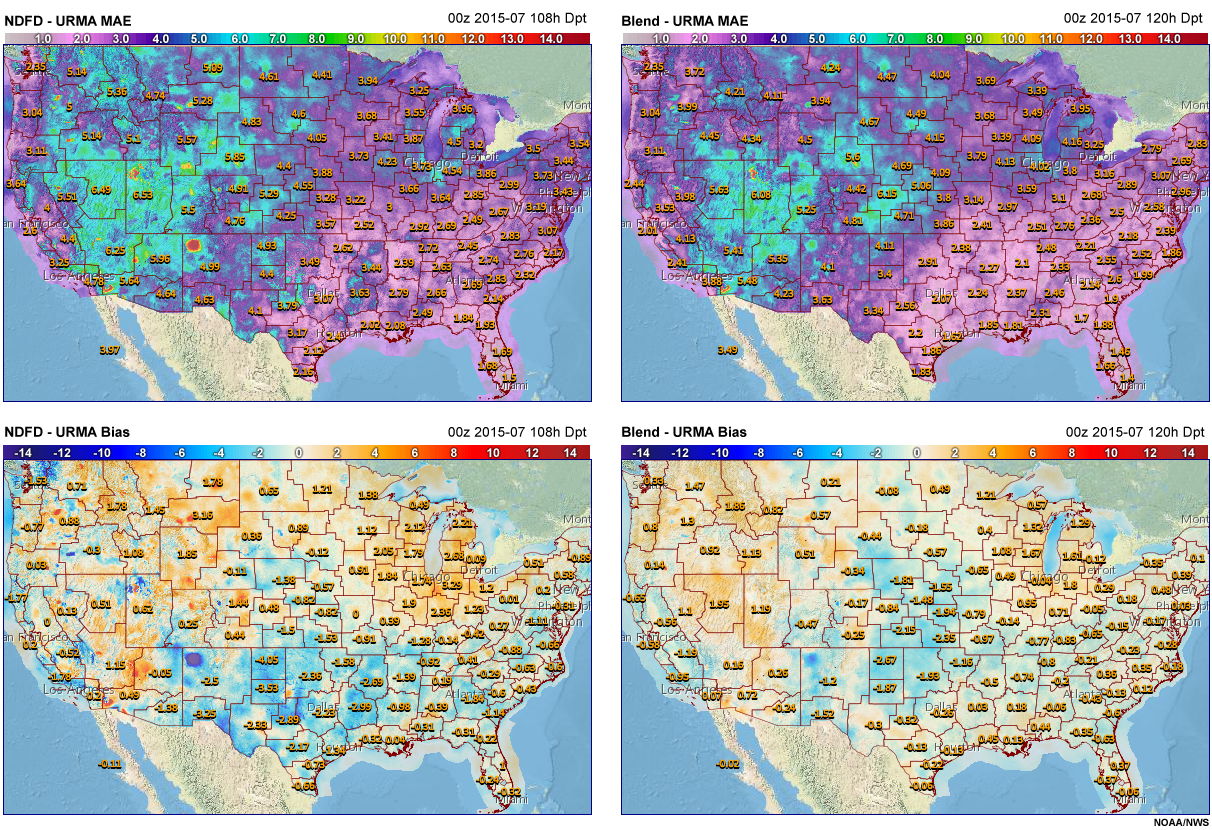
July 2015 MAE and Bias for the 00Z temperature at 108 hours from NDFD and 120 hours from the Blend, compared to URMA.
July 2015 MAE and Bias for the 00Z dewpoint at 108 hours from NDFD and 120 hours from the Blend, compared to URMA.
2. Overview of how the Blend Differs from Current Guidance » 2.4 RTMA/URMA and NBM Verification
The objective blended products are generated from calibrated post-processed model output. The output is produced centrally on WCOSS. Initially, the outputs will be:
- produced for two cycles per day (0000 and 1200 UTC)
- limited to Deterministic and Ensemble Global model inputs
- disseminated to NCEP National Centers, Weather Forecast Offices (WFOs), and the public
RTMA/URMA and Blend/PCBlend vs. NDFD
A concerted effort is being made to improve the Real Time Mesoscale Analysis (RTMA) and the UnRestricted Mesoscale Analysis (URMA). These analyses will evolve to become the analyses of record and serve as the basis for verification. While there has been increased interaction between the field and the RTMA/URMA developers, it is imperative that the field offices remain highly engaged to ensure that the RTMA and URMA will be of the best quality possible.
An online comparison viewer was developed to assess the NBM forecasts, alongside other guidance products. It allows forecasters to compare the different products, as well as their MAEs and biases.
Here, temperature values are shown for the NDFD, Blend and pcBlend, as well as their differences relative to URMA. The pcBlend is the previous 12-hour cycle’s Blend and is provided because it is the most current version of the NBM that is available to forecasters preparing their NDFD grids. Note that the NBM grids do not contain the inconsistencies currently present in the NDFD, as seen in the example below.
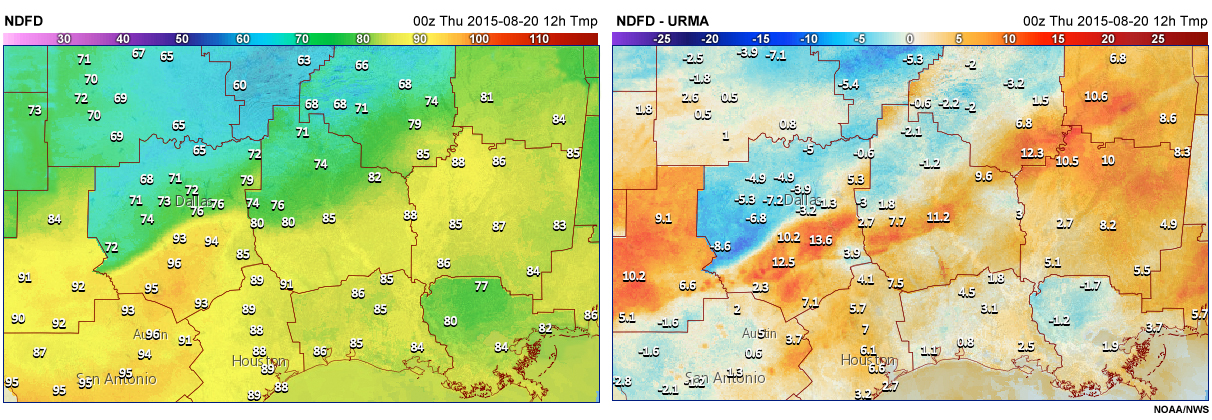
12-hour temperature forecasts from NDFD along the U.S. Gulf Coast, valid 00Z 2015 Aug 20.
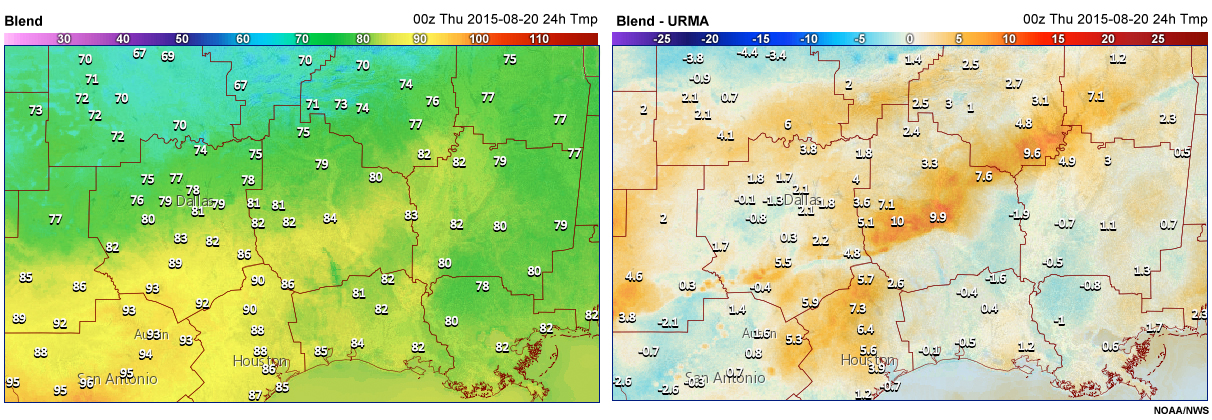
24-hour temperature forecasts from the Blend along the U.S. Gulf Coast, valid 00Z 2015 Aug 20.
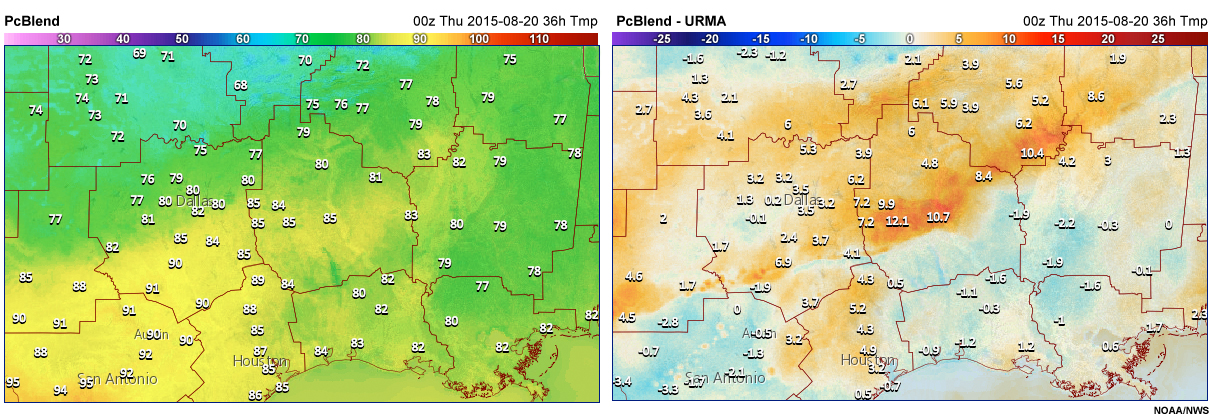
36-hour temperature forecasts from pcBlend along the U.S. Gulf Coast, valid 00Z 2015 Aug 20.
The Blend performs well when compared to point observations. Both the Blend and the pcBlend have an MAE that is comparable to, or better than, the NDFD. This improvement in MAE is apparent in the forecast out to 168 hours. Note that there is a warm bias of the dewpoint during this single month of 2015. Results from other months may vary.
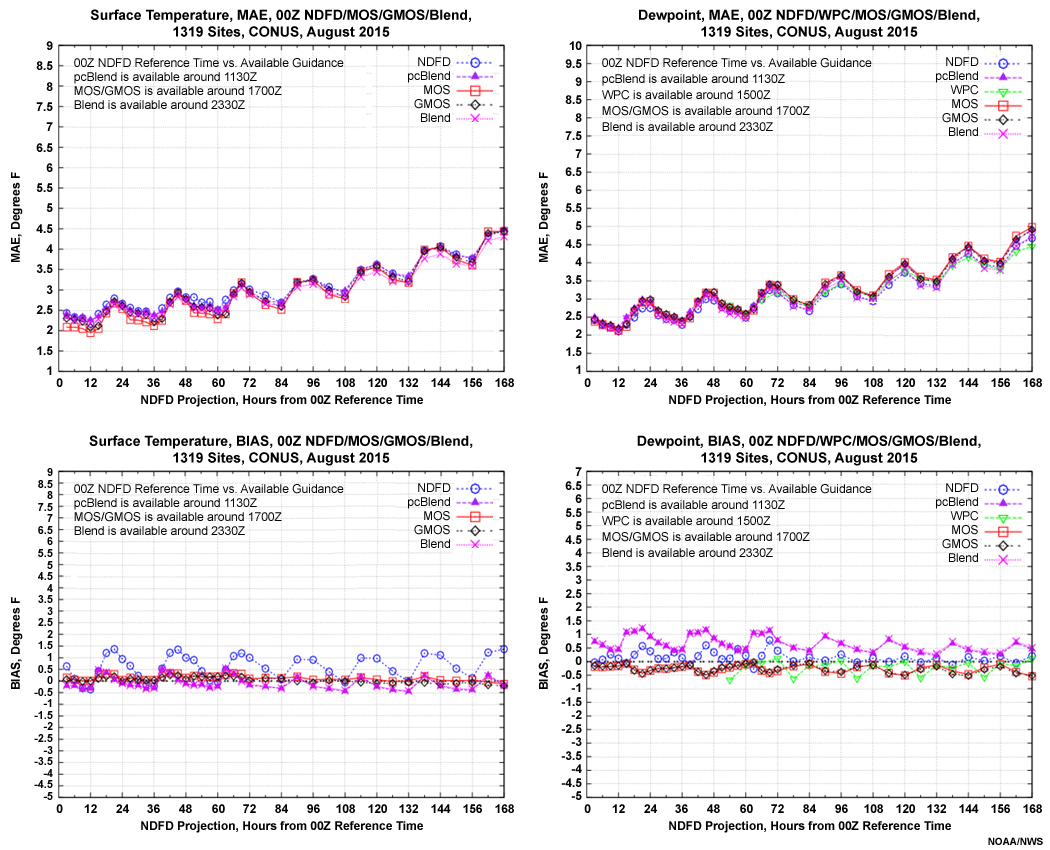
MAE and Bias using METAR point verification for temperature and dewpoint forecasts out to 168 hours in CONUS during August 2015.
3. Use in Forecast Process
3. Use in Forecast Process » 3.1 Blend Data Delivery and Access
To evaluate the NBM, all elements will be verified against a grid-based Analysis of Record and point-based observations. The project will not be complete until blended guidance is available for all NDFD elements and domains, and accessible in AWIPS-II. Models, analyses, and statistical post-processing techniques demonstrate the NBM procedures can be implemented and made available on the NOAA production supercomputer. Every 12 hours the National Blend grids will flow from WCOSS to the National Centers/WPC, and from WCOSS to the Satellite Broadcast Network (SBN). The SBN will then disseminate the data to the WFOs for ingest into AWIPS-II.
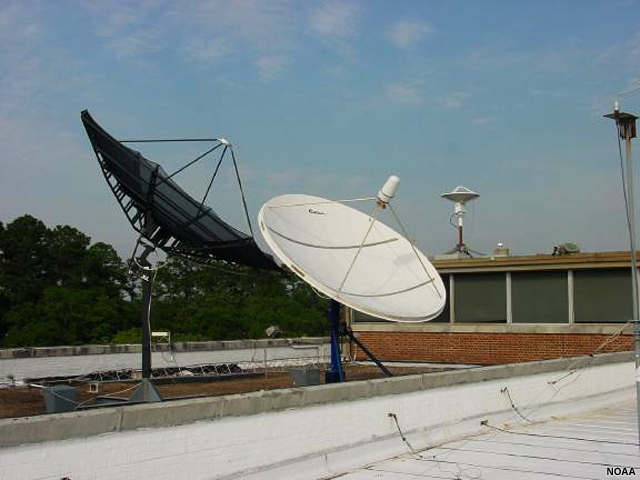
Antennae connection to the Satellite Broadcast Network (SBN) at the Tallahassee WFO.
3. Use in Forecast Process » 3.2 Expected Outcomes
The National Blend of global Models will provide a better starting point to forecasters based on improved science and will help reduce boundary inconsistencies in the NDFD. Providing WFOs with the NBM will also streamline the process and reduce the level of effort required to produce medium-range forecasts. The expected outcomes of the NBM are:
- Better deterministic guidance for NDFD forecast consistency
- Better deterministic guidance for NDFD with reduced bias and errors
- Better probabilistic guidance (in future NBM Versions)
- Better representation of complex terrain with guidance derived from coarse global models
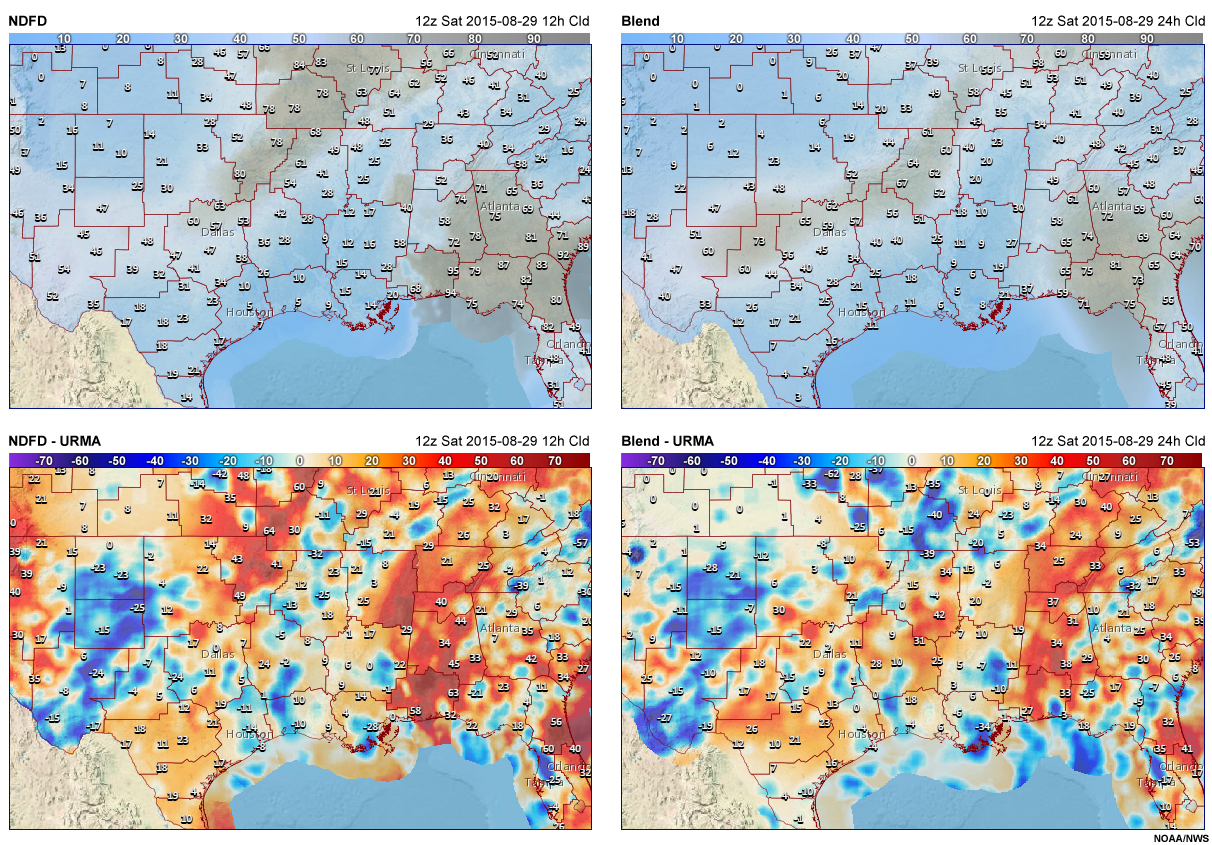
Sky Cover 12-hour forecast from NDFD and 24-hour forecast from the Blend valid 12Z 2015 Aug 29, and the differences with URMA.
3. Use in Forecast Process » 3.3 NBM in the Future
The NBM was designed as a multi-year project with the first version available at the end of 2015. Further development of the blend products is ongoing and as the NBM is expanded and enhanced, new versions will be produced.
Version 2.0 will be released in late 2016 and will expand the NBM to include the Alaska, Hawaii and Puerto Rico NDFD domains, as well as wind grids over the NDFD Oceanic domain. Version 2.0 will also include blends for QPF, snow amount, precipitation type, predominant weather, and oceanic winds.
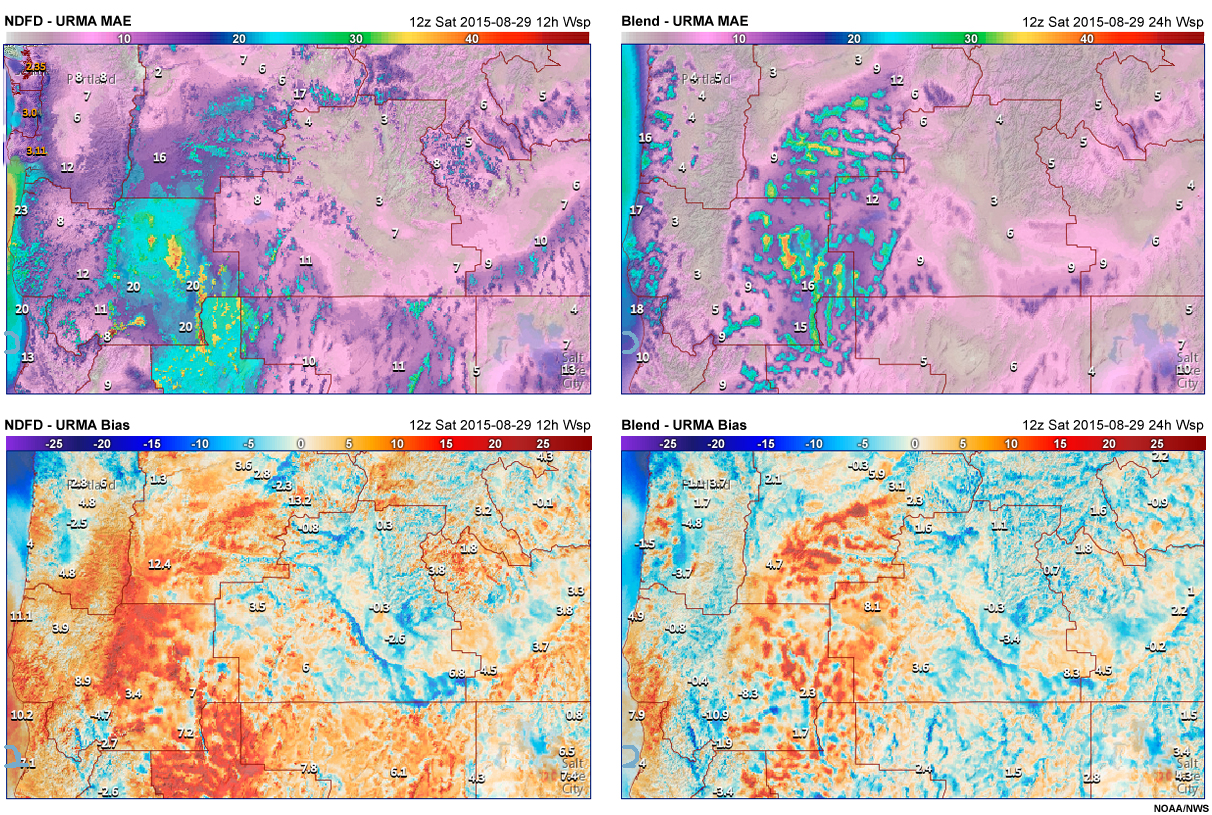
Wind speed 12-hour from NDFD and 24-hour forecast from the Blend valid 12Z 2015 Aug 29, and the differences with URMA.
Beyond 2016, the NBM will incorporate mesoscale models (including the HRRR and LAMP) to enhance short term deterministic blended guidance by increasing the temporal resolution and adding ceiling and visibility grids. There are also plans to add probabilistic elements to the Blend, beginning with guidance for PoP12 and maximum and minimum temperature.
4. Summary, including Future Training Topics
The NBM is a nationally consistent methodology that uses objective statistical techniques to combine global model output into a single ‘best’ blended product. Use of the NBM enables local forecast offices to produce their forecasts from a temporally and spatially consistent set of NWS deterministic and probabilistic products. This consistency can increase public confidence in NWS forecasts. Furthermore, reducing the time spent editing grids locally allows forecasters to prioritize communicating forecasts and aiding decision-making.

Temperature 12-hour forecast from NDFD and 24-hour forecast from the Blend valid 12Z 2015 Aug 22, and the differences with URMA.
Three future lessons will cover the statistics used to optimize model blends, the behavior of model components in the NBM, and verification of the NBM.
References
Baars, J.A. and C.F. Mass, 2005: Performance of National Weather Service Forecasts Compared to Operational, Consensus, and Weighted Model Output Statistics. Wea. Forecasting, 20, 1034–1047. doi: http://dx.doi.org/10.1175/WAF896.1
Cui, B., Z. Toth, Y. Zhu and D. Hou, 2012: Bias Correction for Global Ensemble Forecast. Wea. Forecasting, 27, 396–410.
Fritsch, J.M., J. Hilliker, J. Ross, and R. L. Vislocky, 2000: Model Consensus. Wea. Forecasting, 15, 571–582.
National Weather Service National Model Blend Prototype Viewer, http://www.mdl.nws.noaa.gov/~blend/blender.prototype.php (Login required; NOAA access only)
National Weather Service User Documentation for National Model Blend Prototype Viewer, http://www.mdl.nws.noaa.gov/~blend/doc_material/UserDoc.html (Login required; NOAA access only)
National Academy of Public Administration, Forecast for the Future: Assuring the Capacity of the National Weather Service, May 2013, http://www.napawash.org/wp-content/uploads/2013/05/ForecastfortheFuture-AssuringtheCapacityoftheNationalWeatherService.pdf.
National Weather Service, 2013: Weather-Ready Nation Roadmap, http://www.nws.noaa.gov/com/weatherreadynation/files/nws_wrn_roadmap_final_april17.pdf
Roberts, SV, 1959: Control chart tests based on geometric moving averages. Technometrics 1, 239-250.
Roebber, P.J. 2010: Seeking Consensus: A New Approach. Mon. Wea. Rev., 138, 4402–4415. doi: http://dx.doi.org/10.1175/2010MWR3508.1
Thompson, P.D., 1977: How to Improve Accuracy by Combining Independent Forecasts. Mon. Wea. Rev., 105, 228–229. doi: http://dx.doi.org/10.1175/1520-0493(1977)105<0228:HTIABC>2.0.CO;2
Vislocky, R.L. and J.M.l Fritsch, 1995: Improved Model Output Statistics Forecasts through Model Consensus. Bull. Amer. Meteor. Soc., 76, 1157–1164. doi: http://dx.doi.org/10.1175/1520-0477(1995)076<1157:IMOSFT>2.0.CO;2
Contributors
COMET Sponsors
The COMET® Program is sponsored by NOAA's National Weather Service (NWS), with additional funding by:
- Bureau of Meteorology of Australia (BoM)
- Bureau of Reclamation, United States Department of the Interior
- European Organisation for the Exploitation of Meteorological Satellites (EUMETSAT)
- Meteorological Service of Canada (MSC)
- NOAA's National Environmental Satellite, Data and Information Service (NESDIS)
- NOAA's National Geodetic Survey (NGS)
- Naval Meteorology and Oceanography Command (NMOC)
- U.S. Army Corps of Engineers (USACE)
Project Contributors
Project/Program Manager/Coordinator
- Dr. Greg Byrd — UCAR/COMET
Project Lead/Science Focal Point
- Dr. Bill Bua — UCAR/COMET
Project Lead/Instructional Design
- Amy Stevermer — UCAR/COMET
Project Scientist
- Dr. Paula Brown — CIRA/Colorado State University
Principal Science Advisors
- Jeff Craven — National Weather Service (NWS) Central Region Scientific Services Division
- John Gagan — National Weather Service (NWS) Weather Forecast Office, Springfield, MO
- Kathryn Gilbert — National Weather Service (NWS) Weather Prediction Center
- Dr. David Myrick — National Weather Service (NWS) Meteorological Development Laboratory
- Dr. David Novak — National Weather Service (NWS) Weather Prediction Center
- Jim Sieveking — National Weather Service (NWS) Weather Forecast Office, St. Louis, MO
- Bruce Veenhuis — National Weather Service (NWS) Meteorological Development Laboratory
- Jeff Waldstreicher — National Weather Service (NWS) Eastern Region Scientific Services Division
Graphics/Animations
- Steve Deyo — UCAR/COMET
- Sylvia Quesada — UCAR/COMET
Multimedia Authoring/Interface Design
- Gary Pacheco — UCAR/COMET
Audio Editing/Production
- Dr. Paula Brown — CIRA/Colorado State University
- Gary Pacheco — UCAR/COMET
COMET Staff, Fall 2015
Director's Office
- Dr. Rich Jeffries, Director
- Dr. Greg Byrd, Deputy Director
- Lili Francklyn, Business Development Specialist
Business Administration
- Dr. Elizabeth Mulvihill Page, Group Manager
- Lorrie Alberta, Administrator
- Hildy Kane, Administrative Assistant
- Austin Ricks, Student Assistant
IT Services
- Tim Alberta, Group Manager
- Bob Bubon, Systems Administrator
- Dolores Kiessling, Software Engineer
- Joey Rener, Student Assistant
- Malte Winkler, Software Engineer
Instructional and Media Services
- Bruce Muller, Group Manager
- Dr. Alan Bol, Scientist/Instructional Designer
- Steve Deyo, Graphic and 3D Designer
- Lon Goldstein, Instructional Designer
- Bryan Guarente, Instructional Designer
- Lindsay Johnson, Student Assistant
- Dr. Vickie Johnson, Instructional Designer (Casual)
- Gary Pacheco, Web Designer and Developer
- Sylvia Quesada, Intern
- Sarah Ross-Lazarov, Instructional Designer
- Tsvetomir Ross-Lazarov, Instructional Designer
- David Russi, Spanish Translations
- Andrea Smith, Meteorologist/Instructional Designer
- Marianne Weingroff, Instructional Designer
Science Group
- Wendy Schreiber-Abshire, Group Manager
- Dr. William Bua, Meteorologist
- Dr. Frank Bub, Oceanographer (Casual)
- Dr. Paula Brown, Visiting Meteorologist, CIRA/Colorado State University
- Lis Cohen, Meteorologist (Casual)
- Patrick Dills, Meteorologist
- Matthew Kelsch, Hydrometeorologist
- Dr. Elizabeth Mulvihill Page, Meteorologist
- Amy Stevermer, Meteorologist
- Vanessa Vincente, Visiting Meteorologist, CIRA/Colorado State University