Media elements used in this module are protected by a variety of copyright licenses. Please use the "copyright terms" link associated with each item below for more information.
Description:
observed 500-hPa geopotential heights 18 UTC 3 August 2008 from NCEP global analysis.
File Name:
Case1_500zanl.gif
Credits:
NOAA
Copyright Terms:
COMET Standard Terms
of Use
Description:
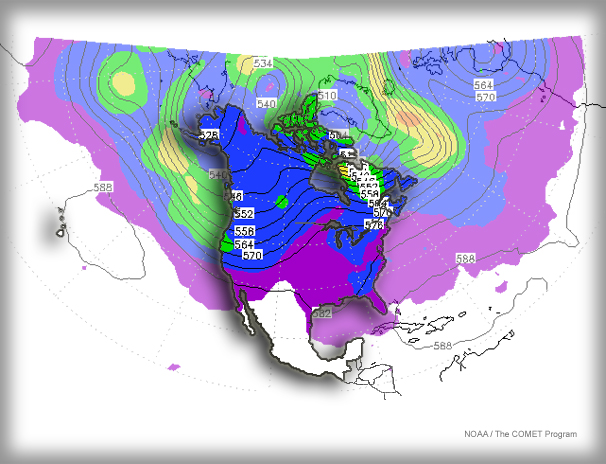
NAEFS 10th percentile 500-hPa geopotential heights and anomalies, run time 00 UTC 1 August 2008 valid time 18 UTC 3 August 2008. Bring annotations into COMET compliance (Arial, with appropriate font sizes)
File Name:
Case1_500zd310pct.gif
Credits:
NOAA
Copyright Terms:
COMET Standard Terms
of Use
Description:
NAEFS run 00 UTC 1 August 2008 500-hPa heights and anomalies for 10%-ile level, forecast valid 18 UTC 3 August 2008.
File Name:
Case1_500zd310pct_a.gif
Credits:
NOAA
Copyright Terms:
COMET Standard Terms
of Use
Description:
NAEFS 50th percentile 500-hPa geopotential heights and anomalies, run time 00 UTC 1 August 2008 valid time 18 UTC 3 August 2008.
File Name:
Case1_500zd350pct.gif
Credits:
NOAA
Copyright Terms:
COMET Standard Terms
of Use
Description:
NAEFS run 00 UTC 1 August 2008 500-hPa heights and anomalies for 50%-ile level, forecast valid 18 UTC 3 August 2008.
File Name:
Case1_500zd350pct_a.gif
Credits:
NOAA
Copyright Terms:
COMET Standard Terms
of Use
Description:
NAEFS 50th percentile 500-hPa geopotential heights and anomalies, run time 00 UTC 1 August 2008 valid time 18 UTC 3 August 2008.
File Name:
Case1_500zd390pct.gif
Credits:
NOAA
Copyright Terms:
COMET Standard Terms
of Use
Description:
NAEFS run 00 UTC 1 August 2008 500-hPa heights and anomalies for 90%-ile level, forecast valid 18 UTC 3 August 2008.
File Name:
Case1_500zd390pct_a.gif
Credits:
NOAA
Copyright Terms:
COMET Standard Terms
of Use
Description:
NAEFS run 00 UTC 28 July 2008 500-hPa heights and anomalies for 10%-ile level, forecast valid 18 UTC 3 August 2008.
File Name:
Case1_500zd710pct.gif
Credits:
NOAA
Copyright Terms:
COMET Standard Terms
of Use
Description:
NAEFS run 00 UTC 28 July 2008 500-hPa heights and anomalies for 10%-ile level, forecast valid 18 UTC 3 August 2008.
File Name:
Case1_500zd710pct_a.gif
Credits:
NOAA
Copyright Terms:
COMET Standard Terms
of Use
Description:
NAEFS run 00 UTC 28 July 2008 500-hPa heights and anomalies for 50%-ile level, forecast valid 18 UTC 3 August 2008
File Name:
Case1_500zd750pct.gif
Credits:
NOAA
Copyright Terms:
COMET Standard Terms
of Use
Description:
NAEFS run 00 UTC 28 July 2008 500-hPa heights and anomalies for 50%-ile level, forecast valid 18 UTC 3 August 2008. Bring annotations into COMET compliance (Arial, with appropriate font sizes)
File Name:
Case1_500zd750pct_a.gif
Credits:
NOAA
Copyright Terms:
COMET Standard Terms
of Use
Description:
NAEFS run 00 UTC 28 July 2008 500-hPa heights and anomalies for 90%-ile level, forecast valid 18 UTC 3 August 2008
File Name:
Case1_500zd790pct.gif
Credits:
NOAA
Copyright Terms:
COMET Standard Terms
of Use
Description:
NAEFS run 00 UTC 28 July 2008 500-hPa heights and anomalies for 90%-ile level, forecast valid 18 UTC 3 August 2008.
File Name:
Case1_500zd790pct_a.gif
Credits:
NOAA
Copyright Terms:
COMET Standard Terms
of Use
Description:
NAEFS 10th percentile forecast 2-meter temperature and anomalies, ensemble run 00 UTC 1 August 2008 valid time 00 UTC 4 August 2008.
File Name:
Case1_t2md310pct.gif
Credits:
NOAA
Copyright Terms:
COMET Standard Terms
of Use
Description:
NAEFS 50th percentile forecast 2-meter temperature and anomalies, ensemble run 00 UTC 1 August 2008 valid time 00 UTC 4 August 2008.
File Name:
Case1_t2md350pct.gif
Credits:
NOAA
Copyright Terms:
COMET Standard Terms
of Use
Description:
NAEFS 90th percentile forecast 2-meter temperature and anomalies, ensemble run 00 UTC 1 August 2008 valid time 00 UTC 4 August 2008.
File Name:
Case1_t2md390pct.gif
Credits:
NOAA
Copyright Terms:
COMET Standard Terms
of Use

Description:
observed maximum 2-m temperature, 3 August 2008, middle CONUS
File Name:
Case1_tmax_a.gif
Credits:
NOAA
Copyright Terms:
COMET Standard Terms
of Use
Description:
observed maximum 2-m temperature anomalies, 3 August 2008, middle CONUS
File Name:
Case1_tmaxanm_a.gif
Credits:
NOAA
Copyright Terms:
COMET Standard Terms
of Use
Description:
Maximum temperature and climatological anomaly in degrees Fahrenheit for 3 August 2008, from Climate Prediction Center.
File Name:
Case1_tmaxanom.gif
Credits:
NOAA
Copyright Terms:
COMET Standard Terms
of Use
Description:
NAEFS 552-dm, 500-hPa height contour spaghetti diagram, forecast run 00 UTC 19 February 2007 valid time 00 UTC 24 February 2007.
File Name:
case2_500spgh02240700.gif
Credits:
NOAA/NCEP
Copyright Terms:
COMET Standard Terms
of Use
Description:
NAEFS 552-dm, 500 hPa contour spaghetti diagram, forecast run 00 UTC 19 February 2007 valid time 00 UTC 24 February 2007.
File Name:
case2_500spgh02240700_2.gif
Credits:
NOAA/NCEP
Copyright Terms:
COMET Standard Terms
of Use
Description:
NAEFS 552-dm height contour, 500-hPa height spaghetti diagram, ensemble run from 00 UTC 19 February 2007 valid time 00 UTC 25 February 2007.
File Name:
case2_500spgh02250700.gif
Credits:
NOAA/NCEP
Copyright Terms:
COMET Standard Terms
of Use
Description:
glaze accumulation for storm of 24-25 February 2007, courtesy Richard Grumm, WFO State College PA
File Name:
case2_ice.gif
Credits:
NOAA/NWS
Copyright Terms:
COMET Standard Terms
of Use
Description:
NAEFS sea level pressure 996 hPa contour spaghetti diagram, ensemble run from 00 UTC 19 February 2007 valid time 00 UTC 25 February 2007.
File Name:
case2_pmsl02250700.gif
Credits:
NOAA/NCEP
Copyright Terms:
COMET Standard Terms
of Use
Description:
snowfall for storm of 24-25 February 2007, courtesy Richard Grumm, WFO State College PA
File Name:
case2_snow.gif
Credits:
NOAA/NWS
Copyright Terms:
COMET Standard Terms
of Use
Description:
Briar Skill Score for NAEFS/GEFS/CEFS ensemble mean 500-hPa heights, Northern Hemisphere, fall 2007 (Sept. 1 - Nov. 30).
File Name:
NAEFS_500bssfall07.gif
Credits:
NOAA/NCEP
Copyright Terms:
COMET Standard Terms
of Use
Description:
NAEFS/GEFS/CEFS mean absolute error for ensemble mean 500-hPa heights, Northern Hemisphere, fall 2007 (Sept. 1-Nov. 30, 2007).
File Name:
NAEFS_500maefall07.gif
Credits:
NOAA/NCEP
Copyright Terms:
COMET Standard Terms
of Use
Description:
reliability and resolution of 500-hPa ensemble mean heights, NAEFS/GEFS/CEFS, Northern Hemisphere, Fall 2007 (Sept. 1-Nov. 30).
File Name:
NAEFS_500relresfall07.gif
Credits:
NOAA/NCEP
Copyright Terms:
COMET Standard Terms
of Use
Description:
NAEFS/GEFS/CEFS root mean square error for ensemble mean 500-hPa northern hemisphere heights, Fall 2007 (Sept. 1 - Nov. 30).
File Name:
NAEFS_500rmsefall07.gif
Credits:
NOAA/NCEP
Copyright Terms:
COMET Standard Terms
of Use
Description:
CMC box and whisker diagram for Denver CO, NAEFS run 00 UTC 9 April 2008 for 2-m temperatures, 12-hour accumulated precipitation, 10-m wind speed, total cloud cover. Forecasts shown every 6 hours from 00 UTC 9 April to 00 UTC 24 April 2009. Whiskers give extreme ensemble forecast values, box gives the 1st to 3rd quartiles, with a line in the box giving the median.
File Name:
NAEFS_CMCboxwhisk1.gif
Credits:
Environment Canada
Copyright Terms:
COMET Standard Terms
of Use
Description:
NAEFS forecast from 00 UTC 9 April 2008 box and whisker diagram of 2-m temperature, Denver CO. Only the 2-m temperature portion of the graphic, with a zoom-in to April 14-16, 2009 in the animation. In the zoom-in, an arrow is pointing to point in the graphic giving the box and whisker forecast for 18 UTC 15 April 2009.
File Name:
NAEFS_CMCboxwhisk2.gif
Credits:
Environment Canada
Copyright Terms:
COMET Standard Terms
of Use
Description:
NAEFS forecast from 00 UTC 9 April 2008 box and whisker diagram of 2-m temperature, Denver CO. Only the 2-m temperature portion of the graphic, with a zoom-in to April 14-16, 2009 in the animation. In the zoom-in, an arrow is pointing to point in the graphic giving the box and whisker forecast for 18 UTC 15 April 2009.
File Name:
NAEFS_CMCboxwhisk3.gif
Credits:
Environment Canada
Copyright Terms:
COMET Standard Terms
of Use
Description:
NAEFS forecast from 00 UTC 9 April 2008 box and whisker diagram of 2-m temperature, Denver CO. Only the 2-m temperature portion of the graphic, with a zoom-in to April 14-16, 2009 in the animation. In the zoom-in, an arrow is pointing to point in the graphic giving the box and whisker forecast for 18 UTC 15 April 2009.
File Name:
NAEFS_CMCboxwhisk4.gif
Credits:
Environment Canada
Copyright Terms:
COMET Standard Terms
of Use
Description:
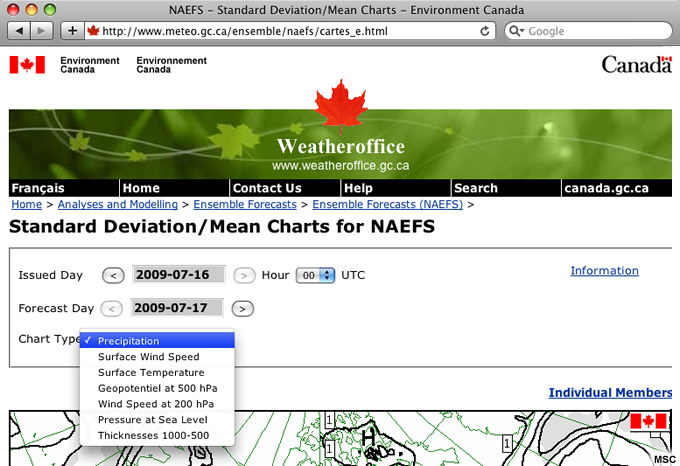
MSC standard deviation/mean charts web page navigation section. Can select run date and time, and forecast date. All forecasts are for the same time of day as run start time.
File Name:
NAEFS_CMCmeansd1.jpg
Credits:
MSC
Copyright Terms:
COMET Standard Terms
of Use
Description:
Meteorological Service of Canada NAEFS standard deviation and mean graphic over and adjacent to the continental U.S., 00 UTC 08 April 2008 forecast valid 00 UTC 13 April 2008. Standard deviation shaded in degrees Celsius, mean contoured at 5 degrees Celsius intervals.
File Name:
NAEFS_CMCmeansdgraph.gif
Credits:
Environment Canada
Copyright Terms:
COMET Standard Terms
of Use
Description:
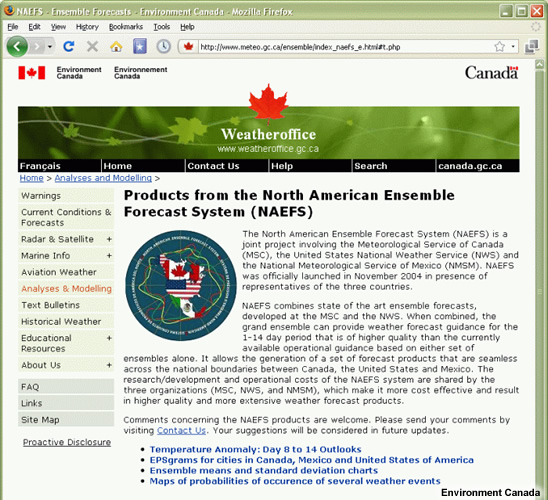
Screen capture of MSC/CMC NAEFS website with links to 4 different NAEFS products; Temperature Anomaly: Day 8 to 14 Outlooks, EPSgrams for cities in Canada, Mexico, and the U.S.A., Ensemble means and standard deviation charts, and Maps of probabilities of occurrence of several weather events.
File Name:
NAEFS_CMCpage1.jpg
Credits:
Environment Canada
Copyright Terms:
COMET Standard Terms
of Use
Description:
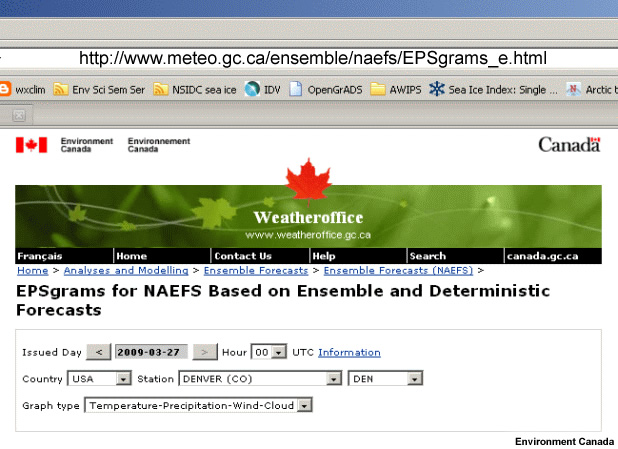
Meteorological Services of Canada NAEFS EPSgram website navigation area, where run date (yyyy-mm-dd) and time (00 or 12 UTC), country (U.S., Canada, or Mexico), station (many), and EPSgram graph type (temperature-precipitation-wind-cloud, 2-m RH-500hPa height-200 hPa wind-MSLP, 500-1000 hPa thickness) can be selected.
File Name:
NAEFS_CMCpage2.jpg
Credits:
Environment Canada
Copyright Terms:
COMET Standard Terms
of Use
Description:
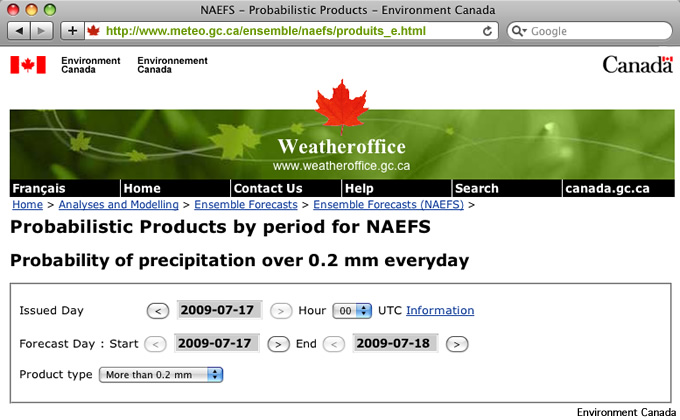
MSC NAEFS probabilistic products web page navigation section. Allows choice of run date and time, beginning forecast and ending forecast date, and probability of exceedance variable name and threshold.
File Name:
NAEFS_CMCprob1.jpg
Credits:
Environment Canada
Copyright Terms:
COMET Standard Terms
of Use
Description:
MSC NAEFS 00 UTC 08 April 2008 run, probability of exceedance diagram of minimum 2-m temperature less than zero degrees Celsius over the 24 hour forecast period from 00 UTC 12 April to 00 UTC 13 April 2008.
File Name:
NAEFS_CMCprobexceed.gif
Credits:
MSC
Copyright Terms:
COMET Standard Terms
of Use
Description:
National Centers for Environmental Prediction/North American Ensemble Forecast System web page with links to Meteorological Service of Canada graphical products; Week 2, 2-meter temperature product; and NAEFS Products Generated at NCEP.
File Name:
NAEFS_NCEPpage1.gif
Credits:
NOAA/NCEP
Copyright Terms:
COMET Standard Terms
of Use
Description:
National Centers for Environmental Prediction/North American Ensemble Forecast System NCEP bias-corrected 2-meter temperature graphics and bias comparison web page.
The first set of links are to web pages for graphics for bias-corrected 2-m temperature forecasts and anomalies for U.S. Global Ensemble Forecast System (GEFS) and Canadian Meteorological Center (CMC) Ensemble Forecast System (CEFS), over the global and North American domains, and GEFS and CEFS side-by-side QPF and PQPF comparisons. Bias comparison links are currently dormant.
File Name:
NAEFS_NCEPpage2.gif
Credits:
NOAA/NCEP
Copyright Terms:
COMET Standard Terms
of Use
Description:
North American Region (CMC Bias-Corrected Ensemble Forecast) 2-m temperature forecast graphics web page. 15 days of forecasts are available, at 24 hour intervals from 24 to 360 hours. The web page is in the form of a table, with each row representing a forecast run date for the 00 UTC cycle. Each column has a number that hot-links to a graphic for that number's forecast lead time in hours.
File Name:
NAEFS_NCEPpage3.gif
Credits:
NOAA/NCEP
Copyright Terms:
COMET Standard Terms
of Use
Description:
NAEFS forecast 2-m temperature and anomalies from climatology over North America. 00 UTC 8 April 2008 run, valid time 00 UTC 13 April 2008. The continental US is outlines on each for emphasis. 2-m temperatures are contours at 4 Kelvin intervals. Climate anomaly percentile (relative to a long term NCEP reanalysis climatology) is shaded from 10% to 90%, at 10% intervals.
For slide 8: add that 288K contour is highlighted.
For slide 10: add that 10th forecast percentile is 274.5K, 50th percentile is 276K, and 90th percentile is 277K for Chicago IL.
For slide 15: add that the 10th, 50th, and 90th FORECAST percentiles are all in the lowest 10th CLIMATE percentile.
File Name:
NAEFS_pctiles.gif
Credits:
NOAA
Copyright Terms:
COMET Standard Terms
of Use
Description:
-
File Name:
NAEFSsplash9.jpg
Credits:
NOAA
Copyright Terms:
COMET Standard Terms
of Use
Description:
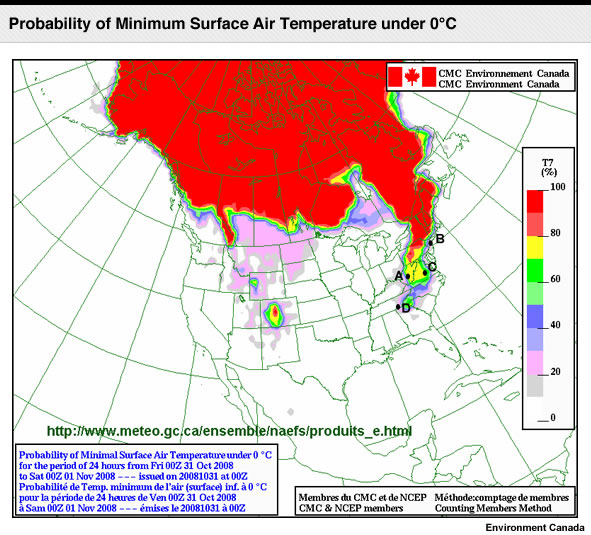
probability of exceedance diagram, 2-m temperature less than 0 degrees Celsius, 00 UTC 31 Oct 2008 run for 24-hours ending 00 UTC 01 Nov 2008
File Name:
question11.jpg
Credits:
Environment Canada
Copyright Terms:
COMET Standard Terms
of Use
Description:
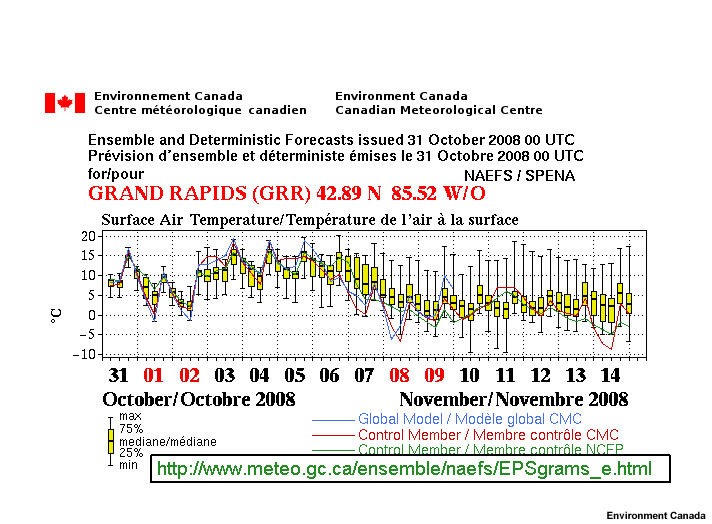
2-m temperature box and whisker diagram, Grand Rapids MI, 00 UTC 31 Oct 2008 run for 360 hours ending 00 UTC 15 Nov 2008
File Name:
question12.jpg
Credits:
Environment Canada
Copyright Terms:
COMET Standard Terms
of Use
Description:
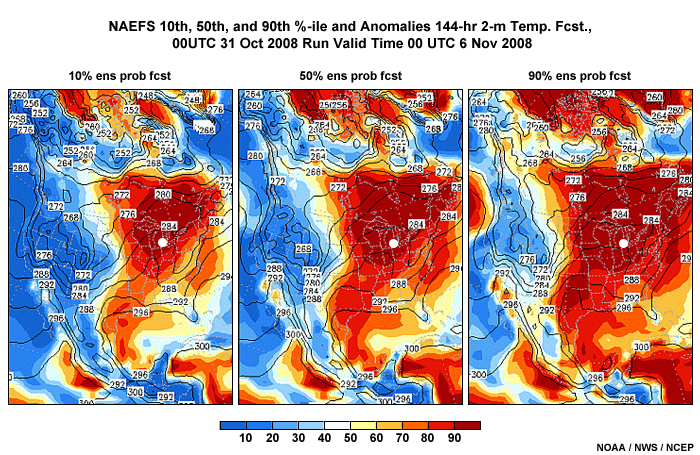
NAEFS 10th, 50th, and 90th percentile and anomalies 144-hour 2-m temperature forecast, 00UTC 31 Oct 2008 run valid time 00 UTC 6 Nov 2008
File Name:
question8.jpg
Credits:
NOAA/NWS/NCEP
Copyright Terms:
COMET Standard Terms
of Use

Description:
NAEFS 10th, 50th, and 90th percentile and anomalies 144-hour 2-m temperature forecast, 00UTC 31 Oct 2008 run valid time 00 UTC 6 Nov 2008
File Name:
question9.jpg
Credits:
NOAA/NWS/NCEP
Copyright Terms:
COMET Standard Terms
of Use