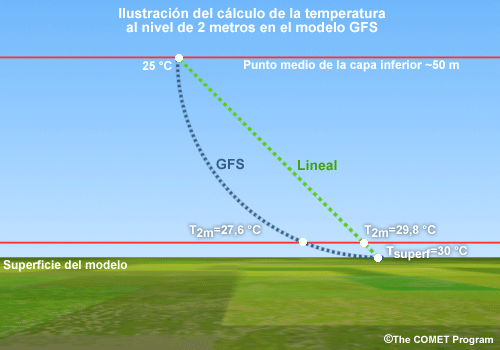
Description:
Illustration of 2-m temperature calculation in GFS model
File Name:
2m_t_interp2.gif
Credits:
©The COMET Program
Copyright Terms:
COMET Standard Terms of Use
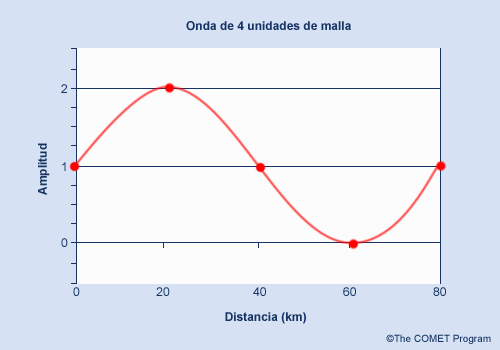
Description:
Example of a 4 Grid Length Wave
File Name:
4delta_simple.gif
Credits:
©The COMET Program
Copyright Terms:
COMET Standard Terms of Use
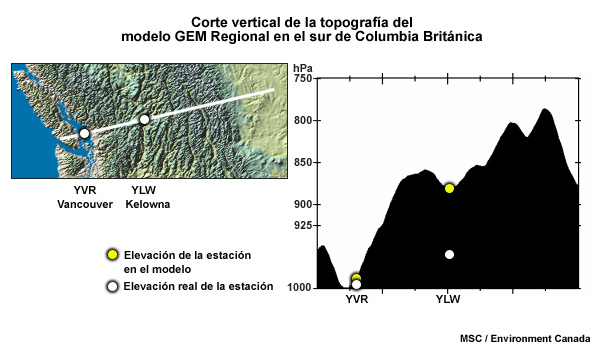
Description:
GEM Regional Cross-Section Location
File Name:
bc_xsection.gif
Credits:
MSC/Environment Canada
Copyright Terms:
COMET Standard Terms of Use
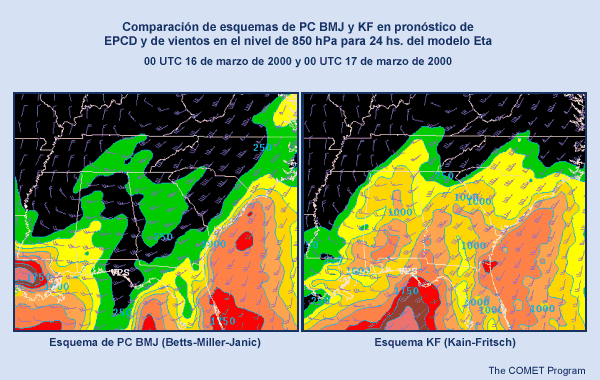
Description:
Comparison of BMJ to KF CP schemes in 24-hr Eta forecast of CAPE and 850-hPa winds.
File Name:
bmj_fk_compare.gif
Credits:
©The COMET Program
Copyright Terms:
COMET Standard Terms of Use
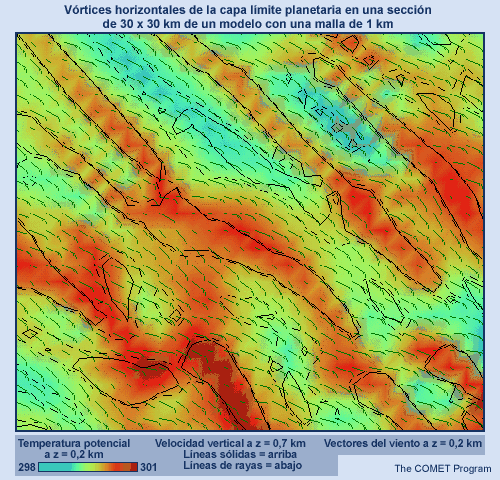
Description:
Boundary layer rolls on 30-km by 30-km section of 1-km grid model
File Name:
boundryroll.gif
Credits:
©The COMET Program
Copyright Terms:
COMET Standard Terms of Use
Description:
Boundary layer rolls on 30-km by 30-km section of 1-km grid model
File Name:
boundryroll.gif
Credits:
©The COMET Program
Copyright Terms:
COMET Standard Terms of Use
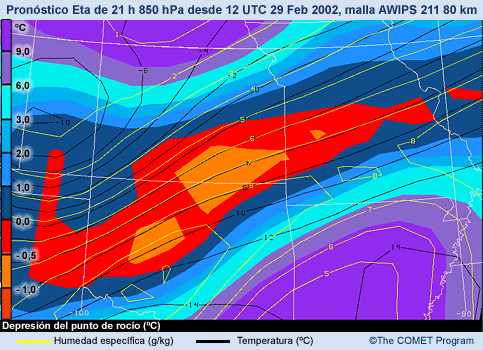
Description:
Eta 80-km AWIPS 211 Grid: showing 850 hPa temperatures, specific humidity, and dew point depression.
File Name:
eta_211.gif
Credits:
©The COMET Program
Copyright Terms:
COMET Standard Terms of Use
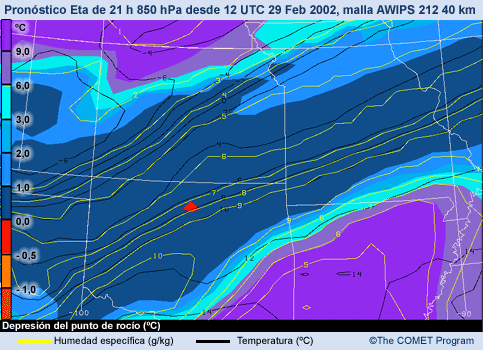
Description:
Eta 40-km AWIPS 212 Grid: showing 850 hPa temperatures, specific humidity, and dew point depression.
File Name:
eta_212.gif
Credits:
©The COMET Program
Copyright Terms:
COMET Standard Terms of Use
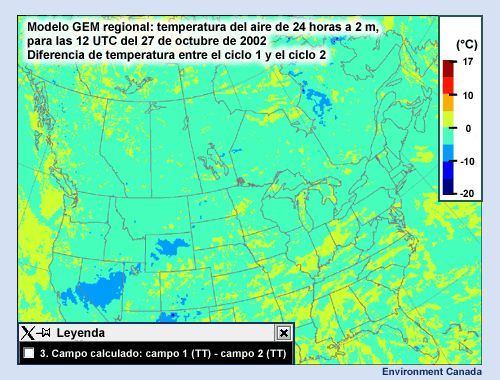
Description:
GEM Regional model output of 2 meter air tempratures, 12Z 27 October 2002 - Temperature Difference Between Run#1 and #2
File Name:
gem_airtemp_diff.gif
Credits:
Environment Canada
Copyright Terms:
COMET Standard Terms of Use
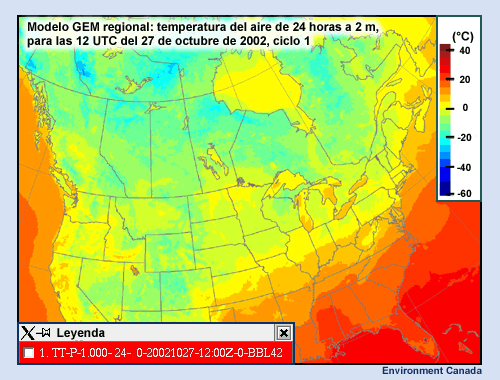
Description:
GEM Regional model output of 2 meter air tempratures, 12Z 27 October 2002 - Run #1
File Name:
gem_airtemp01.gif
Credits:
Environment Canada
Copyright Terms:
COMET Standard Terms of Use
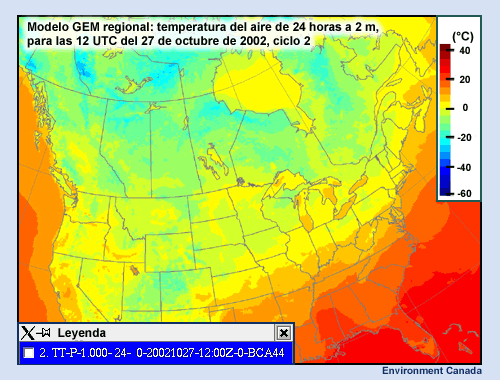
Description:
GEM Regional model output of 2 meter air tempratures, 12Z 27 October 2002 - Run #2
File Name:
gem_airtemp02.gif
Credits:
Environment Canada
Copyright Terms:
COMET Standard Terms of Use
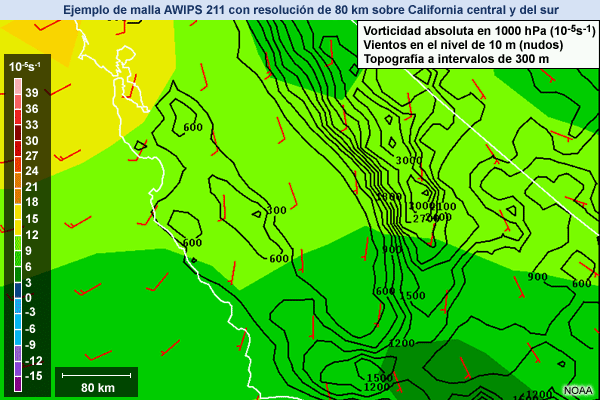
Description:
Example of AWIPS 80km Resolution 211 Grid over Central and Southern California
File Name:
grid211_80km.gif
Credits:
NOAA
Copyright Terms:
COMET Standard Terms of Use

Description:
Example of AWIPS 40km Resolution 212 Grid over Central and Southern California
File Name:
grid212_40km.gif
Credits:
NOAA
Copyright Terms:
COMET Standard Terms of Use
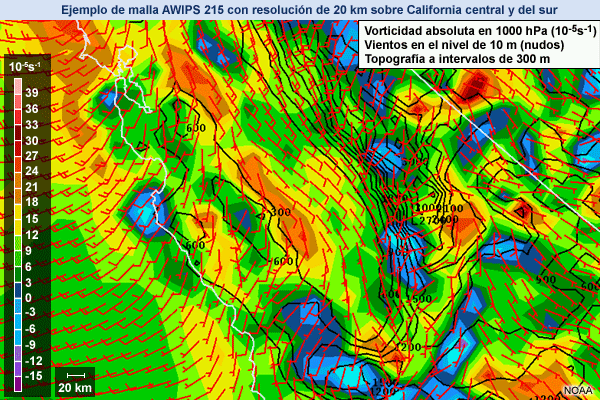
Description:
Example of AWIPS 20km Resolution 215 Grid over Central and Southern California
File Name:
grid215_20km.gif
Credits:
NOAA
Copyright Terms:
COMET Standard Terms of Use
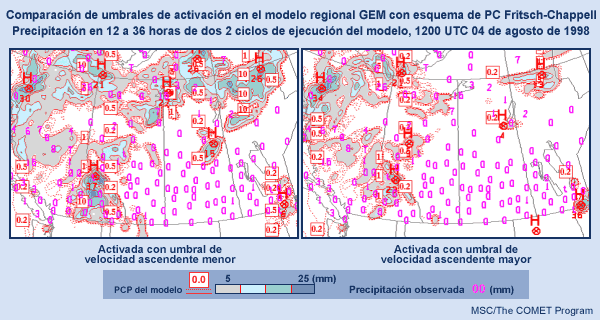
Description:
Comparison of triggering thresholds with Fritsch-Chappell CP scheme in GEM
File Name:
kf_threshold.gif
Credits:
MSC/The COMET Program
Copyright Terms:
COMET Standard Terms of Use
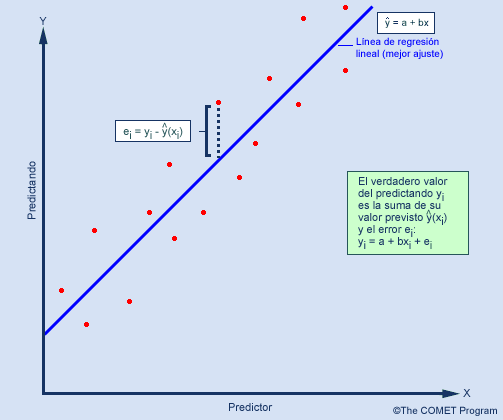
Description:
Overview of linear regression: In this scatter plot of values of predictand (y) versus predictor (x) is shown the best fit linear relationship between the two variables.
File Name:
linregrs_tencom.gif
Credits:
©The COMET Program
Copyright Terms:
COMET Standard Terms of Use
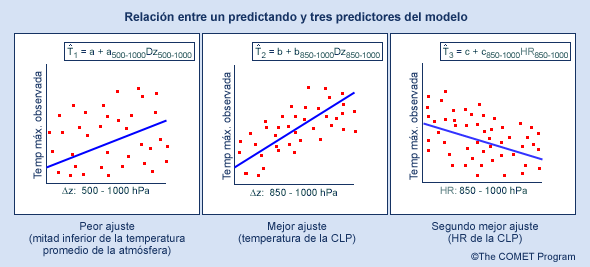
Description:
Relationship of a predicand to three model predictors as used in determining linear regression equations.
File Name:
mos_scatter.gif
Credits:
©The COMET Program
Copyright Terms:
COMET Standard Terms of Use
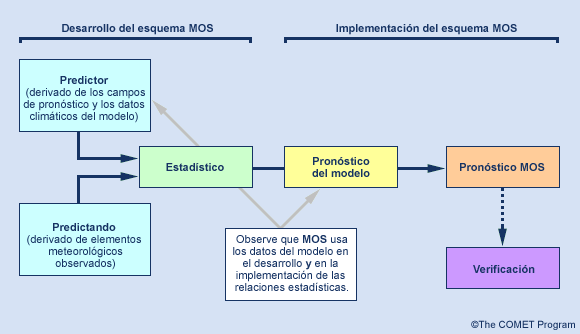
Description:
MOS development and implementation of forecast steps
File Name:
mosgraph_tencom.gif
Credits:
©The COMET Program
Copyright Terms:
COMET Standard Terms of Use
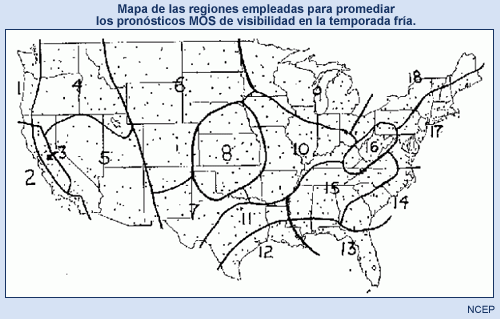
Description:
Map showing regions used to average for MOS visibiltiy forecasts in the cool season.
File Name:
mosregions_cool.gif
Credits:
NCEP
Copyright Terms:
COMET Standard Terms of Use
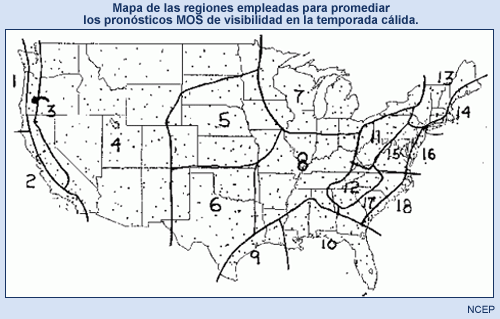
Description:
Map showing regions used to average for MOS visibiltiy forecasts in the warm season.
File Name:
mosregions_warm.gif
Credits:
NCEP
Copyright Terms:
COMET Standard Terms of Use
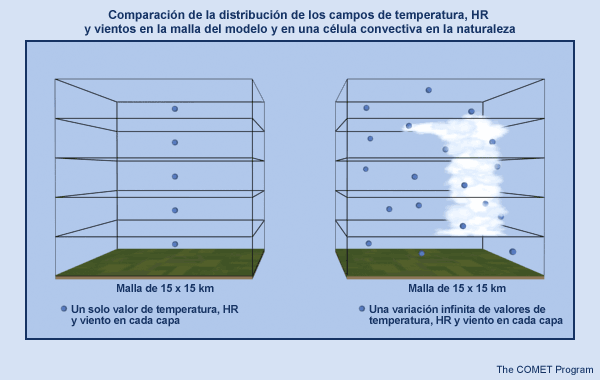
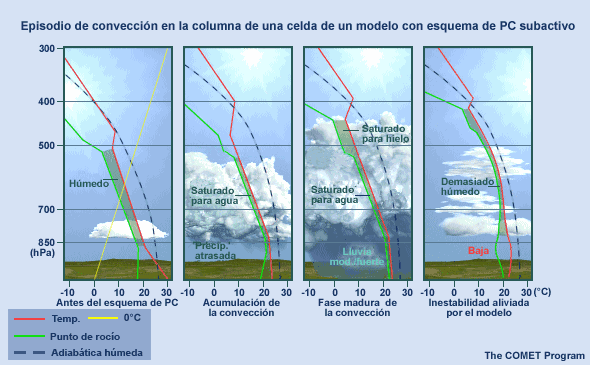
Description:
Distribution of temperature, RH and wind fields in model grid versus a convective cell in nature.
File Name:
nature_vs_model.gif
Credits:
©The COMET Program
Copyright Terms:
COMET Standard Terms of Use
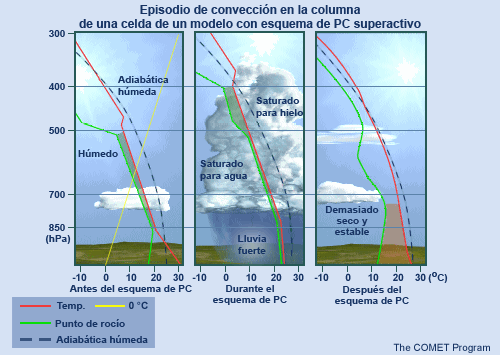
Description:
Convective event in model grid column with overactive CP scheme.
File Name:
overactive_cp.gif
Credits:
©The COMET Program
Copyright Terms:
COMET Standard Terms of Use
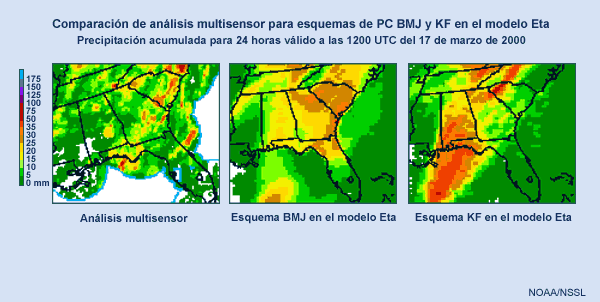
Description:
Comparison of multi-sensor anlysis to BMJ and KF CP schems in Eta model.
File Name:
qpf_compare.gif
Credits:
NOAA/NSSL
Copyright Terms:
COMET Standard Terms of Use
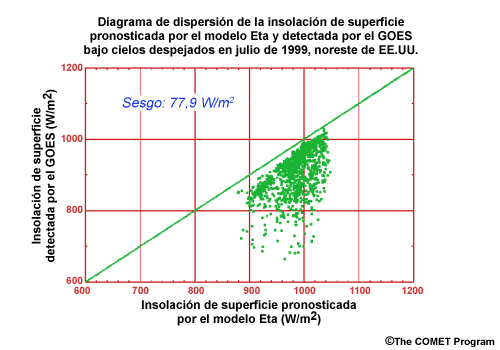
Description:
Scatter plot of Eta vs. GOES Surface Insolation under clear sky, Northeastern U.S. July 1999
File Name:
rad_insolation.gif
Credits:
©The COMET Program
Copyright Terms:
COMET Standard Terms of Use
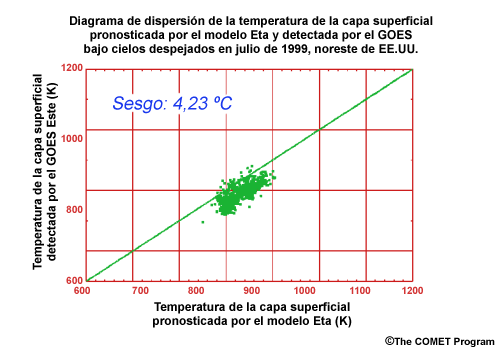
Description:
Scatter plot of Eta vs. GOES Measured Skin Temperature under clear sky, Northeastern U.S. July 1999
File Name:
rad_skintemp.gif
Credits:
©The COMET Program
Copyright Terms:
COMET Standard Terms of Use
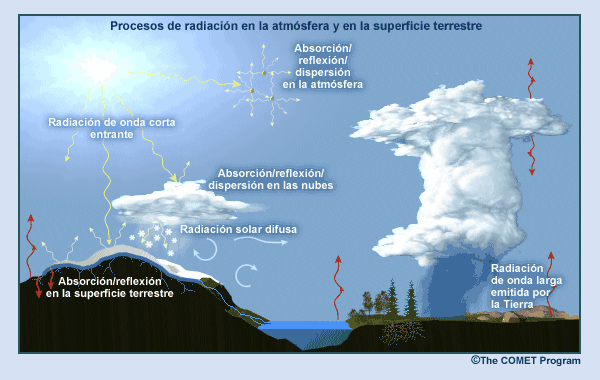
Description:
Graphic showing idealized radiation scattering and absorbtion in the atmosphere and at Earth's surface.
File Name:
radiation_processes.gif
Credits:
©The COMET Program
Copyright Terms:
COMET Standard Terms of Use
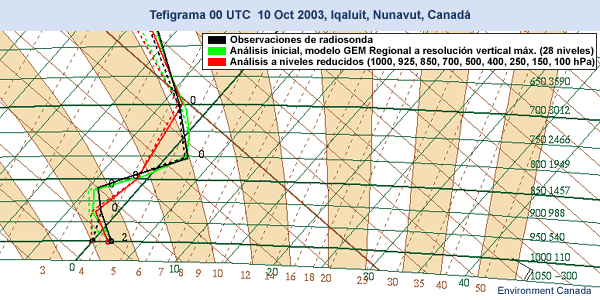
Description:
Tephigram 00 UTC 10 Oct 2003, Iqaluit, Nunavut
File Name:
tephi_01.gif
Credits:
Environment Canada
Copyright Terms:
COMET Standard Terms of Use
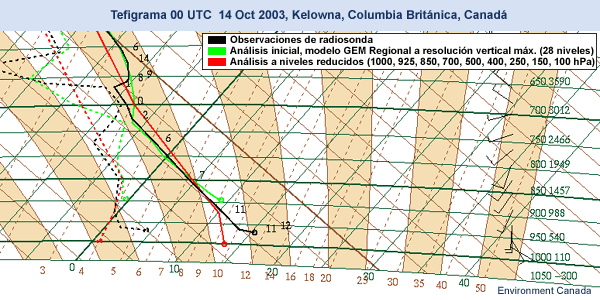
Description:
Tephigram 00 UTC 14 Oct 2003, Kelowna, B.C.
File Name:
tephi_02.gif
Credits:
Environment Canada
Copyright Terms:
COMET Standard Terms of Use
Description:
Convective event in model grid column with underactive CP scheme.
File Name:
underactive_cp.gif
Credits:
©The COMET Program
Copyright Terms:
COMET Standard Terms of Use
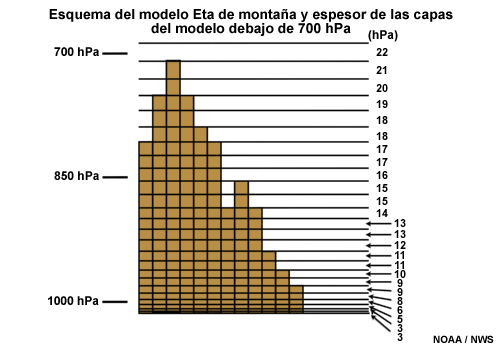
Description:
Vertical Resolution Used in Eta Model Below 700 hPa
File Name:
vert_res_eta.gif
Credits:
NOAA/NWS
Copyright Terms:
COMET Standard Terms of Use
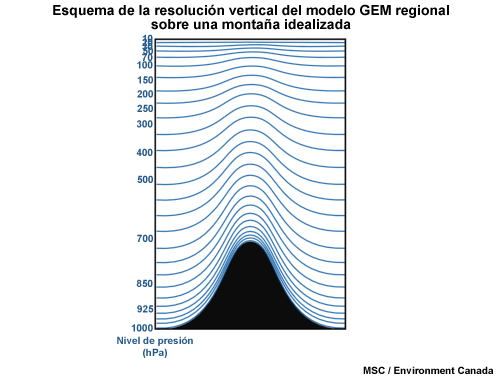
Description:
Vertical Resolution Used in GEM Model
File Name:
vert_res_gem.gif
Credits:
MSC/Environment Canada
Copyright Terms:
COMET Standard Terms of Use