Supporting Topics
General Reference Material
- Maps
- MSC References
Microphysics Review
- The Ice Crystal Process
Precipitation Type Forecasting
- Models and Precipitation Type
Lake Effect Snow:
Maps:
- Political Map of Canada
-
- Canadian Maritime Provinces
-
- New Brunswick Area Relief Map
-
- New Brunswick Forecast Regions
-
MSC References
- Precipitation Types and MSC Warning Criteria
-
Precipitation Types and MSC Warning Criteria Precipitation Type Warning Criteria Heavy Snowfall 15 cm or more in a 24-hour period Heavy Winter Rainfall (winter with frozen ground) 25 mm in a 12-hour period Freezing Rain 4 hours or more of continuous freezing rain A warning can be issued for shorter duration events if public safety is a concern. Freezing Rain 7 hours or more in duration
Microphysics Review
The Ice Crystal Process
- Winter Clouds: Supercooled Droplets or Ice Crystals
-
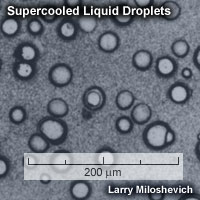
The Behaviour of Water at Low Temperatures
Though bodies of liquid water freeze when their temperatures reach slightly below 0°C, water droplets in clouds behave quite differently. Observations in clouds have shown that at -10°C it is possible to have only 1 ice crystal per 1 million liquid water droplets. At -20°C, the ratio of ice to liquid can be less than 50%, yet some operational studies note a predominance of ice at these temperatures. In laboratory experiments, cloud temperatures can reach -40°C before all water droplets are found as ice crystals (Pruppacher and Klett, 1979). Water droplets that are found in temperatures below freezing are referred to as supercooled. Regions of a cloud transformed to ice crystals, where the cloud is saturated with respect to ice, are said to be glaciated.
Cloud Phase Transition: Glaciation
In mixed-phase clouds, glaciation, the transition in the cloud of supercooled liquid to ice, generally takes place rapidly. Glaciation tends to begin in the highest (coldest) part of the cloud, where ice is nucleated, and then work downward as ice crystals become larger and heavier and fall into the lower levels of the cloud. This increases the number of ice crystal surfaces available and further depletes the amount of water vapor in the cloud.
Glaciation can be initiated by conditions within the cloud or can result from clouds above the supercooled cloud seeding ice from above. This seeder/feeder effect is most prevalent with mid- or upper-level cirrus, cirrostratus, or alto-type clouds seeding lower-level stratus and stratocumulus clouds.
- Initiation if Ice Crystals: The Nucleation Process
-
The Bergeron-Findeisen Process
The Bergeron-Findeisen process describes how ice crystals grow at the expense of supercooled water droplets in a water-saturated environment. This process is of particular importance in mid- to high latitudes where clouds routinely extend upward to subfreezing temperatures. Determining the ratio of supercooled droplets to ice crystals and the rate at which a cloud becomes glaciated aids a forecaster's ability to predict winter precipitation types and amounts. Making these determinations is based on an understanding of the Bergeron-Findeisen process.
In 1911, Alfred Wegener, a geologist and originator of the theory of continental drift, originally proposed a theory of ice crystal growth based on the difference in saturated water-vapor pressure between ice crystals and supercooled water droplets. In the 1930's, the Swedish meteorologist Tor Bergeron and the German meteorologist Walter Findeisen contributed further to the theory which became known as the Bergeron-Findeisen process.
Two Types of Nucleation Processes
In order for ice crystals to form in clouds, the water molecules making up the vaporous cloud droplets need a substrate on which to begin the formation of an ice crystal lattice. The initiation of this process can take place by homogeneous or heterogeneous nucleation.
Homogeneous nucleation
Homogeneous nucleation takes place at very cold temperatures in the absence of any ice-forming nuclei (IN). Nucleation takes place as water molecules within a droplet are cooled sufficiently to begin forming minute ice structures, called ice embryos. Surrounding molecules attach themselves to these ice embryos and add to the growing crystal lattice. This structure is prone to disruption due to thermal agitation, an event that is more likely to occur in smaller drops. Thus, the smaller the size of the droplet, the lower the freezing temperature needed to form ice crystals.
Laboratory studies have shown that 5-µm diameter droplets of pure water don't freeze until their temperature is brought down to -40°C. Larger droplets of 25 µm in diameter freeze at -36°C, a slightly warmer temperature due to the larger size of the droplet. This implies that any cloud at temperatures below -40°C will consist purely of ice crystals. From a forecasting perspective, due to the glaciating process, supercooled liquid droplets are relatively rare below -20°C.
Early on in the study of modern meteorology, homogeneous nucleation was ruled out as the prevalent process of ice crystal formation in the atmosphere. Based on observations of the amount of ice crystals found in most clouds and mean temperatures that are too high to support homogeneous nucleation, other processes for initiating freezing need to take place.
Heterogeneous nucleation
Heterogeneous nucleation is the predominant process of ice crystal initiation in the atmosphere. It takes place due to the presence of ice-forming nuclei (IN) in saturated, sub-freezing environments. There are 3 types of heterogeneous nucleation:
Deposition
Water vapor condenses as ice directly onto IN surfaces without passing through the liquid phase.Freezing
IN contained within a droplet initiate freezing within that droplet.Contact
IN initiate ice crystal formation upon contact with a droplet. This occurs through the collision of supercooled droplets with IN.
- Ice Forming Nuclei, Activation Temperatures and Impacts of RH
-
Common IN and their Activation Temperatures
As with cloud condensation nuclei (CCN), ice-forming nuclei (IN) are available in the atmosphere but at fairly low concentrations. IN are hygroscopic (water attracting) molecules. According to Rogers (1979), IN provide a hexagonal lattice structure resembling natural ice. However, they are not active until they reach a particular temperature below 0°C. As the temperature drops, more of these nuclei become active to initiate ice crystal formation. Thus, the concentration of active IN rises as the temperature drops.
Common IN and their Activation Temperatures Substance Activation Temperature (°C) Prevalence leaf bacteria -2.9found in decaying leaf matter, possibly a prevelant source of IN silver iodide -4used for artificial cloud seeding kaolinite -9common clay mineral copper sulphide -7pollutant sodium chloride -8sea water volcanic ash -13common aerosol vermiculite -15common clay mineral Relative Humidity and IN Activation
The amount of IN activated in clouds increases with relative humidity (RH). Lowering the temperature of a cloud, which raises relative humidity, increases the number of activated IN. Therefore, heterogenous nucleation is more likely to occur in the coldest regions in a cloud, typically towards the top.
- Ice-Crystal Growth
-
Three Ice Crystal Growth Processes
Once an ice crystal has formed, it can grow through several processes:
- diffusion deposition
- accretion
- aggregation
Depending on the temperatures and saturation levels in the cloud, the ice crystal can grow in various forms, or crystal habits. Of course, if the ice crystal travels to areas warmer than 0°C, it can also melt.
Ice Crystal Growth by Diffusion Deposition
Diffusion deposition occurs due to differences in the saturation vapor pressure between ice and liquid water. At a given temperature, the vapor pressure over a water surface is greater than that over an ice surface. If water droplets and ice crystals exist in the same environment (called mixed phase conditions), a vapor pressure gradient develops between the droplets and crystals. Due to this gradient, water vapor moves from the higher pressure surrounding the droplets to the lower pressure surrounding the crystals. Thus, the ice crystals grow at the droplets' expense. This process creates sub-saturation with respect to water, and the droplets evaporate to maintain water saturation, making additional water vapor available for ice crystal growth. Eventually the pool of liquid water diminishes and the cloud becomes glaciated.
The process of growth by deposition can also take place in a setting that is supersaturated with respect to ice as the ice crystals continue to grow through deposition of the free water vapor surrounding the ice crystals.
The rate of growth of ice crystals is most directly influenced by temperature and humidity. Lowering the temperature of a cloud causes conversion to ice and existing ice growth to speed up at the expense of any available liquid water.
The rate of diffusion is highest where the difference between the saturation vapor pressure between ice and supercooled liquid water is greatest. Optimal growth rates occur near -15°C.
Ice Crystal Growth by Accretion (Riming)
In a process called accretion, ice crystals can grow via collision with supercooled droplets. The supercooled droplet freezes on contact and sticks to the original ice crystal to form rime ice. This process is optimal in saturated layers with temperatures of 0 to -10°C (Staudenmaier, 1999). Excessive riming eventually results in the formation of graupel or snow pellets.
As ice crystals grow by accretion, rapid freezing of droplets can result in shattering to form multiple tiny ice particles. This process is called splintering and is a secondary source of ice-forming nuclei (IN). This can then speed up the accretion process and glaciation of the cloud.
In summer convective storms, hail is formed as heavily-rimed ice crystals are continuously swept up into regions of supercooled drops in the convective cloud, growing in the cycling process until their weight overcomes the updrafts.
Ice Crystal Growth by Aggregation
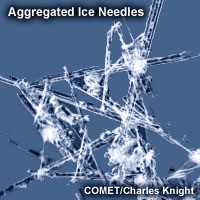
As ice crystals grow and collide, they can stick to each other in a process called aggregation. Liquid molecules on the outer surface of the crystals serve to increase bonding between two colliding crystals. As the crystal moves through warmer regions in the cloud, there will be more liquid molecules on the outside of the crystal, and larger aggregations can build to form large snowflakes. Stickiness is maximized at or near 0°C.
Crystals with dendritic characteristics can also mechanically interlock to form larger aggregates (Pruppacher and Klett, 1979).
- Ice/Snow Crystal Habits
-
Effect of Temperature on Crystal Habits
The crystal habit, or shape, of a growing ice crystal is determined by the temperature and associated saturation vapor pressure difference between ice and supercooled water. The following chart and graph illustrate the habits that form at various temperatures at saturation with respect to liquid water.
1.5.2 Ice/Snow Crystal Habits at Various Temperatures
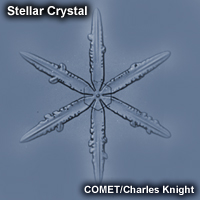
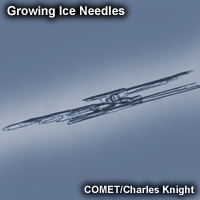
Ice/Snow Crystal Habits at various temperatures at saturation with respect to liquid water
Initiation temperature (°C) Crystal Habit 0 to -4thin plate  -3 to -6
needles  -6 to -10
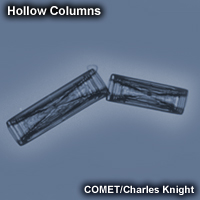
hollow columns 
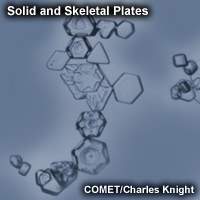
-10 to -12solid plates
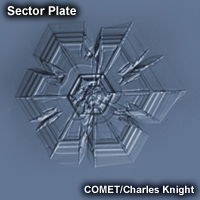
sector plates
broad-branch plates

 -12 to -16
dendrites
(as well as most plates) -16 to -22
solid plates
sector plates
broad-branch plates
-22 to -40solid columns
hollow columns
bullet rosette

Common Crystal Habits and Formation Conditions
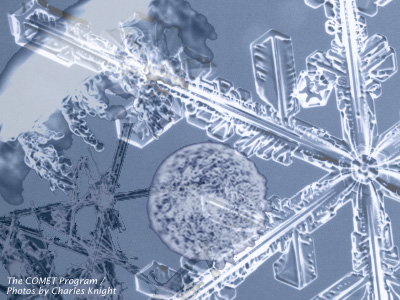
Underlying Shape: the Hexagon

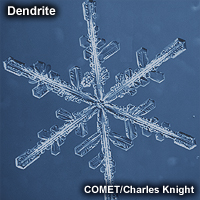
A common element of most ice crystal habits is the underlying hexagonal shape. Whether formed in cold temperatures as hollow columns or in relatively warmer temperatures as dendrites, the underlying structure of the crystal is hexagonal. The hexagonal arrangement can be attributed to fundamental physical parameters of water molecules as they are cooled and take on their lowest energy form. The hexagonal configuration maximizes attractive forces between the molecules while minimizing repulsive ones.
The dendrite form is the most intricate and can be attributed to the local differences in the vapor pressure along the six outer points versus the inner edges of the crystal. Since conditions are the same at each point, this difference leads to further build up of the crystal along the points in a symmetrical fashion. The dendritic habit is most prevalent in the temperature ranges with greatest excess water vapor pressure with respect to ice, between -10 and -15°C.
- Operational Significance of Ice-Crystal Process
-
Ratio of Supercooled Cloud to Mixed Phase
Operationally, knowledge of the ice crystal process can help in forecasting precipitation type and amount and is essential in making aviation icing forecasts. The following topics summarize the operational implications of the ice crystal process.
Within clouds, at temperatures warmer than -10°C, supercooled liquid can be expected most often. Generally, with decreasing temperature, the likelihood of the cloud containing ice increases. At -20° C, fewer than 10% of the sampled clouds consisted entirely of supercooled liquid.
Optimal Temperatures and Conditions for Ice Crystal Initiation and Growth
Observation and laboratory experiments indicate that the optimal conditions for ice crystal initiation and growth are in cloud layers that are saturated with respect to liquid water, and thus supersaturated with respect to ice, with temperatures in the -10 to -18°C range.
Potential Presence of Ice Crystal Initiation
Potential presence of ice crystal initiation in clouds based on temperature Temperature (°C) Potential presence of ice initiation 0no initiation -4no initiation -1060% chance of initiation and presence of ice -1270% chance of initiation and presence of ice -1590% chance of initiation and presence of ice -20100% chance of initiation and presence of ice AWIPS can be used to highlight the liquid-to-ice temperature range in cloud tops. Based on cloud-top temperature, and the color regimes in the table below, the presence of ice in cloud tops can be determined through the use of IR.
Enhancement Color
Temperature Deg (°C)
Ice or Liquid
Optimal AWIPS color choices (RGB values)
Yellow 0 to -8 Liquid 255 255 0 Blue
-8 to -10
Likely Liquid
0 0 200
Light Blue
-10 to -12
60% Chance Ice is there
0 100 150
White
-12 to -15
70% Chance Ice is there
255 255 255
Pink
-15 to -20
90% Chance Ice is there
250 0 160 (-15°C)
interpolated to
250 80 170 (-20°C)Black to White
-20 or less
ICE is there!
0 0 0 (-20°C)
interpolated to
255 255 255
(coldest temp)
Dendrite Zones and Heavy Snowfall
Regions of the atmosphere where upward vertical motion coincides with temperatures favorable for dendritic growth (-12 to -16°C with high RH values) are strongly correlated with heavy snowfall. Crystal growth rates and aggregation are maximized in these dendritic growth zones. Upward vertical motion in regions of high RH replenishes the supply of supercooled liquid water droplets and thus enables rapid dendrite growth to continue.
This cross section from Pueblo, Colorado to Cheyenne, Wyoming on 25 October 1997 shows an example of this effect. Heavy snows were observed in the Denver area, the central region of this cross section. Relative humidity throughout this region was > 90% at the time. Note the location of high vertical velocity both within and above the -12 to -16°C layers. In the layers above, where vertical velocity is highest and temperatures are lower (-17 to -20°C), smaller crystals would be forming and falling through the dendritic zone below, rapidly growing through aggregation and developing into larger dendrites.
Aviation Icing Threat
The presence of cloud layers composed of supercooled liquid poses a potential icing threat to aircraft passing through those layers. Cloud layers consisting of ice particles pose no icing threat.
Use of GOES 3.9 to Determine Cloud Phase
Clouds consisting of ice particles can be distinguished from clouds consisting of supercooled water droplets through examination of the GOES 3.9-µm infrared imagery. At this wavelength, reflectance by water droplets is much greater than the reflectance from ice particles. Therefore, lower clouds (stratus or stratocumulus) containing water droplets appear white, while the higher clouds (cirrus) containing ice particles appear dark. This is opposite from the normal appearance of high and low clouds on a channel-4 IR image. In this image, lower-level water droplet clouds are evident over northeast Wyoming, while higher-level ice crystal clouds are evident over southwest Wyoming, northern Colorado, and South Dakota.
It is important to note that upper-level ice clouds can obscure lower-level supercooled liquid clouds in satellite images.
- References
-
Ahrens, C. Donald, 2000: Meteorology Today, An Introduction to Weather, Climate, and the Environment. Brooks/Cole Thomson Learning, 182-199 pp.
Baumgardt, Dan, Science Operations officer, NWS, La Cross WI., 1999: Wintertime Cloud Microphysics Review, online presentation materials, http://www.crh.noaa.gov/arx/micrope.htm
NOAA Snow Monitoring website: https://www.ncdc.noaa.gov/snow-and-ice/daily-snow/
Pruppacher, H.R., and J.D. Klett, 1978: Microphysics of Clouds and Precipitation. D. Reidel Publishing Company, Boston, 714 pp.
Rodgers, R.R., 1979: A Short Course in Cloud Physics, 2nd Edition. Pergammon Press, New York, 116-133 pp.
Staudenmaier, Michael Jr. - NWSO Flagstaff, AZ Western Region technical Attachement, No. 99-12, June 22, 1999: The Importance of Microphysic in Snowfall: A Practical Example.
Precipitation Type Forecasting
Models and Precipitation Type
- GEM Regional Model Information
-
I MSC offices, the Canadian GEM Regional Model is the Primary NWP forescast tool. It is run twice daily at 0000 and 1200 UTC.
For detailed information on the GEM Regional and ther NWP models, please see the COMET website:
Operational Models Encyclopedia
- Model Algorithms
-
Bourgouin Algorithm
This algorithm determines if there is sufficient energy to melt or freeze hydrometeors. Positive and negative areas in the model sounding are computed, bounded by the 0ºC isotherm and the environmental temperature curve > 0ºC and < 0ºC, respectively. The precipitation type (snow, freezing rain, ice pellets, or rain) is determined by the magnitude of the positive and negative areas. In cases where two precipitation types are determined to be of equal likelihood, one or the other is chosen randomly. The thresholds were determined using cold-season case study soundings from throughout North America during 1989-90 and 1990-91. Since the algorithm is based on observed soundings across a broad area, it can use output from any NWP model and be applied to any region, and is only dependent on the accuracy of the forecast model sounding.
Baldwin Method and Algorithm
The Baldwin algorithm determines precipitation type from a observed vertical sounding using variables (e.g., temperatures at surface and aloft) that play a significant role in hydrometeor melting and freezing. Warm (> 0ºC) and cold (< 0ºC) layers aloft are identified by calculating areas bounded by the 0ºC isotherm and the sounding wet-bulb temperature (Tw). Warm and cold areas are calculated individually and are used in combination with surface temperature to identify precipitation type. Initially the algorithm identifies the highest saturated layer as the precipitation generation region and in turn determines if that precipitation originates as supercooled water or ice. The precipitation type diagnosis depends on the surface temperature, the coldest temperature in a saturated layer, and the magnitude of areas bounded by the sounding Tw curve and certain temperature thresholds (e.g., 0ºC, -4ºC).
Czys Algorithm
The Czys algorithm (Czys et al. 1996) was primarily constructed to distinguish ice pellet and freezing rain environments. Simple modifications allow additional diagnoses of environments favoring rain or snow. The precipitation type determination depends on the ratio (t) of the time that a sphere of ice resides in a warm layer (based on an empirically-derived particle size and terminal fall velocity and the average depth pressure and Tw of that layer) to the time it takes to achieve complete melting. Partial melting is assumed to occur if t is between 0 (no melting) and 1 (complete melting). The Czys algorithm determines ice pellets will occur for any surface temperature (Ts) where 0 < t < 1, freezing rain for t > 1 and Ts < 0ºC, and snow for t=0.
Ramer Algorithm
The Ramer algorithm (Ramer 1993) determines precipitation type using vertical profiles pressure, temperature, relative humidity and Tw. The initial phase of precipitation is determined based on the wet-bulb temperature of the highest saturated level, which is assumed to be the precipitation generation zone. Ramer's algorithm determines a fraction of ice (I) at the ground using an empirically-derived relationship based on 2084 soundings from a variety of cool-season precipitation events. If I falls between 0 (liquid) and 1 (solid), then partial melting has occurred. Ice pellets are diagnosed if I > 0.85, freezing rain if I < 0.04 and surface Tw < 0 , rain if I < 0.04 and surface Tw > 0, and snow if no melting occurs. Mixed precipitation is diagnosed if 0.85 > I > 0.04.
References
Baldwin , M., R. Treadon, and S. Contorno, 1994: Precipitation type prediction using a decision tree approach with NMCs mesoscale eta model. Preprints, 10 th Conf. On Numerical Weather Prediction, Portland , OR , AMS, 30-31.
Bourgouin, Pierre 2000: A Method to Determine Precipitation Types, Weather and Forecasting 15: 583-592.
Cortinas, John V. and Michael E. Baldwin, 1999: A PRELIMINARY EVALUATION OF SIX PRECIPITATION-TYPE ALGORITHMS FOR USE IN OPERATIONAL FORECASTING, Proceedings, 6th Workshop on Operational Meteorology, Halifax, Nova Scotia, Environment Canada, December 1999, 207-211.
Czys, R., R. Scott, K.C. Tang, R. W. Przybylinski, and M. E. Sabones, 1996: A physically based, nondimensional parameter for discriminating between locations of freezing rain and ice pellets. Wea. Forecasting, 11, 591-598.
Ramer, J., 1993: An empirical technique for diagnosing precipitation type from model output. Preprints, 5 th International Conf. On Aviation Weather Systems, Vienna , VA , AMS, 227-230.
- NWP and Near-Surface Variables
-
For precipitation type model forecasts, limitations on how NWP models handle near-surface variables can play a big factor.
Potential errors can come from several different sources:
- The procedure used may not accurately reflect the vertical profile;
- There may be errors in fields such as skin temperature in the surface physics package;
- The effects of unresolved terrain and other unresolved surface features can not be accounted for;
- Relatively large interpolation distances can result in greater errors; and
- Model terrain representation in the mountains can cause problems because of inaccurate model terrain height.
For detailed information on the limitations of near-surface variables in NWP models, please see the COMET website:
Ten Common NWP Misconceptions
Partial Thickness Analysis
- Overview of Partial Thickness Method
-
Partial thickness analysis, or thickness correlation, can be useful in identifying precipitation phase. A layer's thickness, or depth, is proportional to its average virtual temperature. Which means that thickness can represent a thermal field through a layer in the troposphere. The greater the relative thickness of the layer, the warmer the thermal field. Comparing these thick nesses to known precipitation type thresholds provides valuable precipitation type information. In addition, the temperature, wet bulb temperature, and dewpoint at various levels can be correlated with precipitation phase at the surface.
Steps to assess partial thickness include:
- Assess cloud depth and determine if multiple precipitation types are possible.
- Utilize partial thickness thresholds for various precipitation type scenarios. Refer to thickness thresholds for each preciptiation type at the various pressure-defined layers.
- When considering an actual forecast, other factors not addressed by the partial thickness approach need to be taken into account such as latent heat release, multiple inversions and intervening dry layers.
- Cloud Thickness and Precipitation
-
An assessment of cloud thickness can help determine precipitation potential, type, and rate. The following table summarizes the relationship between cloud thicknesses and the corresponding precipitation. This information is useful when the cloud layer depth is relatively small. If the cloud layer is deeper than 3000 m, then the partial thickness rules of thumb should be considered.
Guidelines relating cloud thickness to precipitation potential, type, and rateCloud thickness (m)
Precipitation type
0-400 None 400-1000 Drizzle or freezing drizzle 1000-2500 Intermittent precipitation 2500-3300 Moderate precipitation > 3300 Moderate to heavy precipitation
- Thresholds for Rain/Snow Boundary
-
Thresholds have been collected for key layer thicknesses and precipitation types. Assessing these can help determine the location of precipitation type boundaries. The following table presents the rules of thumb for determining the rain/snow boundary at sea level in a non-marine environment in North America. For the given layers, areas to the cold side of the corresponding thickness are likely to be producing snow.
At a higher elevation these threshold thicknesses need to be adjusted upward than those shown in the table. This adjustment needs to be greater as the surface elevation increases. In a marine environment, generally the threshold thicknesses are slightly lower due to the marine influence on low-level temperatures.
Thicknesses generally corresponding to the location of a rain/snow boundary in a non-marine environment in North America Layer (hPa) Thickness (m) 1000-500 5400 1000-700 2840 ( ± 20) 1000-850 1290 850-700 1540 850-500 4100 700-500 2560
- Thresholds for Rain/Freezing Rain or Ice Pellet Boundary
-
Thickness thresholds for rain/freezing rain or rain/ice pellet boundaries for two critical layers, 1000-850 and 850-700 hPa are listed here. Areas to the cold side of the 1000-850 thickness and to the warm side of the 850-700 thickness are likely to be producing frozen precipitation. Depending on elevation and maritime influences, these thresholds need to be adjusted.
Thicknesses generally corresponding to the location of a rain/freezing rain or ice pellet boundary Layer (hPa) Thickness (m) USA 1000-850 < 1295 850-700 > 1555 Ontario 1000-850 < 1314 ± 6 850-700 > 1541 ± 7 Maritimes 1000-850 < ~1300 850-700 > 1540
- Application
-
Applying the Maritimes' threshold thicknesses to the following example demonstrates an operational application of the partial thickness technique.
- References
-
Baumgardt, D., 1999: Wintertime cloud microphysics review. SOO NWS La Crosse, WI
Byers, H. R., 1965: Elements of Cloud Physics. University of Chicago Press, 191 pp.
Czys, Robert R., Robert W. Scott, K.C. Tang, Ronald W. Przybylinski, Michael E. Sabones, 1996: A Physically Based, Nondimensional Parameter for Discriminating between Locations of Freezing Rain and Ice Pellets. Weather and Forecasting: 11, 591–598.
Heppner, Paul O.G., 1992: Snow versus Rain: Looking beyond the "Magic" Numbers. Weather and Forecasting: Vol. 7, No. 4, 683-691.
Houghton, David D. 1985: Handbook of Applied Meteorology. Wiley Press, New York.
Rogers, R. R. and M. K. Yau, 1989: A Short Course in Cloud Physics. 3rd ed., Pergammon Press.
Top-Down Method
- Overview of the Top-Down Method
-
The objective of the top-down approach is to trace a hydrometeor from its source to the surface in order to determine its final precipitation type. This approach starts at the top of the environmental sounding and works down towards the ground.
During a precipitation event where multiple precipitation types are possible, there are usually three critical layers to examine. They are:
Layer Air Mass Impact on Hydrometeor Ice Producing Layer cold, midlevel air mass ice crystal nucleation/growth Warm Layer elevated, warm tropical air mass warming/melting Cold Surface Layer surface arctic or modified air mass refreezing/contact freezing In addition, the depth of cloud layers also gives some indication of the types of precipitation being produced.
Each of these layers should be examined to help assess the precipitation type at the surface. In this sample sounding, what precipitation type will be falling at ground level? This example shows freezing rain or ice pellets.
- The Ice Producing Layer
-
The purpose of analyzing the upper air layer is to diagnose whether or not significant numbers of ice crystals are present in a cloud. The quantity of ice crystals contained in a cloud is a function of the cloud temperature. The colder the cloud temperature, the more likely it is that there are ice crystals present. A temperature threshold of -10°C is a good cutoff point for a considerable chance of ice being introduced into a cloud via ice nuclei (IN) activation. There should be a fairly moist layer with temperatures below -10°C for this scenario.
From detailed studies of various locations around the world, the following guidelines have been established:
Potential presence of ice crystal initiation in clouds based on temperature Temperature (°C) Potential presence of ice initiation 0no initiation -4no initiation -1060% chance of initiation and presence of ice -1270% chance of initiation and presence of ice -1590% chance of initiation and presence of ice -20100% chance of initiation and presence of ice Note: For near-ocean sites, increase these temperatures 2-3ºC due to the presence of sea-salt nuclei.adapted from Baumgardt 1999
- The Elevated Warm Layer
-
In considering the elevated warm layer, usually caused by an advancing warm front, studies looked at both the depth of the warm layer and the layer's maximum temperature. Rauber et al. (2001) found a correlation coefficient of > 0.80 for 820 soundings in the U.S. east of the Rocky Mountains between the depth of warm layers with a temperature > 0ºC and the layer maximum temperature. As the depth of the warm layer increases so does the maximum temperature, and the relationship is nearly linear. The warm layer maximum temperature is easier to assess in the operational environment than the layer depth.
Critical warm layer maximum temperatures for determining precipitation type depending on whether or not ice is present in the cloud are given in the figure below (Baumgardt 1999)
Warm layer max. temperature (ºC) Precipitation type with ice introduced Precipitation type without ice introduced < 1snow freezing rain/drizzle 1 to 3snow/ice pellets mix (1ºC) to ice pellets (3ºC) freezing rain/drizzle > 3freezing rain/drizzle freezing rain/drizzle Note: The conditions described in this table are based on the assumption that general conditions for a precipitation event of some type are in place. So if ice crystals are introduced from above the warm layer, here are some possibilities:
Some key points to keep in mind for elevated warm layers:
- A warm layer with a maximum temperature of 1°C or less will not be warm enough to melt the snow/ice falling into it from above. Thus, no hydrometeor phase change will result, and the ice crystals will survive the fall through the warm layer.
- For a warm layer with a maximum temperature between 1 and 3°C, the snow/ice will not melt completely. Many or all of the partially frozen hydrometeors will refreeze in the cold surface layer below. With temperatures closer to 3ºC, the resulting precipitation below will more likely be ice pellets. With temperatures in the 1 to 2 ºC range, there is a greater potential for a mix of snow and ice pellets.
- A warm layer with a maximum temperature greater than 3°C will cause the snow/ice to completely melt, resulting in rain if surface temperatures are >0ºC or freezing rain if surface temperature are at or below 0°C.
- If no ice is present in the cloud, the warm rain process dominates. In this case, only freezing drizzle or possibly freezing rain will occur when the surface temperature is at or below 0°C. For warmer conditions at the surface, rain or drizzle is the result.
- The Near Surface Cold Layer
-
The depth of the surface cold layer, its minimum temperature, and the surface temperature all have to be examined. In many ways, this is the most difficult layer to diagnose operationally. Operational numerical models often have more difficulty predicting surface temperature than temperatures aloft.
There are several factors that can affect a hydrometeor in the surface cold layer. Obviously, if the surface layer is well above freezing, the hydrometeors will fall as rain. For example, if the wet-bulb temperature (Tw) is greater than 1ºC for at least ~300 m, any incoming ice will likely melt and fall as rain.
When the surface cold layer temperatures are below freezing, the hydrometeors will most likely arrive at the ground in the form of freezing or frozen precipitation. If rain is entering from the warm layer, and the near surface cold layer is cold enough and deep enough, liquid drops may refreeze to ice pellets. A general rule of thumb for ice pellet formation is if the layer is deeper than 750 m and -6ºC or colder.
Terrestrial Temperature
When the air temperature is below freezing but the terrestrial surface was above freezing before the arrival of a cold air mass, surface temperatures may not be cold enough to freeze water on contact. Consider this point when dealing with the first cold storm of the fall season or after a period of above-freezing temperatures.
Wet-Bulb Temperature
Wet bulb temperature (Tw) represents the final temperature in a given parcel of air after saturation has been reached. The wet bulb temperature can provide useful information for distinguishing between liquid and frozen precipitation.
Rain is more likely when the wet-bulb temperature is above 0°C. If the wet-bulb temperature is > 1ºC for a depth of at least 300 m from the surface, ice will melt and rain is most likely. Recent research has shown that the maximum possible surface wet-bulb temperature for snow to occur is near 1.5°C.
Other Considerations
Consider a situation where ice crystals are initially not present in the cloud. If the minimum temperature in a cold ground-based layer is cold enough and the layer is deep enough, ice nuclei may be activated within this layer producing ice crystals. Supercooled liquid drops falling into this layer can collide with these ice crystals and freeze, resulting in ice pellets. Research suggests that a sub-freezing layer with a depth deeper than 750 m and a minimum temperature of -6ºC or colder is required for this scenario.
A general rule of thumb is that the rain/snow boundary may correspond to the 0ºC isotherm at 850 hPa. In marine environments this general rule must be adjusted to approximately -2ºC. This is because, typically, the surface-based inversion is weak or non-existent in the marine environment. Another concern to keep in mind is that the 850 hPa 0ºC isotherm rule doesn't always work well to delineate the rain/snow boundary in a situation with unstable lapse rates.
- Elevated Precipitation-Producing Processes
-
An important point to consider is the effect of elevated processes that result in upward motion and hydrometeor generation aloft (e.g., elevated convection) . When the cloud-top temperature is above -10°C, conditions are not favorable for snow or rain development but favor drizzle or freezing drizzle formed through the collision and coalescence process. Elevated processes in a higher, cooler layer of cloud can produce ice crystals that can seed the supercooled water droplets in the lower "warm" cloud layer to produce snow. This occurs when the crystals grow rapidly as they fall through the saturated layer below. This is also known as the "seeder-feeder" process. The maximum separation of the two cloud layers for the process to be effective is about 1500m (~5000ft).
During a cold outbreak, when the precipitation type is generally freezing drizzle, elevated processes can produce occasional snow through a seeder/feeder process. Convective cells or bands passing over the cold, cloudy layer seed the lower layer and produce snow at the surface until the cells or bands pass downstream in the midlevel flow.
- Wet-Bulb Temperature and Unsaturated Layers
-
Wet-bulb temperature (Tw) is very useful in helping to assess precipitation type because it can yield information about temperature tendency once hydrometeors begin to fall and encounter varying environmental temperatures. When a hydrometeor comes into an unsaturated environment, it will begin to evaporate if it's liquid water, or it will sublimate (solid to vapor) if it's frozen. It can also melt if the temperature is > 0ºC.
In all of these cases, thermal energy is going from the environment to the hydrometeor to change the phase. This lowers the temperature of the surrounding environment. Simultaneously, water in the vapor form is also being added to the surrounding environment, thus the dewpoint (frost point if < 0ºC) rises. This results in the temperature cooling and the dewpoint rising, both approaching the wet-bulb temperature, and often continuing until saturation is reached.
In areas of cloud separated from the surface, some hydrometeors may fall through surface-based dry layers to reach the ground. It is not uncommon for these "dry layers" to exist aloft as well—between two saturated cloud layers. When precipitation falls through the dry, unsaturated layers, the ice/liquid begins to sublime/evaporate. The environmental temperature will begin to cool through evaporation and the dewpoint will rise, with both approaching the wet-bulb temperature.
If snowflakes or ice crystals fall into a layer with, for example., Tw = -1ºC, T = 5ºC and Td = -5ºC, the particles will begin to melt/evaporate/sublime; thus the temperature will begin to decrease. One study (Penn 1957) suggests this cooling of the environment via evaporation and melting (diabatic processes) can be on the order of 5 to 10ºC per hour.
Once the layer is saturated and T = Tw = Td = -1ºC, the frozen particles subsequently falling into the layer will remain frozen through the layer.
In this scenario, if the initially dry layer is surface-based, virga would occur initially; then the precipitation type would likely progress from rain to snow after the layer becomes saturated and cooler (Tw = T = Td = -1ºC).
Wet-Bulb Freezing Height
The probability of precipitation reaching the ground as snow, as opposed to rain, is related to the wet-bulb freezing height as indicated in the table.
Rule of Thumb for Wet Bulb Freezing Height (m)
> 1500 m
Snow rare
700 - 1500 m
Snow possible/likely
< 700 m
Snow usually occurs
- Top-Down Procedure
-
This top-down precipitation type decision chart is based on work done by Dan Baumgart. It can be used to analyze temperatures at key levels and provide guidance on possible precipitation type.
- Other Resources
-
- The National Weather Service has compiled a reference chart that combines elements
of the top-down approach with elements of partial thickness analysis.
- The National Weather Service has compiled a reference chart that combines elements
of the top-down approach with elements of partial thickness analysis.
- References
-
Baumgardt, D., 1999: Wintertime cloud microphysics review. SOO NWS La Crosse, WI.
Byers, H. R., 1965: Elements of Cloud Physics. University of Chicago Press, 191 pp.
Czys, R., et al., 1996: A physically based, nondimensional parameter for discriminating between locations of freezing rain and ice pellets. Wea. Forecasting 11 591-598.
Houghton, David D. 1985: Handbook of Applied Meteorology. Wiley Press, New York.
Penn, S., 1957: The prediction of snow versus rain. Forecasting Guide No. 2, U.S. Weather Bureau, 29 pp.
Rauber, Robert M. et al., 2001: A Synoptic Weather Pattern and Sounding-Based Climatology of Freezing Precipitation in the United States East of the Rocky Mountains. Journal of Applied Meteorology: Vol. 40, No. 10, pp. 1724–1747.
Rogers, R. R. and M. K. Yau, 1989: A Short Course in Cloud Physics. 3rd Ed., Pergammon Press.