3.2.1 Geostationary Satellites
Satellites continue to be the most important source of data for data-sparse regions and remote weather systems
like the polar low. The steadily improving and growing suite of multispectral sensors onboard today’s
satellite systems offers new opportunities to assist forecasters in the difficult challenge of nowcasting polar
lows.
(click to view a animation
in seperate browser window - 611 kb)
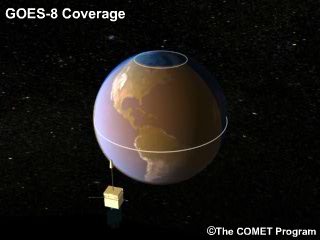
Because of the geostationary satellite’s fixed location above a point on the equator, the effective
observation of the polar regions is limited to approximately 70 degrees latitude due north and south from the
satellite’s longitudinal position. Despite this limitation, geostationary satellites can provide image data
at least hourly and so remain a powerful tool for monitoring the evolution of polar lows. With limited visible
lighting conditions available during the typical wintertime polar low months, infrared observation provides the
best source of information about weather on the synoptic and sub-synoptic scale at high latitudes. Water vapor
imagery can provide important information on synoptic-scale upper-level troughs, short waves, and jet streaks, all
potentially important forcing mechanisms in the development of polar lows.
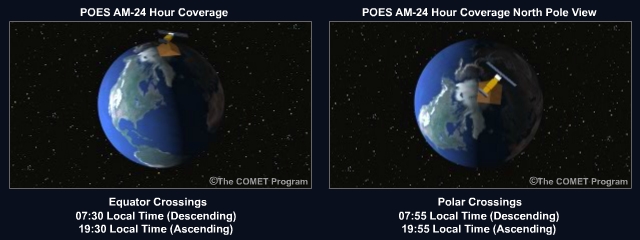
3.2.2 Polar-Orbiting Satellites
(click to view a animation in seperate browser window - 153 kb)
Polar-orbiting satellites provide excellent spatial coverage of the Earth’s polar regions, and are
equipped with an increasing and impressive array of multispectral imaging and all-weather sounding capabilities.
In addition to the standard visible and infrared imagery, active and passive microwave instruments are providing
information on atmospheric temperature and moisture, integrated water vapor, cloud water and ice, precipitation,
and sea surface winds.
3.2.3 Standard Visible and Infrared Imagery
Both geostationary and polar-orbiting infrared and visible satellite imagery can reveal critical information on
the presence or formation of low-level cloud features commonly associated with polar low precursors.
An outbreak of cold polar air flowing from land or ice out over a relatively warm ocean surface is one of the key
precursors to polar low formation. The low-level instability associated with cold air outbreaks over relatively
warm water leads to the formation of open-cell cumuliform cloud patterns often seen as cloud streets in visible
and infrared imagery. Closed-cell cloud formations, on the other hand, are associated with more stable air masses
or air masses that have been significantly modified by the ocean surface.
 |
|
This image illustrates both stable and relatively unstable air masses
separated by a secondary low-level baroclinic zone. The cloud band marks the baroclinic zone where polar
low formation would be favored.
|
The presence of upper-level forcing, or some other triggering event, is key to the formation of a polar low and
can often be detected with visible and infrared satellite imagery. For example, the "comma" cloud
signature, is associated with vorticity advection in advance of the short wave and is one of the more recognizable
features linked to the forcing and subsequent formation of polar lows.
The examples shown here illustrate key cloud features associated with polar low formation and development.
Vortex Formation

Polar low vortex formation can typically be seen as an organization of convective clouds into a more circular
pattern with a dry slot appearing near the center of circulation.
Spiraliform and Comma
Spiraliform and comma signatures are the most common organizing cloud patterns observed with developing polar
lows. The spiraliform signature is characterized by bands of convective cloud elements curving inward towards the
polar low’s center of circulation and marking development of the low beyond the cyclogenesis phase. The
comma signature also indicates development beyond the cyclogenesis phase, but is typically smaller in dimension
than the upper-level comma and may take on a more blurry appearance. Active deep convection within the comma-head
region generates cirrus outflow that forms an anticyclonically curved cloud shield.
Cloud-free Eye
A cloud-free or nearly cloud-free eye is a characteristic trait of mature polar low, indicating the presence of a
low-level warm core within the low and potentially strong surface wind conditions.
Merry-go-round Signature
 |
|
Example of a merry-go-round signature with multiple polar lows or
mesoscale cyclones. Arrows indicate position of the cyclones.
|
The merry-go-round signature occurs when multiple polar lows or mesoscale cyclones form within the circulation of
a cold upper-level cyclone. The mesoscale cyclones are thought to form in response to upper-level shortwave
troughs embedded within the larger scale flow of cyclone. These cold core systems may be part of the circumpolar
vortex or represent the latter stages of an occluded synoptic cyclone.
Infrared imagery can also provide an indirect means of establishing the depth of the polar low circulation by
assigning cloud heights to the deeper convective cloud elements. This can be accomplished by matching cloud-top
temperatures with radiosonde observations, numerical model temperature profiles, or a representative
climatological sounding.
3.2.4 Shortwave Infrared Channels
Daytime and nighttime 3.7- and 11-micrometer imagery used in combination can improve the identification of polar
low cloud types and characteristics. Developing and mature polar low systems are highly convective in nature and
contain significant quantities of liquid water and ice. A precursor upper-level comma cloud, potentially mistaken
for a polar low, would contain more ice and could be distinguished by utilizing the 3.7-micrometer channel's
sensitivity to water and ice.
High resolution shortwave infrared imagery is available onboard NOAA and NASA-EOS Terra and Aqua satellites.
Lower spatial resolution (4km GOES, 3km MSG) shortwave imagery is also available from geostationary satellites
including GOES and MSG.
 11 µm IR
  11-3.8 µm
3.2.5 Passive and Active Microwave Observation
Microwave imagery available from the NOAA-AMSU and DMSP-SSM/I sensors can assist with the detection of developing
polar low circulation centers. This is similar to applications developed for locating tropical cyclone centers.
The higher microwave frequencies (85-GHz channel with SSM/I; 89- and 150-GHz channels with AMSU) can penetrate
high thin cirrus, revealing the structure of cloud formations, precipitation, and surface winds organizing around
the center of circulation. Cloud water appears relatively bright/warm at these frequencies (SSM/I 85.5 GHz; AMSU
89- and 150-GHz) whereas cloud ice scatters microwave radiation and diminishes/cools the observed brightness
temperature values seen by the instrument. These differences provide another tool for assessing the intensity of
developing polar low events.
Recent research work has demonstrated the efficacy of the AMSU 53-GHz channel. As it is
sensitive to low-level atmospheric temperature, it can reveal the warm-core structure of moderate-to-strong polar
low events (Moore and VonderHaar, 2003).
3.2.6 Microwave Observation for Sea Surface Winds
Active microwave scatterometry and passive radiometry provide indirect measurements of winds at the sea surface
from polar-orbiting satellites and can be powerful tools to assist in both the detection and intensity of polar
low circulations.
Quikscat, ERS-2, SeaWinds, and the future ASCAT instrument to be flown on Metop, the next generation European
polar-orbiting satellite, incorporate scatterometers to transmit and receive microwave radiation and provide both
wind speed and direction. Wind vectors for most of these systems are capable of measuring wind speeds between 0
and 20 m/s with a 2 m/s accuracy, and have a directional accuracy of about 20 degrees.

Current passive microwave radiometers such as the SSM/I are only capable of measuring emitted
microwave energy. As a result, only wind speed and not direction can be measured. Derived SSM/I wind speeds can
range from 0 to 40 m/s with a 2 m/s accuracy and are valid at 10 meters above sea level.
 |
|
SSM/I derived surface wind speeds over open sea for a polar low near 65 deg N, 2 deg E. The
black arrow indicates storm center as estimated from IR imagery.
|
A new passive microwave observing technology is being developed for NPOESS, the next generation U.S.
polar-orbiting series of satellites. It will provide both wind speed and direction.
References
Bader, M.J., G.S. Forbes, J.R. Grant, R.B.E. Lilley, and A.J. Waters, 1995: Images in weather forecasting.
Cambridge University Press.
COMET Module: Satellite Meteorology: GOES Channel Selection https://www.meted.ucar.edu/training_module.php?id=784
COMET Module: Polar Satellite Products for the Operational Forecaster, Module 1: POES Introduction and Background
http://www.meted.ucar.edu/ist/poes/index.htm
Heinemann, Günther, 2001: Newsletter of the European Polar Low Working Group, September 2001.
Heinemann, Günther, 2003: Proceedings of the European Geophysical Society (EGS) Polar Low Workshop,
Cambridge, UK, 11-13 June 2003.
Hewson, T.D., G.C. Craig, and C. Claud, 2000: Evolution and mesoscale structure of a polar low outbreak, Q.
J.R. Meteorol. Soc., 126, 1031-1063.
Moore, Richard W. and T.H. Vonder Haar, 2003: Diagnosis of a polar low warm core utilizing the Advanced Microwave
Sounding Unit. Weather and Forecasting, 18, 700-711.
Parker, M.N. and Edward Hudson, 1991: Polar Low Handbook for Canadian Meteorologists. Environment Canada,
Atmospheric Environment Service.
QuikScat data and images are produced by Remote Sensing Systems and sponsored by the NASA Ocean Vector Winds
Science Team.
Rasmussen, Erik A. and John Turner, 2003: Polar Lows: Mesoscale Weather Systems in the Polar Regions, Cambridge
University Press.
SSM/I data and images are produced by Remote Sensing Systems and sponsored by the NASA Pathfinder Program for
early Earth Observing System (EOS) products.