Produced by The COMET® Program
Case Profile
| Geographic Location | New England and Southern Canadian Maritimes |
| Case Timeframe | 04UTC 13 Jan 1999 - 00UTC 15 Jan 1999 |
| Phenomena of Interest | Ocean Effect Snow |
| Forecasting Challenges |
Recognize the necessary synoptic precursors for an ocean effect snow event off the east coast of New England and Atlantic Canada. Identify the mesoscale factors that lead to the establishment of ocean effect snow bands. Recognize ocean effect snow bands from satellite and radar displays. Recognize the potential for enhancement and eventual dissipation of ocean effect snow bands with the changing synoptic conditions. |
The case is presented in four parts:
Case Profile
Introduction to the case setting with a synoptic overview.
Case Challenge
A series of forecasting questions accompanied by a rich set of data and background content
to challenge forecasting skills.
Case Summary
An experts overview of the case as it unfolded.
Resources
Bibliography and links to more information on ocean effect snow events.
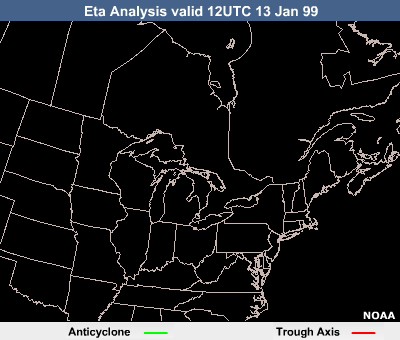
Eta 500hPa Height
Current Time: 15UTC 13 January 1999
It is currently 15UTC (10AM local time on the East coast) on 13 January 1999. You are on shift in the Boston forecast office and are familiarizing yourself with the current synoptic conditions over eastern North America.
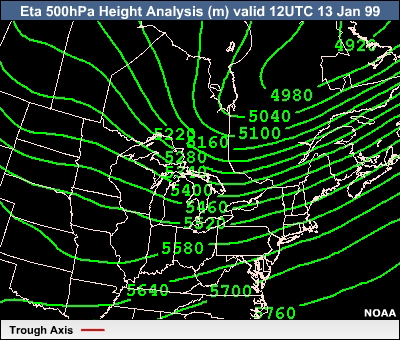
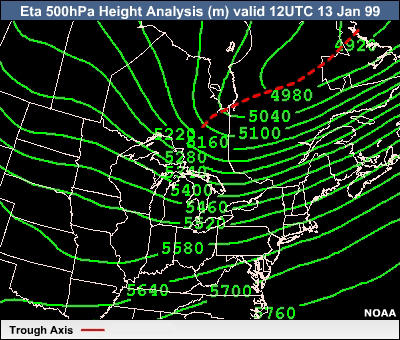
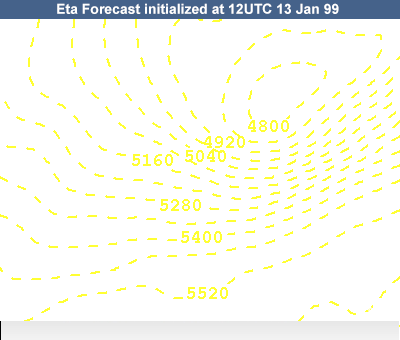
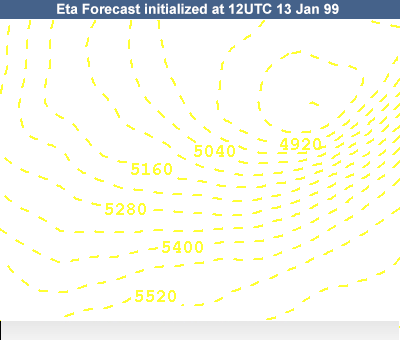
500hPa analysis valid 12UTC 13 January 1999 This chart shows a sharp upper trough over central Québec. It extends southwestward into Ontario. Comparison with previous 500hPa analyses (not shown) indicates that the trough has been moving very slowly. The trough is positively-tilted with strong upper-level winds on its east side over the northeastern U.S. and southeastern Canada. To the west of the trough is a northwesterly flow over much of Ontario and Manitoba, downstream of an upper ridge over the northern Canadian prairie provinces.
Eta 500hPa Height Analysis (m) valid 12UTC 13 Jan 99
Eta 250hPa Isotachs
Current Time: 15UTC 13 January 1999
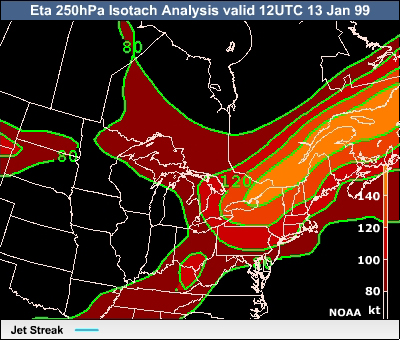
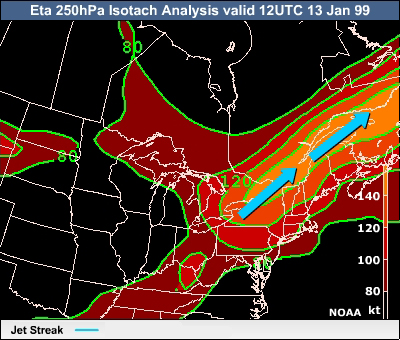
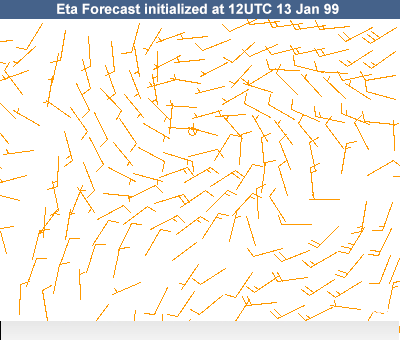
The 250hPa isotach chart shows the core of a strong jet streak, oriented southwest-northeast, extending from the lower Great Lakes to the northern Gulf of the St. Lawrence.
Comparison with previous 250hPa analyses (not shown) indicates that the streak has been moving eastward fairly rapidly.
Eta 250hPa Isotach Analysis valid 12UTC 13 Jan 99
Eta MSLP and 1000-500 Thickness
Current Time: 15UTC 13 January 1999
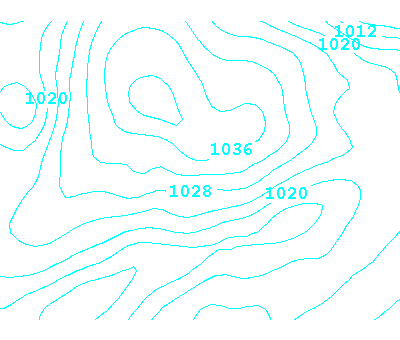
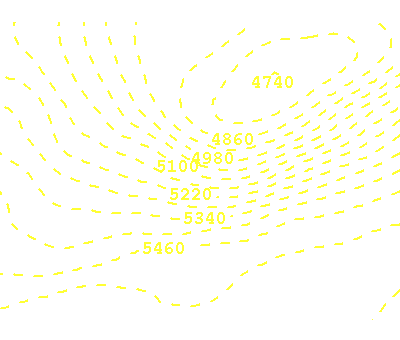

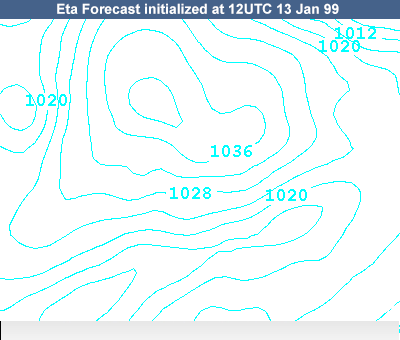
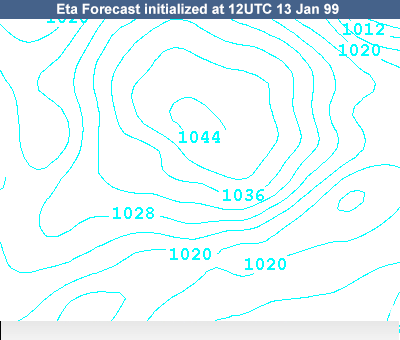
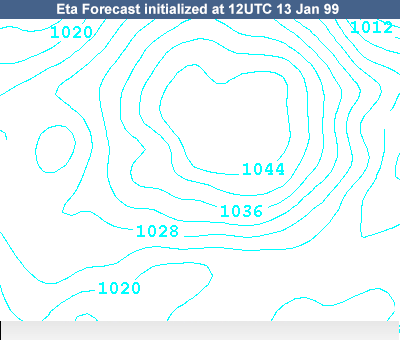
The 12UTC MSL pressure analysis shows a moderately strong anticyclone centered over northwestern Ontario.
Comparison with previous MSLP analyses (not shown) indicates that the high has been strengthening and moving eastward.
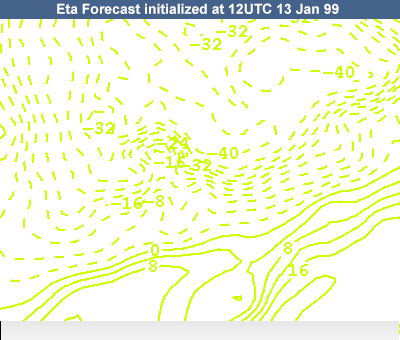
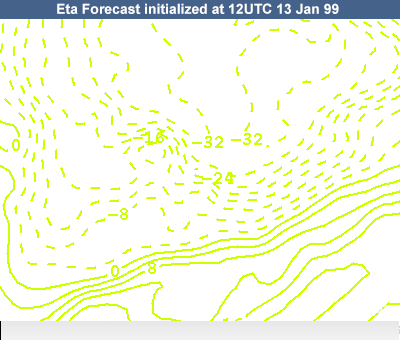
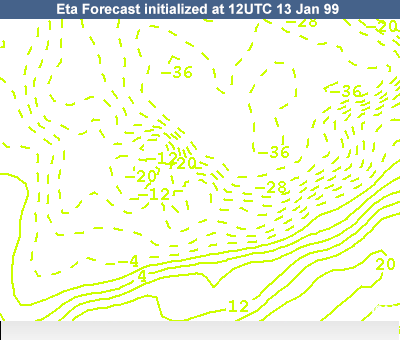
A trough is present farther south, with an axis from southern Illinois to Nova Scotia. This is a frontal trough, as shown by the 1000-500 thicknesses. The air mass over Canada is extremely cold, with thicknesses as low as 4740 m over north-central Québec.
Use the check box buttons at the top of the image to reveal or hide fields, and use the check boxes below to reveal the features of interest.
GOES-8 10.7-µm IR
Current Time: 15UTC 13 January 1999
The 10.7-micrometer IR image shows mostly clear conditions over much of Ontario and Quebec, with very cold ground temperatures there.
Strong, upper-level west-southwesterly flow is clearly evident over New England, with upper-level clouds moving from as far west as Missouri to off the New England coast. By 13 and 14 UTC the deepest clouds with the coldest tops seem to be dissipating over northern Pennsylvania and New York.
GOES 11-micrometer IR Window
Advantages
The best uses of the 11-micrometer IR window imagery for feature detection
include:
- Detecting relatively cold cloud-top features associated with convection, cirriform, and mid-level cloud types
- Can be used in conjunction with cloud phase information obtained from shortwave infrared channels to help determine potential for icing
- Can be used in combination with shortwave infrared imagery for discriminating ice clouds at night. During daytime, it can be used to discriminate high clouds from snow and ice cover or in combination with shortwave IR and visible imagery.
- Can be used in conjunction with a shortwave infrared channel (between 3.5 and 4 micrometers) to detect water clouds at night
Limitations
The limitations of the 11-micrometer IR window channel for feature detection
include:
- Difficult to distinguish low clouds from relatively cold ground or water, a problem common during wintertime and at night
- Distinguishing between snow, ice cover, and adjacent frozen ground is very difficult
- Alone it cannot confirm the presence of supercooled water clouds, generally present between 0 and -15 degrees C
Radar Composite
Current Time: 15UTC 13 January 1999
The composite radar reflectivity image shows a long band of light-to-moderate snowfall from Missouri to the Canadian Maritimes. The snow is generally moving eastward with the upper flow.
Case Challenge
Overview
From the perspective of a forecaster in the Boston Forecast Office, respond to this series of forecast challenge questions. The case begins at 10AM local time (15UTC) on 13 January 1999.

The first few questions in the Challenge examine this event on the synoptic scale. Subsequent questions will add mesoscale considerations to the mix.

Question 1
Question
Current Time: 15UTC 13 January 1999
Examine the available NWP guidance initialized 12UTC on 13 January with forecasts through 36 hours and the satellite loop.
From the following list, identify the most important precursor(s) to a possible ocean
effect snow event in the Canadian Maritimes and New England region over the next 36
hours.
(Choose all that apply)
View the relevant Supporting Topics below to help you with your answer.
The correct answer is f).
Anticyclogenesis is the most likely precursor to any potential ocean effect snow in the region over the next 36 hours. Refer to the Eta MSLP and 250hPa Isotachs in the Plan View data viewer for this discussion.
Note the building MSL high pressure center moving from northwestern Ontario to Quebec during the period 12UTC on 13 January through 12UTC on 14 January. The high is favourably positioned for intensification due to the strengthening 500hPa upstream ridge. The left entrance region of the jet streak and the associated subsidence contribute to significant anticyclogenesis.
The surface trough and frontal zone initially over New England and southern Nova Scotia are pushed well southward by the strengthening high in the period ending 12UTC on 14 January.
In this case, the anticyclogenesis over Québec is the main precursor to any ocean effect snow event in the Canadian Maritimes and New England regions.
Lake Effect Snow:
- * The Challenge of Lake/Ocean Effect Snow
- * Instability
- Lifting Mechanisms
- * Fetch, Wind Speed, and Shear
- Cloud and Precipitation Microphysics
- * Synoptic Setting
- Snow Banding Processes
- Satellite Imagery for Detection
Winter Precipitation Processes:
- Ice Crystal Growth
- The Ice-Crystal Process: Operational Significance
- Characteristics of Natural Cloud Seeding
- Satellite Imagery for the Detection of Natural Cloud Seeding in Winter
* = Most relevant topic for this page.
Question 2
Question
Current Time: 15UTC 13 January 1999
The precursor, identified in the previous question, could contribute to an ocean
effect event in the Boston Forecast region through the creation of:
(Choose the
best answer)
View the relevant Supporting Topics below to help you with your answer.
The correct answer is c)
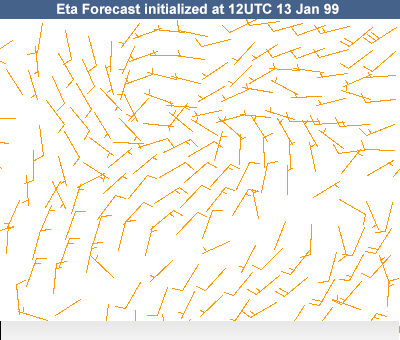
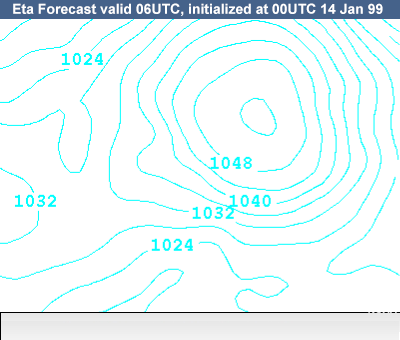
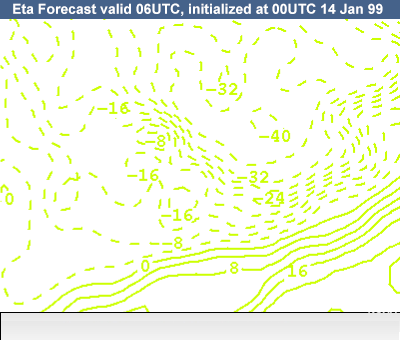
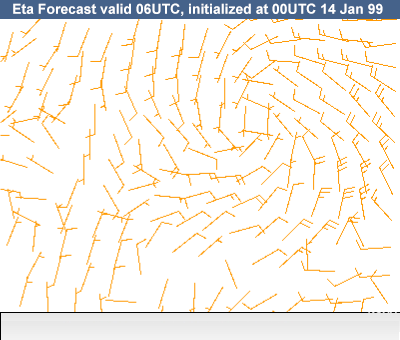
The anticyclogenesis identified as a precursor in the previous question, could create cold low-level outflow which, in turn, could help set up an ocean effect snow event along the New England coast. Refer to the Eta MSLP, 10m Winds, and 2m Temperature fields in the Plan View data viewer for this discussion.
Glacial temperatures near the surface in the high are in the -40°C range in some areas over Ontario and Québec. As the high builds in the 12UTC 13 January to 12UTC 14 January period, northerly to northeasterly boundary-layer winds strenghthen as they cross Maine and New Brunswick and then move across the ocean to the coastal areas of New England. Surface air temperatures fall to below 0°C in this cold outflow over the Canadian Maritimes and New England.
The result of this could have significant impact on the development of an ocean effect scenario. Take note of the following key points:
- Near-surface winds are oriented parallel to parts of the New England coast by 06UTC on 14 January, and this orientation persists in the following hours
- We might expect that in this situation, there could be significant low level instability. For example, by 12UTC on 14 January, the model forecasts a 950hPa temperature near Cape Cod of -13°C. This is surely significantly colder than the sea surface temperature and implies a very steep lapse rate in the lowest levels of the atmosphere
Lake Effect Snow:
- The Challenge of Lake/Ocean Effect Snow
- * Instability
- * Lifting Mechanisms
- * Fetch, Wind Speed, and Shear
- Cloud and Precipitation Microphysics
- * Synoptic Setting
- Snow Banding Processes
- Satellite Imagery for Detection
Winter Precipitation Processes:
- Ice Crystal Growth
- The Ice-Crystal Process: Operational Significance
- Characteristics of Natural Cloud Seeding
- Satellite Imagery for the Detection of Natural Cloud Seeding in Winter
* = Most relevant topic for this page.
Question 3
Question
Current Time: 15UTC 13 January 1999
Consider how the synoptic scale upper-level and surface patterns are forecast to
evolve over the eastern U.S. later in the period. The 500hPa heights are
rising over the eastern U.S. ahead of the digging trough over the Midwest. What
is/are the most important synoptic factor(s) that will impact the weather over the
New England coast between 12UTC on 14 January and 00UTC on 15 January?
(Choose
all that apply)
View the relevant Supporting Topics below to help you with your answer.
The correct answer are d) and g).
Deep tropospheric moisture and isentropic lift due to warm advection aloft will likely be the most important factors influencing the weather over the New England coast between 12UTC on 14 January and 00UTC on 15 January. Refer to the Eta 290 K Winds and Pressure fields in the Plan View data viewer for this discussion.
The synoptic pattern over the eastern U.S. is one of deep synoptic lift in the presence of deep tropospheric moisture. By 12UTC on 14 January, warm advection has already begun over western Pennsylvania at low levels and aloft. The deep nature of the associated lift is shown in the chart that displays winds and pressures on the 290 K isentropic surface. For example, we see clear isentropic uplift from about 900 hPa to near 600 hPa at 18UTC on 14 January over the eastern U.S. and eastern Canada.
The changing pattern over the eastern U.S., including all the thermal and thermodynamic processes that will accompany this new system, could significantly impact any ocean effect snow event.
Lake Effect Snow:
- The Challenge of Lake/Ocean Effect Snow
- * Instability
- * Lifting Mechanisms
- * Fetch, Wind Speed, and Shear
- Cloud and Precipitation Microphysics
- * Synoptic Setting
- Snow Banding Processes
- Satellite Imagery for Detection
Winter Precipitation Processes:
- Ice Crystal Growth
- The Ice-Crystal Process: Operational Significance
- Characteristics of Natural Cloud Seeding
- Satellite Imagery for the Detection of Natural Cloud Seeding in Winter
* = Most relevant topic for this page.
Question 4
Question
Current Time: 15UTC 13 January 1999
Data: Plan View | Satellite | Soundings
Examine the model soundings for these stations along the New England and Nova Scotia
coasts, and refer as necessary to the model planview forecast data for the region.
For each station, check each factor that is present in the model forecast valid
12UTC 14 Jan (24-hr forecast from model initial time) and indicate whether you
anticipate heavy snowfall rates due to ocean effect snow.
(Choose all that
apply)
View the relevant Supporting Topics below to help you with your answer.
The correct answers are highlighted in green above.
Answer the next question to view the complete discussion.
Question
Do you anticipate heavy ocean effect snowfall rates?
The correct answers are highlighted in green above.
Overview
Based on the soundings, water temperatures, and winds, heavy snowfall rates are possible in Providence and very likely in Boston. Refer to the soundings, buoy obs, and 10m winds in the Plan View and Soundings data viewers for this discussion.
For the purposes of this discussion, we will define the term delta-T to be the difference in temperature between the water surface and the coldest temperature at the base of the low-level inversion.
delta-T Rule of Thumb
A rule of thumb often used for lake and ocean effect snow is that delta-T of > 13°C indicates that low level convection will form and give a significant possibility of moderate to heavy snowfall. Often this rule is presented in terms of the difference in the temperature between the water surface and the 850hPa temperature, especially for lake effect snow in the Great Lakes area. This is fine if the base of the inversion is at or near 850 hPa, but will underestimate the true delta-T if the base of the inversion is lower than 850 hPa. In the case we are studying, the base of the inversion is significantly lower than the 850hPa level: the coldest air is found in a very shallow layer above the surface.
The buoy observation just east of Boston at 01UTC on 14 January shows a SST of 4°C. Farther out over the Atlantic, another buoy has a SST of 5°C. These values are relatively constant throughout this forecast period, and we can assume that they are similar in the Portland and Providence areas. Using the 4°C value and the Eta soundings, the delta-T values and wind direction for the 4 locations are listed in Table 1.
| Table 1: Forecast delta-T (°C)* and wind direction (deg) | ||||
|---|---|---|---|---|
| Time (UTC) |
Boston (BOS) |
Providence (PVD) |
Portland (PWM) |
Yarmouth (YQI) |
| 00 14th | 14/010 | 11/020 | 21/360 | 13/360 |
| 06 14th | 20/030 | 17/030 | 26/010 | 21/360 |
| 12 14th | 21/045 | 20/045 | 25/030 | 22/025 |
| 18 14th | 18/055 | 16/070 | 22/045 | 22/065 |
| 00 15th | 13/080 | 10/080 | 18/080 | 17/090 |
The temperature difference from the sea surface to the base of the inversion is substantially greater than 13°C at various times for all four sites. This appears, at first glance, to be favourable for lake or ocean effect snow. However, two of the sites (PWM and YQI) are so deep into the cold air that the base of the inversion is very low or at the ground, and subsidence effects are substantially drying out the low levels of the atmosphere.
Considering the wind direction, we see that it is roughly shore-parallel along the southern Maine, New Hampshire, and northeastern Massachusets shores, becoming onshore in the Boston area with Providence just downwind from there. At Yarmouth, the wind is generally off the land. This is also true for the first part of the period at Portland; thereafter the wind shifts to an unfavourable easterly direction for this station.
The low-level humidity should also be considered. Portland and Yarmouth are deep enough in the Arctic air that they are very dry in the low levels of the atmosphere.
Factors by Location
Factors by Location Yarmouth (YQI)
Considering the ocean temperatures (one offshore buoy is measuring a
SST of 5°C), there is strong instability just offshore at very low levels.
Another unfavourable factor is the that this station is deep enough into the
cold air that the low-level air is very dry.
Portland (PWM)
The forecast instability from the surface to the base of the inversion
is very strong, but this occurs at very low levels, sometimes at or near the
surface. Also, the surface wind direction is not favourable in general, with
northerly to north-northeasterly winds coming off the land through 12UTC on
14 January and then changing fairly quickly to a nearly easterly wind (also
unfavourable) by 00UTC on 15 January. The air mass is also very dry in the
low levels.
Boston (BOS)
The wind and temperature profiles in the Eta predicted soundings for
Boston show all the signs for ocean effect snow:
- surface winds are coast parallel upstream of the Boston area, resulting in a long fetch across the water as well as frictional convergence near the coast
- the lapse rate is very unstable below the inversion
- low-level cold advection is present to reinforce the cold air near the surface
Providence (PVD)
The shoreline south of Providence is oriented almost east-west, so the
low-level winds are not shore-parallel. However, it is more likely the
Massachusetts coast is the important shoreline for possible ocean effect
snow at Providence. It is uncertain at this point whether or not potential
ocean effect snow bands that might form near Boston could propagate far
enough southwestward across land to reach Providence. However, the low-level
lapse rate is unstable in the period including 06-18UTC on 14 January, and
there is low-level cold advection to maintain the cold low-level air. Ocean
effect snow bands appear possible if the snow bands can penetrate far enough
inland.
Conclusion about Snowfall Rates
From consideration of the various ocean effect snow factors at the four stations, we conclude that the Boston area is the one most likely to experience heavy snowfall rates due to ocean effect snow at around 12UTC on 14 January. Such snowfall may also be possible at Providence, but is not expected at Portland and Yarmouth.
Lake Effect Snow:
- The Challenge of Lake/Ocean Effect Snow
- * Instability
- * Lifting Mechanisms
- * Fetch, Wind Speed, and Shear
- * Cloud and Precipitation Microphysics
- Synoptic Setting
- Snow Banding Processes
- Satellite Imagery for Detection
Winter Precipitation Processes:
- Ice Crystal Growth
- The Ice-Crystal Process: Operational Significance
- Characteristics of Natural Cloud Seeding
- Satellite Imagery for the Detection of Natural Cloud Seeding in Winter
* = Most relevant topic for this page.
Question 5
Question
Current Time: 15UTC 13 January 1999
Data: Plan View | Satellite | Soundings
The changing synoptic pattern over the eastern U.S. will bring synoptic scale
precipitation to New England mostly later in the forecast period. Qualitatively, how
do you expect the changing synoptic pattern over the eastern U.S. to impact any
potential ocean effect snowfall amounts in the 24-36 hour period (12UTC 14 Jan -
00UTC 15 Jan)?
(Choose all that apply)
View the relevant Supporting Topics below to help you with your answer.
The correct answer are b) and d).
Overview
The synoptic pattern will most likely impact any ocean effect. Synoptic-scale processes may generate a seeder/feeder effect that initially enhances ocean effect snowfall. As a synoptic system approaches, airmass advection erodes cold air in the lowest levels, reducing instability and acting to stop ocean effect snow. Refer to the 290 K pressures and winds, 700hPa omega, 850-500hPa mean RH, 10m winds, and BOS sounding in the Plan View and Soundings data viewers for this discussion.
A broad synoptic system is developing upstream of the New England coast, in which differential vorticity advection aloft and warm air advection are contributing to synoptic scale lift over eastern U.S. and eastern Canada. This can be seen as isentropic lifting on the 290 K surface at various forecast times, or at a single pressure level in the forecast vertical motion at 700 hPa. Deep moisture is available in the troposphere as well: layer average relative humidities between 850 and 500 hPa will often be in the 80-90% range according to the Eta forecast. These conditions will certainly lead to synoptic scale precipitation over New England. The precipitation is not convective, and organized mid-level convection is not expected to occur.
Reduction of Ocean Effect Snow Due to the Advancing Synoptic Pattern
At the surface, a low pressure center develops ahead of the advancing upper-level trough, and moves to the area of the Virginias and western Pennsylvania by 00UTC on 15 January. This in turn affects the low-level flow over the New England coast, where the surface winds must veer with time as the surface ridge of high pressure begins to move eastward. This is clearly seen in the low-level winds in the Boston forecast soundings and in the plan view forecast of the Eta's 10m winds.
The veering with time of the low-level winds near the New England coast has two effects on potential ocean effect bands. The changing wind direction means that the initially favourable coast-parallel orientation is eventually lost. Furthermore, as the winds veer, they gain more and more of an off-ocean component: they are forecast to be nearly easterly by 00UTC on 15 January. This means that the initial pattern of low-level cold air advection is lost, and in fact low-level warm advection begins, with a resulting erosion of the low level cold air, as clearly seen in the forecast soundings for Boston. As the low-levels warm, the instability supporting the ocean effect snow decreases. Through these two mechanisms, the advancing synoptic pattern acts to reduce the coastal ocean effect snow. As time continues, all the low-level cold air will disappear due to continued warm advection, and synoptic precipitation will turn to rain. Any ocean effect snow will have ceased well before that time, though, due to loss of both favourable wind direction and low-level instability.
Potential Enhancement of Ocean Effect Snow Due to the Advancing Synoptic Pattern
An interesting microphysical effect that must be considered is the possible introduction of ice crystals from above into the ocean-effect bands. This process could enhance snowfall rates via the seeder/feeder mechanism, in which snowfall amounts are augmented through the rapid growth of crystals falling from above into a lower cloud level. In this case, ice crystals falling into the ocean-effect bands could grow rapidly within those bands under the right conditions. In the absence of the seeder-feeder effect, ice crystals must be initiated and grow solely in the shallow, surface-based cold layer.
Lake Effect Snow:
- The Challenge of Lake/Ocean Effect Snow
- * Instability
- * Lifting Mechanisms
- * Fetch, Wind Speed, and Shear
- Cloud and Precipitation Microphysics
- * Synoptic Setting
- Snow Banding Processes
- Satellite Imagery for Detection
Winter Precipitation Processes:
- Ice Crystal Growth
- The Ice-Crystal Process: Operational Significance
- * Characteristics of Natural Cloud Seeding
- * Satellite Imagery for the Detection of Natural Cloud Seeding in Winter
* = Most relevant topic for this page.
Question 6
Question
Current Time: 06UTC 14 January 1999
15 hours have passed. It is now just after 06UTC on 14 January, and eastern Massachusetts, including the Boston area, is experiencing light snow with periods of locally heavy snow due to bands of ocean effect snow moving onshore from the east. As was forecast earlier, conditions favourable for ocean effect snow have indeed come together: very cold air with a steep lapse rate in the low levels along with winds that are approximately parallel to the general New England coast. You are interested in the depth of the ocean effect snow bands at this time.
From the radar image at 0607UTC and/or from available forecast sounding data, what is
the approximate depth of the ocean effect snow bands over coastal Massachusetts?
Depending on how you estimate the heights, you may need the sine of 0.5°, which is
0.0087.
(Choose the best answer)
View the relevant Supporting Topics below to help you with your answer.
The correct answer is c)
Overview
The best choice is the range of 1200-1800m, or roughly 4000-5000 ft. Use of radar or use of soundings are the two possible approaches for estimating cloud heights in this situation.
Image: Estimating Cloud Height with Radar
Use of Radar
This depth of the snow bands can be estimated from the PPI (plan-position indicator) reflectivity scan at Taunton (BOX), which shows ocean effect bands extending out to about 100 km east of the radar on the 0.5° scan at 0557UTC (the 100-km range ring is available in the data set for this question). Beyond that distance the beam is more or less above the bands.
Simple geometry shows that at 100 km, the centre of the beam at 0.5° elevation is above the tangent to the earth through the radar station by some 873 m. This number is surely an overestimate, due to beam spreading, since the center of the beam could pass somewhat above the tops of the snow bands while the lower part of the spread-out beam could still provide some radar returns from them.
Another factor that must be accounted for is the earth's curvature: the correction for the earth's curvature at 100-km range is that the earth's surface lies under the tangent by about 785 m. The sum of the two, 1658 m, overestimates to some degree the depth of the snow band clouds, following the comments made above about beam spreading.
One final factor to consider in this case is beam refraction: the increase of temperature with height in the inversion will cause the beam to refract downward, but this will be offset by the upward refraction of the beam due to the increase of humidity with height. The net refractive effect may be small in this case.
Use of Soundings
The operational forecaster might use forecast or observed soundings to get a rough estimate of the height of the clouds producing the ocean effect snow bands. The 3-hour Meso-Eta forecast sounding for BOS valid 06UTC shows the strong inversion above 925 hPa, and we can assume that a similar inversion exists over the Atlantic off Massachusetts.
The ocean effect clouds are convective clouds with their origins over the waters of the Atlantic. In such a cold air mass, an air parcel just above the water surface is buoyant and will rise (recall that the SST is observed to be 4°C at a buoy just off the Massachusetts coast). Under various assumptions about the temperature and dew point of such a parcel, it is clear that it would rise to at least the level of the inversion in the vicinity of 900 to 850 hPa. This would put the tops somewhere in the 1150-1500m range (see the 850 and 900hPa height forecasts for these numbers). This rough estimate is not too different from that obtained through the use of the radar reflectivity data.
Lake Effect Snow:
- The Challenge of Lake/Ocean Effect Snow
- Instability
- Lifting Mechanisms
- Fetch, Wind Speed, and Shear
- Cloud and Precipitation Microphysics
- Synoptic Setting
- * Snow Banding Processes
- * Satellite Imagery for Detection
Winter Precipitation Processes:
- Ice Crystal Growth
- The Ice-Crystal Process: Operational Significance
- Characteristics of Natural Cloud Seeding
- Satellite Imagery for the Detection of Natural Cloud Seeding in Winter
* = Most relevant topic for this page.
Question 7
Question
Current Time: 10UTC 14 January 1999
Data: Surface Obs | Soundings | Radar
The time is now 10UTC on 14 January. Examine the BOX radar reflectivity loop for the
time period 0448-0955UTC. Shallow ocean effect bands are moving slowly westward
during this period. Can you identify a nearly stationary region of enhanced
precipitation? Why would this region be found where it is?
(Choose all that
apply)
View the relevant Supporting Topics below to help you with your answer.
The correct answer is c).
Overview
The stationary region of enhanced precipitation is most likely due to coastal convergence of the ocean effect bands. Refer to the Radar data viewer for this discussion.
In the radar reflectivity loop one can see both westward-moving ocean effect snowbands over eastern Massachusetts and just off the coast as well as a broader-scale eastward moving flow over Massachusetts and the surrounding states. Near the beginning of the loop, an area of 20-24 dBz reflectivities (magenta and mauve colours) forms over eastern Massachusetts just inland of the coast. The most important point to note about this area is that it remains quasi-stationary through the remainder of the loop, even though the ocean effect bands are advancing from the Atlantic.
Coastal Convergence
One possible explanation for this behaviour is the coastal convergence effect, in which increased roughness and friction due to the land of the coast causes increased convergence at the lowest atmospheric levels, compared to the situation out over the open water. This extra convergence acts to intensify the ocean effect snow near the coast. The frictional convergence effect leads to veering of winds with height in the planetary boundary layer.
An indirect illustration of this effect is available through the Doppler radar imagery from BOX. The image from 0557UTC, at 1.5 deg elevation shows a flat S-shape in the zero line that separates "toward" velocities from "away" velocities. This S-shape is characteristic of winds veering with height, in this case in the boundary layer.
The convergence is also hinted at in a few surface observations in the hourly loop from 05-10UTC. Compare the surface wind observed at the station on the northern tip of Cape Cod (station PVC, representative of the ocean environment) with those from several stations on the mainland across the mouth of Cape Cod Bay to the northwest of PVC. These latter stations represent the coastal environment. Note that at all hours except 08UTC, the wind at PVC is from the northeast, while the wind at the coastal stations is nearly northerly. Due to the reduced wind speed over land, a slight ageostrophy is induced, and the result is convergence at the coast.
Orographics
The topography over Massachusetts is not sharp enough to result in moderate orographic lift, while any mid-level lift up the frontal surface would occur over a much wider area than coastal Massachusetts.
Westward Movement of Bands
It is believed that ocean effect snow bands are an example of horizontal roll convection in the atmosphere.
Why do they move westward? The answer to this question is not clear. A coastal effect cannot serve as the explanation, because the bands are observed to drift westward over the water, well away from any coast.
Individual convective elements within the bands should move with the mean low-level wind. A small directional wind shear does exist in the lowest levels of the atmosphere due to the slight veering of the wind with height in the friction layer. Though this layer is very thin over the ocean, it has been suggested that the bands' westward motion may be related to this directional shear.
Inland Extent of Bands
One final point to note is that the bands are not moving very far inland. In general, it is probable that such ocean effect bands never go very far inland in this region. While such convection is relatively strong by winter standards, it is also very shallow and not able to survive very far from the heat source.
Lake Effect Snow:
- * The Challenge of Lake/Ocean Effect Snow
- * Instability
- Lifting Mechanisms
- * Fetch, Wind Speed, and Shear
- Cloud and Precipitation Microphysics
- Synoptic Setting
- * Snow Banding Processes
- Satellite Imagery for Detection
Winter Precipitation Processes:
- Ice Crystal Growth
- The Ice-Crystal Process: Operational Significance
- Characteristics of Natural Cloud Seeding
- Satellite Imagery for the Detection of Natural Cloud Seeding in Winter
* = Most relevant topic for this page.
Question 8
Question
Current Time: 10UTC 14 January 1999
Data: Plan View | Surface Obs | Soundings | Radar
Keeping the 13°C delta-T guideline in mind for lake and ocean effect snow events, as well as the low-level wind direction, when do you predict the banding in the Boston region to weaken?
| Model predicted delta-T* and surface wind directions at BOS using Meso-Eta initialized at 03UTC 14 Jan 99 | ||
|---|---|---|
|
Time (UTC) |
BOS
delta-T (°C) |
Surface wind
direction (degrees) |
| 09 14 Jan | 21 | 025 |
| 12 14 Jan | 21 | 035 |
| 15 14 Jan | 21 | 040 |
| 18 14 Jan | 20 | 055 |
| 21 14 Jan | 18 | 065 |
| 00 15 Jan | 17 | 075 |
Choose the appropriate time frame:
(Choose the best answer)
View the relevant Supporting Topics below to help you with your answer.
The correct answer is d)
Based on the model-predicted delta-T and the Meso-Eta forecast winds for the Boston area, the ocean effect snow will cease some time between 18 and 21UTC.
As noted earlier, a good indicator of possibly heavy lake or ocean effect snow is the temperature difference between water surface and the coldest temperature below the inversion. A minimum 13°C difference is considered the threshold for significant ocean effect snow. The BOS forecast sounding indicates this threshold is in place through 00UTC on 15 January.
We must also consider the wind direction. NNE winds and NE winds are roughly parallel to the general New England coast and so are more favourable for ocean effect than ENE or E winds, since the coastal convergence effect is strongest with nearly shore-parallel winds. By 21UTC, the forecast surface wind direction from the Meso-Eta forecast sounding is not favorable, with too much of an easterly component. It appears that the ocean effect snow will cease some time between 18 and 21UTC.
Lake Effect Snow:
- The Challenge of Lake/Ocean Effect Snow
- * Instability
- Lifting Mechanisms
- * Fetch, Wind Speed, and Shear
- Cloud and Precipitation Microphysics
- * Synoptic Setting
- * Snow Banding Processes
- Satellite Imagery for Detection
Winter Precipitation Processes:
- Ice Crystal Growth
- The Ice-Crystal Process: Operational Significance
- Characteristics of Natural Cloud Seeding
- Satellite Imagery for the Detection of Natural Cloud Seeding in Winter
* = Most relevant topic for this page.
Question 9
Question
Current Time: 00UTC 15 January 1999
Data: Satellite | Surface Obs | Soundings | Radar
Ocean effect bands have continued to bring snow to eastern Massachusetts during the
day. Looking at the BOX radar reflectivities at about 1830UTC on 14 January, there
appears to be a sudden strengthening in the ocean effect snow in a small area of
enhanced reflectivity just southwest and south of Boston. What is the most likely
cause of this small area of enhanced snowfall?
(Choose all that apply)
View the relevant Supporting Topics below to help you with your answer.
The correct answer is c).
The enhanced snowfall is most likley due to a seeder/feeder effect. The satellite and radar imagery show overriding of the bands by precipitating clouds aloft.
VIS Satellite
In the visible imagery, it is clear that the ocean effect bands continued to move westward over the Atlantic in the 13-20UTC 14 January period. In the first half of this time period, one can see ocean effect snow bands moving across the Massachusetts coast from the vicinity of Cape Cod Bay. Afterward, they are hidden by higher clouds.
10.7-micrometer IR Satellite
In the IR satellite imagery, note the deepening cloud moving from the west from 00 through 21UTC on 14 January. As noted in the previous section, these upper clouds eventually hide from view the ocean effect bands near the Massachusetts coast.
Radar Reflectivity
The radar loop also clearly shows the westerly upper flow through a reflectivity pattern that advances across eastern Massachusetts and then moves offshore. This westerly upper flow with its associated precipitation becomes the dominant feature over eastern Massachusetts during the period. The synoptic lift is producing areas of steadier, more widespread snowfall but there are still pockets of heavy snowfall through about 22UTC in the vicinity of the remaining snow bands. Surface observations show that temperatures and dewpoints are slowly rising along the coast to the south of BOS and just inland. Also, slow veering in the surface winds is evident with gradually weakening wind speeds.
The ocean effect bands are clearly weakening and becoming more diffuse while they are visible in this loop. The bands are finally completely hidden by the reflectivities associated with precipitation due to the westerly flow at about 20UTC. Their remains probably still exist at that moment and for some time thereafter near the coast. Surface observations over eastern Massachusetts in the 17UTC 14 Jan-00UTC 15 January period indicate that moderate snowfall was common during this period, with a few observations of heavy snowfall. Two observations of heavy snow near Boston at 22UTC changed to light snow by 23UTC.
Specifically, the one particularly interesting area of enhanced snowfall is seen as a small white area that shows up to the southwest of Boston on the 1828UTC image of the radar loop. This area, with reflectivities near and above 28 dBz, moves slowly eastward and then curves northeastward toward Boston Harbour, finally dying out at about 1927UTC. It appears that some ocean effect bands temporarily exhibited higher reflectivities with heavier snowfall at about the same time as regions of higher reflectivity aloft (propagating from the west to the east) moved over the bands. The most likely explanation for this behaviour is a seeder-feeder effect due to the middle- to upper-level clouds in the westerly flow.
3.9-micrometer Satellite
Support for seeder/feeder effects in this case is also found in the 3.9-micrometer satellite imagery. The 3.9 channel senses a combination of solar reflected and emitted shortwave IR radiation during the day. Ice crystals are poorly reflective to incoming solar radiation at 3.9 µm, whereas water droplets are highly reflective to such radiation.
The loop goes from 1600-1915UTC. In these images, the darker tones represent areas of poor reflectance associated with ice clouds, while the brighter tones correspond to areas of higher reflectance associated with water clouds. The loop shows an area of ice crystal clouds (the dark areas) moving across Massachusetts and eastward over the Atlantic. These ice crystal clouds were in the right area to seed the lower ocean effect clouds during this period.
Soundings
The Eta 6-hour forecast sounding for BOS, valid 18UTC, shows a deep layer nearly saturated with respect to water (and therefore closer to saturation or even supersaturation in places with respect to ice) up through the middle levels of the atmosphere (at least 4570 m), well above the inversion.
In the seeder-feeder scenario, crystals initiated in the mid-level westerly flow could be growing rapidly at temperatures favorable for dendritic growth, and then falling into the ocean effect bands, where favorable microphysical conditions are also present. Alternately, small crystals initiated in the mid-level layers could grow rapidly once they fall into the inversion and below. In either scenario, the fetch of a potential source region for this seeder/feeder process could originate within the moist mid-level flow at some distance upstream of the quasi-stationary ocean effect bands.
One further point to note is that since the sounding is nearly saturated, the crystals can fall a long way from the middle levels without disappearing through sublimation.
Lake Effect Snow:
- The Challenge of Lake/Ocean Effect Snow
- Instability
- Lifting Mechanisms
- Fetch, Wind Speed, and Shear
- * Cloud and Precipitation Microphysics
- * Synoptic Setting
- * Snow Banding Processes
- * Satellite Imagery for Detection
Winter Precipitation Processes:
- Ice Crystal Growth
- The Ice-Crystal Process: Operational Significance
- * Characteristics of Natural Cloud Seeding
- * Satellite Imagery for the Detection of Natural Cloud Seeding in Winter
* = Most relevant topic for this page.
Case Summary
Overview
Between the evening of 13 January and early morning of 15 January 1999, eastern Massachusetts experienced regions of heavy snowfall. An area of 25-41 cm of snowfall accumulated south of Boston (BOS). The maximum amount of 41 cm was recorded in South Weymouth (NZW).
Ocean effect snowfall began over eastern Massachusetts during the evening hours of 13 January 1999 and continued overnight and through most of the day on the 14th. During the late afternoon of the 14th, an upstream system brought synoptic scale precipitation to the area. Most areas, especially north and west of Boston, received a few more hours of snowfall before it changed to rain. The first observation of light rain took place in Cape Cod at around 06UTC on 15 January. Subsequent heavy rain was observed at many locations through 15 January, with temperatures soaring to 7-13°C (45-55°F). Rain amounts of up to 50 mm were observed.
It was not possible to separate the ocean effect snow measurements from the synoptic snowfall measurements, so the observed amounts in this chart present the sum of both types of snowfall. It is estimated that not more than 5-10 cm of the snow was synoptically produced (Waldstreicher, 2002). Thus, some locations likely received up to 30 cm of ocean effect snow from this event.
The Case Summary begins with a synoptic view beginning approximately 36 hours prior to the time that most of the precipitation changed to rain, and narrows in on the mesoscale. Details of the low-level ocean effect snow with accompanying banding that contributed so much to the heavy snowfall amounts will be highlighted.
Note: This Case Summary provides a brief overview of the event. The Case Challenge provides a more in-depth analysis.
A Cold Front Moves Through
At 12UTC on 13 January, a high pressure center was located over Ontario, while very cold air covered Ontario and Québec. A frontal trough was found from southern Illinois to Nova Scotia with some snow associated with the front. As the high built and moved eastward, the front was pushed southward from the New England area.
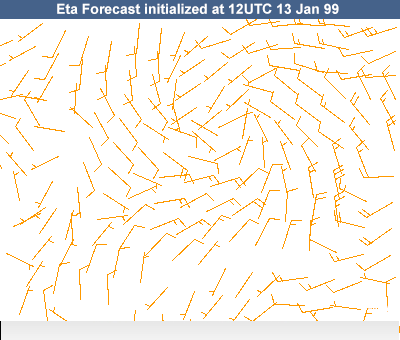
Use the time and field buttons to view Eta MSLP, 1000-500hPa thickness, 2m temperatures, and 10m winds at 12, 18, and 00UTC on 13 and 14 January.
1200UTC

1800UTC
0000UTC 14 Jan
Six hours later, at 18UTC, the cold front was approaching Cape Cod, coastal Connecticut, and Rhode Island. Very cold air moved across northern and central New England.
By 00UTC the cold front was well south of New England as cold air continued to move over the region. Note how the flow shifted to a northerly-to-northeasterly direction along the New England coast.
Cold Air Advection
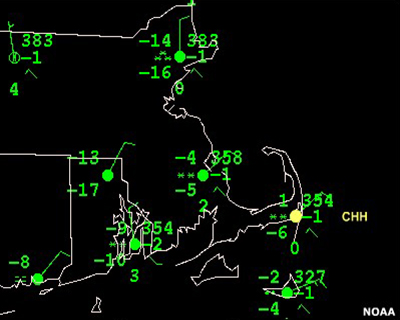
The 00UTC 14 January sounding at Chatham, Massachusetts (CHH) shows that a low-level cold layer extended to about 925 hPa. Note the backing winds with height, indicating cold advection. Temperatures near 850 hPa at this time were in the range of 0 to 2°C. Also note that the sounding below 700 hPa is saturated, or nearly so.
Use the radio buttons to view each station's sounding.

At the same time, 00UTC on 14 January, the sounding at Gray, Maine (GYX) shows a much deeper layer of cold air. The 850hPa temperature is -13°C. Buoy data indicated that ocean water temperature was approximately 4°C. The ocean-to-850hPa temperature difference, (delta-T), of 17°C indicates considerable instability, which could lead to ocean effect snow development given the appropriate wind scenario. The subsidence inversion, indicated by both increasing temperatures and abrupt drying, is based slightly above 850 hPa.
For more information on the relationship of the lapse rate over bodies of water and the implications for lake/ocean effect snow, please view the accompanying Supporting Topics.
Lake Effect Snow:
- * The Challenge of Lake/Ocean Effect Snow
- * Instability
- Lifting Mechanisms
- * Fetch, Wind Speed, and Shear
- Cloud and Precipitation Microphysics
- * Synoptic Setting
- Snow Banding Processes
- Satellite Imagery for Detection
Winter Precipitation Processes:
- Ice Crystal Growth
- The Ice-Crystal Process: Operational Significance
- Characteristics of Natural Cloud Seeding
- Satellite Imagery for the Detection of Natural Cloud Seeding in Winter
* = Most relevant topic for this page.
Enhancement of the NNE Flow across Eastern New England
By 06UTC on 14 January, the surface high over southwest Quebec had strengthened to a central pressure of 1052 hPa, further enhancing the cold, northeasterly low-level flow across eastern New England and its coastal waters.

Ocean Effect Set Up
At this point, conditions for ocean effect for the Boston area are evident. The Boston (BOS) sounding for 06UTC on 14 January shows the following important features:
- A very cold and moist boundary layer
- A strong inversion at around 925 hPa
- The sounding is very moist—nearly saturated—all the way up through 600 hPa
- North-northeasterly flow in the low levels with west winds above the inversion
- The ocean-to-850hPa temperature difference, delta-T, is only 11°C, smaller than the commonly used 13°C threshold (which roughly corresponds to a dry adiabatic lapse rate from the sea surface up to the 850hPa level) indicating potential for lake or ocean effect snow. However, the 850 level is well above the base of the inversion, where temperatures are as low as -17°C. This results in an extremely unstable 20°C temperature differential between the water surface and the base of the inversion.
View the accompanying Supporting Topics on lake/ocean effect snow for more information.
Lake Effect Snow:
- * The Challenge of Lake/Ocean Effect Snow
- * Instability
- Lifting Mechanisms
- * Fetch, Wind Speed, and Shear
- Cloud and Precipitation Microphysics
- * Synoptic Setting
- Snow Banding Processes
- Satellite Imagery for Detection
Winter Precipitation Processes:
- Ice Crystal Growth
- The Ice-Crystal Process: Operational Significance
- Characteristics of Natural Cloud Seeding
- Satellite Imagery for the Detection of Natural Cloud Seeding in Winter
* = Most relevant topic for this page.
Ocean Effect Snow with Banding
The 4-km resolution (pixel size) 10.7-µm IR loop follows the same general pattern in the vicinity of New England for the 22-hour period 03UTC on 14 January through 00UTC on 15 January. This pattern has the middle- and upper-level clouds invading the Massachusetts area from the west. Much of the region over the course of this time period experienced areas of light snow and, later on, rain of varying intensity.
The Taunton (BOX) radar loop for the same 22-hour period follows in more detail the evolution of the precipitation. Ocean effect bands of heavy snow began to appear in the Boston area at around 03UTC, in addition to the more widespread light snow related to the westerly upper flow. Ocean effect bands of heavier snow to the east and south of the Boston area were approximately parallel to the prevailing low-level winds.
These bands moved slowly from east to west. The westward motion of the ocean effect bands over the Atlantic is also nicely shown in the 2-km resolution visible satellite loop in the period 1332 to 2032UTC. Though this loop only covers 7 hours, the ocean effect bands persisted for close to 16 hours and continued to produce heavy snow in some areas through part of the afternoon.
Depth of Ocean Effect Bands
The ocean effect bands were composed of convective clouds with their tops in the vicinity of the inversion. Through the use of radar data and compared to model sounding data, it was shown that the tops of the bands were in the range of 1200-1600 m (4000-5000 ft) above the surface. (For more on this, see the Discussion section in Question 6 of the Case Challenge.)
GOES-8 2-km VIS, 10.7-µm, 3.9-µm at 16UTC 14 Jan 99
Eta Forecast Sounding for Boston, valid 18UTC initialized 12UTC 14 Jan 99
The nature of these ocean effect bands was such that heavy snow was produced from bands that were much shallower than clouds in a traditional synoptic system for equivalent amounts of snow. In addition to the cloud-top measurements discussed in Question 6 of the Case Challenge, an estimate of the tops of the ocean effect bands can also be obtained from available IR imagery.
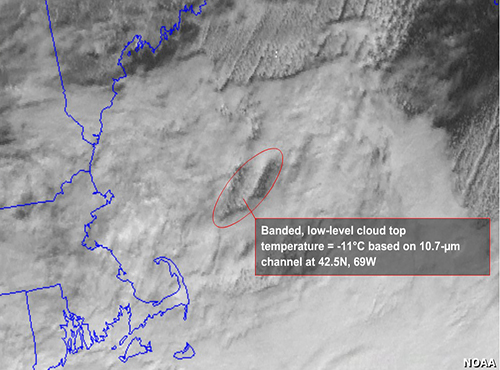
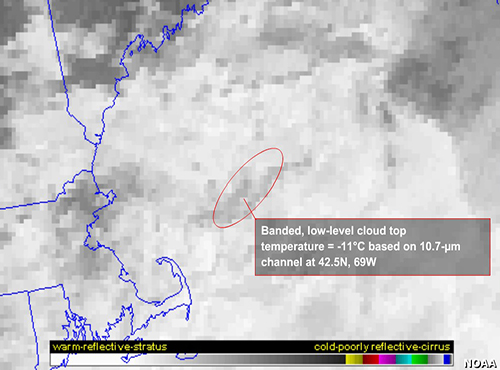
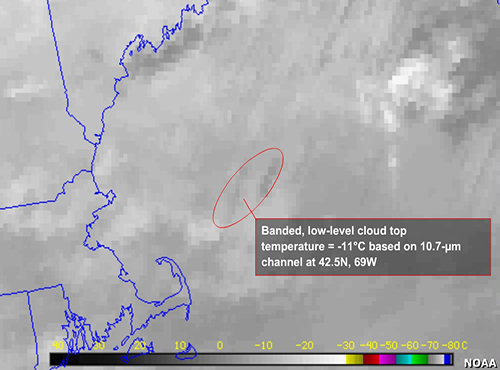
At around 16UTC on 14 January, a hole appeared in the mid-level cloud over the ocean off the New England coast. This hole can be clearly seen at 1602UTC on the visible, 10.7-µm IR, and 3.9-µm channels of the satellite loop. The ocean effect clouds can be seen through the hole near 42.5N, 69W. A close look at the IR temperature at that point gives a value of -11°C.
The Eta 06-hour forecast sounding at that point, valid 18UTC on 14 January, shows a temperature of -11°C at a level of about 875 hPa. This corresponds to a height of about 1370 m (4,500 ft), which falls in the range of values already calculated by the radar and IR imagery.
Ocean Effect Banding and Horizontal Roll Convection
The radar and satellite imagery both indicated a slow westward movement of the ocean effect snow bands. It is believed that such bands are an example of horizontal roll convection. In these bands, individual convective elements move with the mean low-level wind—in this case, from the northeast to the southwest. No clear explanation for the observed slow westward motion of such bands exists, however.
The observed hodograph at Chatham at 12UTC on 14 January shows northeasterly winds in the low-levels becoming northwesterly or westerly at higher levels above the inversion. The wind shear direction was from the southwest in this case. The main point to note from this hodograph is that the cold advection implied by the backing of the wind with height was acting to maintain the low-level cold air at that time, which in turn maintained the low level instability with respect to the lowest levels.
Heavy Snow and Cloud Microphysics
Much of the heavy snow in this case can partly be attributed to the microphysics of the setting. Though the bands were contained below the relatively shallow inversion layer and a little over 1 km in height, their temperature and water vapor content were primed for producing copious amounts of precipitation in the form of snow.
A look at the Boston sounding for this time period reveals that the temperature in and below the inversion layer included a zone of -12 to -18°C, the optimal temperature for crystal initiation and rapid growth of large dendrites. Also take note of the nearly saturated layer near 600 hPa in the same dendritic temperature range. Any crystal forming in this region fell through a relatively warmer and saturated layer between 850 and 650 hPa. Dendrites would not dissipate in these conditions, but instead would most likely grow through aggregation and subsequently fall into another dendritic growth zone under the inversion.
For more information on winter cloud microphysics, see the accompanying Supporting Topics.
Lake Effect Snow:
- The Challenge of Lake/Ocean Effect Snow
- Instability
- Lifting Mechanisms
- Fetch, Wind Speed, and Shear
- Cloud and Precipitation Microphysics
- Synoptic Setting
- Snow Banding Processes
- Satellite Imagery for Detection
Winter Precipitation Processes:
- * Ice Crystal Growth
- * The Ice-Crystal Process: Operational Significance
- Characteristics of Natural Cloud Seeding
- Satellite Imagery for the Detection of Natural Cloud Seeding in Winter
* = Most relevant topic for this page.
Seeder/Feeder Effect
An overriding source of ice crystals in this case provided enhancement of the snowfall produced by the shallow ocean effect bands via a seeder/feeder process. As was seen in the previous soundings, a nearly saturated layer was present at about 600 hPa with a temperature around -15°C. Ice crystals and snow forming and falling from middle-layer clouds into lower-level cloud bands most likely acted as seeds for increased crystal production below the inversion and provided more dendrites for aggregation.
Radar during this time period confirms this by showing an increase in reflectivity in the banded areas as higher clouds move across from west to east.
Examination of 3.9-micrometer satellite imagery during the times of reflectivity enhancement confirmed that mid-level clouds likely contained primarily ice crystals. The darker areas with yellow highlights upstream from Boston show regions of lower reflectance for liquid. These are areas of clouds saturated for ice.
Precipitation Change
Surface Observations
CHH Sounding
The surface high pressure center continued to move eastward on 14 January. During this time, the easterly component of the low-level flow over eastern New England gradually increased. At the same time, warm advection associated with the incoming synoptic-scale disturbance advanced northeastward toward New England.
By around 20UTC, the low-level inversion had weakened to the point where the ocean effect snowbands dissipated. Synoptic-scale snow continued beyond this time over parts of New England, though. At 00UTC on 15 January, the observed sounding at CHH still shows some cold air in the low levels, and the surface chart shows that snow was falling at some stations in the Massachusetts area. Warm advection intensified overnight, the surface winds continued to veer, and the precipitation changed to rain. By 12UTC, heavy rain was falling at some locations in Massachusetts.
This is the end of the Case Summary.
Please take our User Survey
Resources
This case exercise is based on an article by Jeff Waldstreicher:
Waldstreicher, Jeff S., 2002: A foot of snow from a 3000-foot cloud: The Ocean-Effect Snowstorm of 14 January 1999. Bulletin of the American Meteorological Society: Vol. 83, No. 1, pp. 19-22.
Contributors
COMET Sponsors
- Air Force Weather Agency (AFWA)
- Meteorological Service of Canada (MSC)
- National Environmental Satellite Data and Information Service (NESDIS)
- Naval Meteorology and Oceanography Command (NMOC)
- National Oceanic and Atmospheric Administration (NOAA)
- National Polar-orbiting Operational Environmental Satellite System (NPOESS)
- National Weather Service (NWS)
Principal Science Advisors
- Peter Lewis — MSC
- Garry Toth — MSC
- Dr. Doug Wesley — UCAR/COMET
Project Lead/Instructional Design
- Bruce Muller — UCAR/COMET
- Patrick Parrish — UCAR/COMET
Multimedia Authoring
- Bruce Muller — UCAR/COMET
- Dan Riter — UCAR/COMET
Audio Editing/Production
- Seth Lamos — UCAR/COMET
Audio Narration
- Dan Riter — UCAR/COMET
Computer Graphics/Interface Design
- Heidi Godsil — UCAR/COMET
Illustration/Animation
- Steve Deyo — UCAR/COMET
Software Testing/Quality Assurance
- Michael Smith — UCAR/COMET
Copyright Administration
- Lorrie Fyffe — UCAR/COMET
Data Provided by
- MSC
- NWS — NOAA
COMET HTML Integration Team 2021
- Tim Alberta — Project Manager
- Dolores Kiessling — Project Lead
- Steve Deyo — Graphic Artist
- Ariana Kiessling — Web Developer
- Gary Pacheco — Lead Web Developer
- David Russi — Translations
- Tyler Winstead — Web Developer
COMET Staff, 2003
Director
- Dr. Timothy Spangler
Deputy Director
- Dr. Joe Lamos
Meteorologist Resources Group Head
- Dr. Greg Byrd
Business Manager/Supervisor of Administration
- Elizabeth Lessard
Administration
- Lorrie Fyffe
- Bonnie Slagel
- Penina Frager
Graphics/Media Production
- Steve Deyo
- Heidi Godsil
- Seth Lamos
- Dan Riter
Hardware/Software Support and Programming
- Tim Alberta (Supervisor)
- David Ellis (Student)
- James Hamm
- Karl Hanzel
- Ken Kim
- Mark Mulholland
- Max Parris (Student)
- Carl Whitehurst
Instructional Design
- Patrick Parrish (Supervisor)
- Dr. Alan Bol
- Dr. Vickie Johnson
- Bruce Muller
- Dr. Sherwood Wang
Meteorologists
- Dr. William Bua
- Patrick Dills
- Kevin Fuell
- Jonathan Heyl (Student)
- Dr. Stephen Jascourt
- Dolores Kiessling
- Heather McIntyre (Student)
- Wendy Schreiber-Abshire
- Dr. Doug Wesley
Software Testing/Quality Assurance
- Michael Smith (Coordinator)
National Weather Service COMET Branch
- Anthony Mostek (National Satellite Training Coordinator)
- Brian Motta
- Elizabeth Mulvihill Page
- Dr. Robert Rozumalski (SOO Science and Training Resource Coordinator [SOO/STRC])
Meteorological Service of Canada Visiting Meteorologists
- Peter Lewis
- Garry Toth