Case Profile
Case Overview
Geographical Location:
Southern prairies of Canada and US
northern high plains, centered around Medicine Hat, Alberta
Case Timeframe:
11-13 November 2003
Phenomena of Interest:
Alberta Clipper and the associated
snowfall and blowing snow
Forecasting Challenges:
- Recognize the key synoptic ingredients that can lead to the development of an Alberta Clipper
- Determine the track of an Alberta Clipper
- Assess snowfall amounts associated with a clipper
- Identify signals in the satellite and radar imagery as well as in the NWP data that can be associated with these systems
This case study focuses on a snow and blowing snow event in the Canadian prairies and US northern high plains on 11-13 November 2003. The key aim of this module is to step through the forecast process during an Alberta Clipper event from the perspective of a forecaster with the Meteorological Service of Canada. This involves consideration of various observations and model guidance, identification of potential areas of snowfall and blowing snow, nowcasting snowfall development and termination, and considering and providing nowcast updates throughout.
An Alberta Clipper is a low pressure system that is typically fast-moving and originates in western Canada. It usually moves south and east across the prairies towards, and sometimes across, the Great Lakes region. It is often associated with a narrow but significant band (or bands) of snowfall, and occurs most often and is most intense during the cold season. These systems represent a winter forecasting challenge as they are often difficult to predict more than 12 hours ahead of time, and they can shut down highways with heavy blowing/drifting snow. Severely restricted visibility, slowdowns in all transportation systems, and dangerously low wind chills are other public impacts.
This case is presented in three main parts:
- A Case Profile which introduces the case setting and the current forecast data
- A Case Challenge consisting of a series of forecast questions focused on three key time points in the case
- A Post-event Analysis with a brief analysis of how the case unfolded
Geographic Setting
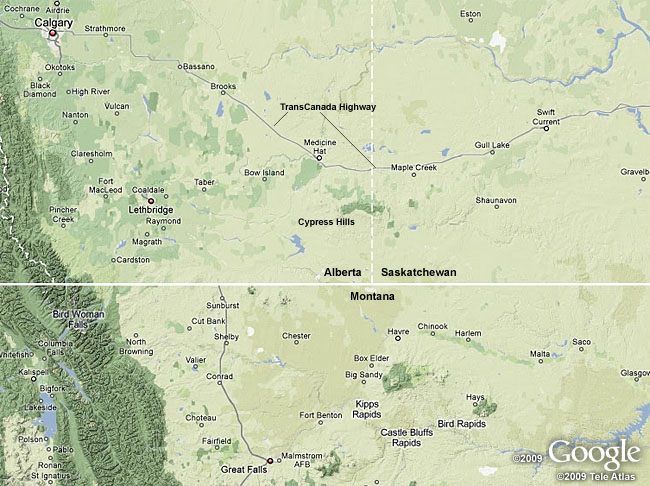
The geographic setting for this case study includes the southern prairies of Alberta and Saskatchewan, which lie to the east of the Rocky Mountains and west of the lake country of Manitoba.
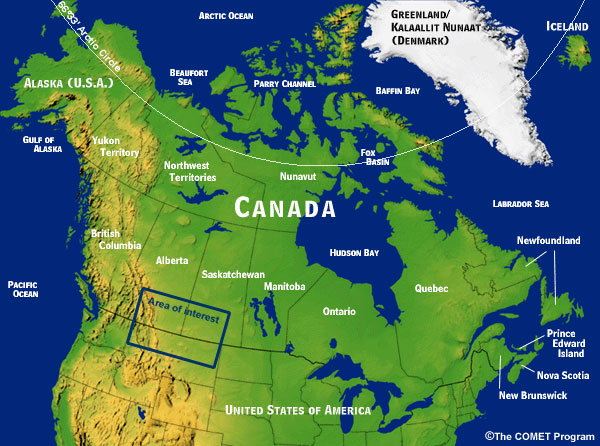
This vast area is host to endless acres of irrigated cropland, dairy farms, and oil and gas reserves. A major branch of the Trans-Canada Highway traverses the open plains here, connecting Calgary, Alberta with Regina, Saskatchewan via Medicine Hat. Medicine Hat is geographically situated in the center of our area of interest.
Climatology for Medicine Hat, Alberta Canada
Latitude: 50° 1.133' N
Longitude: 110° 43.250' W
Elevation:
716.90 m
If you are connected to the web, you can explore the Medicine Hat area here:
|
Climatology for Medicine Hat, Alberta Canada
|
|||
|---|---|---|---|
| Temperature | Oct | Nov | Dec |
| Daily Average (°C) | 7 | -2.2 | -7.9 |
| Daily Maximum (°C) | 14 | 3.6 | -2.2 |
| Daily Minimum (°C) | -0.1 | -8 | -13.6 |
| Precipitation | Oct | Nov | Dec |
| Rainfall (mm) | 11.7 | 2.7 | 0.9 |
| Snowfall (cm) | 7 | 15.2 | 16.6 |
| Precipitation (mm) | 18.5 | 15.8 | 14.7 |
| Average Snow Depth (cm) | 0 | 2 | 4 |
| Median Snow Depth (cm) | 0 | 1 | 4 |
| Snow Depth at Month-end (cm) | 1 | 3 | 7 |
| Extreme Daily Rainfall (mm) | 42.4 | 22.1 | 11.2 |
| Date (yyyy/dd) | 1914/04 | 1884/26 | 1900/01 |
| Extreme Daily Snowfall (cm) | 21.6 | 32.2 | 22.9 |
| Date (yyyy/dd) | 1942/27 | 1990/24 | 1945/07 |
| Extreme Daily Precipitation (mm) | 42.4 | 26.7 | 22.9 |
| Date (yyyy/dd) | 1914/04 | 1958/14 | 1945/07 |
| Extreme Snow Depth (cm) | 25 | 50 | 43 |
| Date (yyyy/dd) | 1957/23 | 1990/26 | 1964/29+ |
| Days with Rainfall | Oct | Nov | Dec |
| >= 0.2 mm | 4.3 | 1.9 | 0.79 |
| >= 5 mm | 0.86 | 0.14 | 0.03 |
| >= 10 mm | 0.24 | 0 | 0 |
| >= 25 mm | 0 | 0 | 0 |
| Days With Snowfall | Oct | Nov | Dec |
| >= 0.2 cm | 2.3 | 6.9 | 8.7 |
| >= 5 cm | 0.48 | 0.86 | 0.76 |
| >= 10 cm | 0.14 | 0.17 | 0.14 |
| >= 25 cm | 0 | 0.07 | 0 |
| Days with Precipitation | Oct | Nov | Dec |
| >= 0.2 mm | 5.9 | 8 | 8.9 |
| >= 5 mm | 1.2 | 0.9 | 0.62 |
| >= 10 mm | 0.41 | 0.14 | 0.07 |
| >= 25 mm | 0.03 | 0 | 0 |
| Wind | Oct | Nov | Dec |
| Speed (km/h) | 14.6 | 14.1 | 14.8 |
| Most Frequent Direction | SW | SW | SW |
| Maximum Hourly Speed | 83 | 80 | 77 |
| Date (yyyy/dd) | 1991/16 | 1962/19+ | 1953/28 |
| Direction of Maximum Hourly Speed | SW | SW | W |
| Maximum Gust Speed | 126 | 145 | 116 |
| Date (yyyy/dd) | 1991/16 | 1962/19 | 1963/31 |
| Direction of Maximum Gust | W | SW | SW |
| Days with Winds >= 52 km/h | 1.3 | 1.2 | 1.4 |
| Days with Winds >= 63 km/h | 0.4 | 0.3 | 0.4 |
| Bright Sunshine | Oct | Nov | Dec |
| Total Hours | 184.2 | 116.6 | 94.1 |
| Days with measureable | 28.6 | 24.4 | 24 |
| % of possible daylight hours | 55.1 | 42.7 | 37.2 |
| Extreme Daily | 11.3 | 9.6 | 8.2 |
| Date (yyyy/dd) | 2000/06 | 1971/06 | 1975/05 |
| Humidex | Oct | Nov | Dec |
| Extreme Humidex | 30.7 | 22.8 | 17.2 |
| Date (yyyy/dd) | 1964/12 | 1975/04+ | 1962/15 |
| Days with Humidex >= 30 | 0 | 0 | 0 |
| Days with Humidex >= 35 | 0 | 0 | 0 |
| Days with Humidex >= 40 | 0 | 0 | 0 |
| Wind Chill | Oct | Nov | Dec |
| Extreme Wind Chill | -37.6 | -49.2 | -58.9 |
| Date (yyyy/dd) | 1991/29 | 1985/27 | 1968/28 |
| Days with Wind Chill < -20 | 0.5 | 5.1 | 12.9 |
| Days with Wind Chill < -30 | 0.1 | 1.6 | 5.6 |
| Days with Wind Chill < -40 | 0 | 0.2 | 1.8 |
| Humidity | Oct | Nov | Dec |
| Average Vapour Pressure (kPa) | 0.6 | 0.4 | 0.3 |
| Average Relative Humidity - 0600LST (%) | 73.1 | 75.9 | 74 |
| Average Relative Humidity - 1500LST (%) | 41.9 | 58.6 | 64.9 |
| Pressure | Oct | Nov | Dec |
| Average Station Pressure (kPa) | 93.1 | 93 | 93.1 |
| Average Sea Level Pressure (kPa) | 101.6 | 101.6 | 101.8 |
| Visibility (hours with) | Oct | Nov | Dec |
| < 1 km | 3.2 | 6.8 | 6.6 |
| 1 to 9 km | 24.9 | 58.2 | 76.3 |
| > 9 km | 715.9 | 654.9 | 661.1 |
| Cloud Amount (hours with) | Oct | Nov | Dec |
| 0 to 2 tenths | 225.3 | 172.6 | 172 |
| 3 to 7 tenths | 195.9 | 172.5 | 171.4 |
| 8 to 10 tenths | 322.9 | 375 | 400.7 |
|
Data
based on Canadian Climate Normals 1971-2000
Canadian National Data and Information Archives https://climate.weather.gc.ca/climate_normals/index_e.html |
|||
Climatology of Alberta Clippers
One of the many challenges in winter forecasting in this region are fast-moving, snow-producing systems known as Alberta Clippers. The Alberta Clipper is an intense and rapidly moving storm that typically produces strong winds that can cause short-duration blizzard conditions and other hazardous winter weather such as extreme wind chill values.
A rapidly building anticyclone usually moves southward behind the system, creating a strong low-level pressure gradient in the wake of the low. Blowing and drifting snow can last for hours after the departure of the low and the end of the precipitation.
Alberta Clippers tend to originate from a weak wave crossing the Rocky Mountains and move quickly across the southern Canadian Prairies or northern High Plains of the United States.
There are typically NWP challenges associated with these systems, including problems in the 1-2 day time frame. Also, because of the rapid easterly motion of the system, the system-relative winds are significantly greater than the actual winds on the northeastern side of these storms. This leads to more lift and greater precipitation intensity than would be expected with the weaker earth-relative winds that are observed on the northeastern or eastern side of these storms.

Alberta Clippers do not have deep central pressures. Their lack of available moisture and rapid movement conspire to produce relatively low precipitation amounts over a narrow path, but 8-15 cm of snowfall in 3-6 hour interval is typical. The snowfall usually exhibits a large snow-to-liquid equivalent ratio. Snowfall amounts downstream can be enhanced through an influx of moisture from the Great Lakes, and/or through locally intense large-scale forcing in the presence of low conditional stability.
During the October- March period, Alberta Clippers occur most frequently during December-January and less frequently before and after. Less than 10% of the cases track south of the Great Lakes. Over the course of the pre-lee cyclogenesis phase, a cyclone over the Gulf of Alaska approaches the west coast of N. America, and upon interaction with the mountainous terrain of western North America, spawns a surface lee trough, characterized by a thermal ridge at 850 mb, east of the Canadian Rockies. The clipper then evolves from a lee cyclone into a more classically structured mid latitude cyclone, largely as a result of rotation of the low-level thermal gradient and the increasing westward tilt with height of the composite clipper. Persistently through the lifetime of the composite clipper, the 500 mb vorticity maximum is displaced westward of the SLP minimum.
For a more detailed study on the climatology of Alberta clippers, please see A Synoptic Climatology and Composite Analysis of the Alberta Clipper by Thomas and Martin, Weather and Forecasting, Volume 22, April 2007
Synoptic Setup, 1400 UTC 10 Nov
At 1200 UTC 10 November 2003 (Monday), a strong, anticyclonically-curved 250 mb jet is located over the northern Pacific Ocean and is moving up and over a long wave ridge and heading toward the Queen Charlotte Islands. Weak surface troughing is approaching the central British Columbia coast at this time.
Use the control buttons in this data viewer to pause, play, and step through the time series in this model run:
The MSLP prediction by the GEM shows a weak low developing by 06 UTC 11 November over southern British Columbia in response to the upper jet. This low slowly intensifies and moves east-south-eastward through the remaining 30 hours of the model run. The 1001-mb low is positioned over extreme southern AB and SK by 12 UTC 11 November. As it progresses through extreme northeastern Montana, the pressure gradient on its northern and western side is increasing rapidly.
The Glasgow, MT NWS office has issued a high wind watch for portions of northeastern Montana for 11 November. This watch was originally issued on 9 November and was still in the forecast on the morning of the 10th.
Area Forecast Discussion
Here are recent forecast discussions from the Glasgow, MT NWS forecast office. They provide insight on forecasters' interpretations of model and observed data in the nearby NWS forecast offices. They emphasize aspects of the situation in the context of important forecast parameters, such as anticipated wind, precipitation type, and snowfall accumulation.
Use the tabs to access all of the forecast discussions:
0900 UTC 9 Nov - GGW
0900 UTC 9 NOV - GGW (GLASGOW, MT)
TWO MAIN CONCERNS IN THE SHORT TERM...SECOND IS CLIPPER SYSTEM TO IMPACT THE AREA BY TUES. (NOV. 11). DETAILS: MONDAY NIGHT...WESTERLY FLOW ALOFT CONTINUES WITH ENERGY ZIPPING THROUGH SOUTHERN CANADA. TUES...ALBERTA CLIPPER PUSHES INTO NORTHERN MT DURING THE DAY. GFS MUCH STRONGER WITH THIS SYSTEM THAN OTHER MODELS. FAST MOVING SYSTEM SO MY NOT GET MUCH PRECIP OUT OF IT. SURFACE LOW INTO ND BY LATE AFTERNOON WITH GRADIENT TIGHTENING UP AND COLD AIR ADVECTION FOR INCREASED WINDS AND POSSIBLE FALLING TEMPERATURES IN THE AFTERNOON. TUES. NIGHT...RATHER STRONG SHORT WAVE TROUGH TO EXIT NORTHEAST MT WED. MORNING WITH PRECIP RAPIDLY ENDING FROM THE WEST. (NO HIGHLIGHTS, IE. NO ADVISORIES OR WARNINGS)
1926 UTC 9 Nov - GGW
1926 UTC 9 NOV - GGW (GLASGOW, MT)
DEEP UPPER LEVEL TROUGH OFF THE PACIFIC COAST WILL CONTINUE TO DIG ALONG THE PACIFIC COAST OVER THE NEXT FEW DAYS. AS THIS SYSTEM DIGS SOUTH...WESTERLY FLOW ALOFT SETS UP OVER NORTHEAST MT...A RATHER ROBUST SYSTEM WILL DROP SOUTHEAST OUT OF ALBERTA MON. NIGHT AND INTO TUES. THE SURFACE LOW TRACK STAYS NORTH OF HERE AND MAJORITY OF PRECIPITATION SHOULD REMAIN IN CANADA. STRONG PRESSURE GRADIENT DEVELOPS BEHIND COLD FRONT DURING THE DAY ON TUES.. 50-60 KT WINDS AT BOTH 850 MB AND 700 MB MOVE INTO COUNTY WARNING AREA (CWA) ON TUES. AS WELL. WITH LAPSE RATES AROUND 7C/KM...EXPECT WIDESPREAD WIND EVENT. WILL ISSUE HIGH WIND WATCH FOR TUES. ACROSS ENTIRE CWA.
LONG TERM: TUES. SYSTEM STILL LINGERS AT THE START OF THE PERIOD (TUES. NIGHT). TWEAKED POPS A BIT TO NAIL DOWN SOME TIMING...WITH PRECIPITATION MOVING FROM WEST TO EAST. HAVE WORDED PRECIPITATION AS A MIX EARLY...AS INDICATED BY MODEL SOUNDINGS...THEN SNOW LATER ON. WINDS WILL ALSO BE AN ISSUE INTO THE EVENING HOURS. IMPRESSIVE PRESSURE RISES ALONG WITH STRONG WINDS ALOFT AND COLD AIR ADVECTNG RATHER STRONG UNTIL MIDNIGHT. HAVE A CONCERN WITH THE DIFFERENCES IN THE MODELS WITH THIS SYSTEM WITH UKMET AND CANADIAN BEING MUCH WEAKER SO WILL CONTINUE TO MONITOR SITUATION CAREFULLY.
HIGH WIND WATCH ALL ZONES ON TUES. 11 NOV.
0835 UTC 10 Nov - GGW
0835 UTC 10 NOV - GGW (GLASGOW, MT)
ALBERTA CLIPPER EXPECTED ON TUES. (NOV. 11) TO BRING CHANCE OF PRECIP AND
STRONG WINDS TO THE REGION. WILL CONTINUE HIGH WIND WATCH FOR TUES. FOR
ALL ZONES.
TUES...WINDS BEGIN TO INCREASE EARLY OVER THE WEST
WITH NEXT STRONG SHORTWAVE PUSHING INTO WESTERN MT AND CLIPPER LOW OVER
SOUTHERN AB. DOWNSLOPE WEST WINDS WILL DEVELOP EARLY THEN SPREAD EAST
THROUGH THE DAY AS LOW TRACKS ALONG THE CANADIAN BORDER. SOME
UNCERTAINTY OF HOW FAR SOUTH THE LOW WILL TRACK...WHETHER IT WILL BE IN
CANADA OR MT...BUT SOUTHERN ZONES WILL LIKELY HAVE THE STRONGEST WINDS.
WITH THE LOW TO THE NORTH CHANCE OF PRECIP SOMEWHAT LIMITED. ALSO
TEMPERATURE PROFILE IN THE REALM OF MIXED PRECIP. FOR NOW WITH THE
MINIMAL CHANCE OF PRECIP WILL LIMIT MENTION TO MIX OF RAIN AND SNOW BUT
FREEZING RAIN OR SLEET ALSO POSSIBLE. MODELS HAVE BACKED OFF ON THE
WINDS ALOFT FOR TUES....NOW IN THE 40-50 KT RANGE AT BOTH 850 AND 700
MB...(WINDS) LOOK MARGINAL FOR WARNING CRITERIA BUT STRONG ENOUGH THAT
WILL KEEP HIGH WIND WATCH IN PLACE.
Notable Model Features for 1200 UTC 10 Nov
Here are several NWP plots from the GEM-15 model run initialized at 1200 UTC November 10.
Note the WNW-ESE oriented band of upward motion at 700 mb predicted by the GEM for 1800 UTC November 11 over southeastern Alberta and southwestern Saskatchewan.
Also, strong 850mb frontogenesis is predicted for 0000 UTC November 12 over northern Montana and southeastern Alberta.

The model also forecasts significant precipitation through southern Saskatchewan between 1800 UTC November 11 and 0000 UTC November 12.
More Area Forecast Discussions
Before moving on to the Forecast Challenge, here are portions of other forecast discussions from Glasgow (GGW), Montana and one from Bismarck (BIS), North Dakota later on 10 November.
1515 UTC 10 Nov - GGW (Glasgow MT)
...Clipper-type system for tomorrow. Eta has backed off on possible wind event for Tues.GFS remains strong...and UKMET still remains rather weak as well. Will let high wind watch ride for now and address issue later today. (High Wind Watch for all zones on Tues.)
2015 UTC 10 Nov - GGW (Glasgow MT)
Forecast focus in the short term still on winds for Tues.and possible snow in the northeast corner. Models still not in the best agreement today with GFS continuing to be strongest solution. Noted that GFS also much stronger with lows at 700 mb and 850 mb.as well as surface features. Even with differences in strength of this system.models in agreement in developing a fast moving clipper-type system.zipping across the forecast area during the day Tues... For tonight.winds increase and atmosphere becomes unstable with surface low tracking over the area. System will pose a number of challenges.first of which is wind. GFS and Eta continue to show 35 to 40 kts of wind aloft over the southern part of the CWA with steep lapse rates. Feel there is little chance of places north of the Missouri R. to reach warning criteria.so will cancel watch there. Will let watch ride for the south for now (but) with model trend of decreasing wind intensity. Other impact with this system in the form of precipitation.and challenge of precipitation type. Model sounding indicate some freezing rain possible in central part of forecast area. In the northeast corner.should stay snow for almost the entire time. In the south and southwest.will see rain initially.then a mix.then changing to snow. Eta and new 18Z Meso-Eta paint heavy band of qpf in northeastern corner. This appears to be associated with strong frontogenesis at 850 mb and deep (negative) omega. BUFKIT also showing deep omega occurring in the favored snow growth layer.so could see a short period of heavy snow.with 2 to 4 inches before ending. Problematic part is that GFS shows no indication at this point of heavy qpf or strong frontogenesis. For now.will boost POPs up to high chance and give incoming shifts the heads up with possible advisory needed at a later point. ...Tues. night.precipitation chances lingering in the east. At this point.any precipitation will be all snow.
2135 UTC 10 Nov - BIS
2135 10 NOV - BIS (BISMARCK, ND)
SHORT RANGE: Main problem today is strength and path of clipper moving through northern portion of CWA. Models in some disagreement with position and strength of (this) system. The Eta is weakest and in agreement with the NGM with position of heavy snow band through north central portion of state. AVN has QPF north of Canadian border with very strong gradient developing late Tuesday (11 Nov.) and Wednesday. Consensus between WFOs and in agreement with HPC will follow Eta solution with this run. With the above scenario...no need for headlines at this time.
Case Challenge
2100 UTC 10 Nov
2100 UTC 10 Nov: Current Setting
The Challenge consists of a series of questions at key times as the event progresses. The timeline located on each page will update as time progresses. The initial timepoint for this case is 2100 UTC Monday, November 10.

You're currently working on the 4 PM forecast issued for tonight and Tuesday. Observe the track and strength of the MSLP low on the GEM 15-km model run from 1200 UTC November 10. The model forecast 250mb winds are also viewable.
Use the radio buttons to switch between the data products:
Question
How does the track of this low relate to the Alberta Clipper climatology? (Choose the best answer.)
The correct answer is b)
At 12 UTC November 10, the GEM predictions show a weak surface trough approaching the central British Columbia coast.
Then a weak low develops by 06 UTC November 11 over southern British Columbia in response to the upper jet.
It then slowly intensifies and moves east-southeastward through the remaining 30 hours of the model run as a 1002 mb low positioned over northern Minnesota by 06 UTC November 12.
As this low progresses through extreme northeastern Montana, the pressure gradient on its northern and western side increases rapidly. The track of this system puts it within the climatological envelope, but on the southern edge, for surface pressure tracks for Alberta Clippers. The model forecast speed of the system is high, with about 21 hours required for the low to travel from just to the lee side of the Rockies to northern Minnesota. This speed is somewhat higher than that of the average Alberta Clipper.
2100 UTC 10 Nov: Forecasting Issues
Here are composites of the 850mb heights, temperature, and winds and the 700mb heights, winds and relative humidity for the 12 UTC model run. Use the radio buttons to switch between the data products:
Question
It's your responsibility to write a 2200 UTC-issued forecast for November 11 over southern Alberta, Saskatchewan, and Montana. Based on your analysis of the accompanying 850 and 700mb fields, make a choice from the following: (Choose the best answer.)
The correct answer is b)
At 700 mb, the disturbance is first noticeable at 00 UTC November 11 as a weak wave, oriented NNW-SSE, moving eastward over the elevated terrain of western British Columbia. The wave is approaching the British Columbia/Alberta border at 06 UTC November 11, and by 12 UTC an extended area of 80%+ RH values accompanies the open wave over southwestern Alberta. At 18 UTC, it is digging into southwestern Saskatchewan and this trend continues 6 hours later with a weak circulation accompanied by significant moisture over southern Saskatchewan . The moisture field begins to take on a cyclonic shape by 06 UTC November 12 over northern North Dakota.
By 18 UTC November 10 a weak 850 mb trough is coming ashore over coastal British Columbia. This wave begins to intensify by 06 UTC November 11 over the higher terrain of British Columbia and Alberta, and by 12 UTC a wind circulation is noted over southwestern Alberta on a north-south oriented thermal ridge, moving east-southeastward. It becomes a closed low by 18 UTC over southwestern Saskatchewan and continues to intensify, reaching the North Dakota /Saskatchewan border at 00 UTC November 12.
Note that the following forecast was issued by the Prairie and Arctic Storm Prediction Centre (PASPC) for the Cypress Hills at 21 UTC:
For Tuesday, November 11: cloudy, 60% chance of flurries. Wind
becoming west 30 gusts to 60 km/hr near noon. Hi 0C.
For the
forecast zone just east of the Cypress Hills, the forecast was for
periods of steady snow beginning after noon Tuesday with
accumulations up to 5 cm and wind north 20 km/h with a high of -6C.
No warnings/SWSs (special weather statements) were issued for November 11.
2100 UTC 10 Nov: Synoptic Conditions
In the GEM model forecast initialized at 12 UTC, the 12hr forecast shows an elongated surface trough situated along the southwest coast and stretching into the US Rockies. At 250 mb, the jet streak just off the British Columbia coast has a WNW-ESE orientation.
The IR satellite loop (10.7 µm) from 12-21 UTC November 10 shows increasing cloud coverage over southern British Columbia (British Columbia), Washington (WA), northern Idaho (ID) and western Montana (MT). Note the lee wave cloud signature over southern Alberta and Montana.
Question
In the GEM model, the jet streak... : (Choose the best answer.)
The correct answer is b)
By 12 UTC November 11, the GEM forecast is indicating eastward progression as the northwesterly jet streak moves over southwestern British Columbia and inland towards western Montana.
1530 UTC 11 Nov
1530 UTC 11 Nov: Nowcasting

The time is now 1530 UTC on November 11. Glancing at the model data, the 00hr analysis for 12 UTC November 11 indicates low-level warm advection is developing over eastern WA, northeastern OR and northern ID.
And here is the IR imagery from the past 15 hours and the most recent VIS image.
Question
Looking at the latest satellite imagery, what is evident in terms of the cloud evolution and cloud appearance over western Montana and southern Alberta? (Choose the best answer.)
The correct answer is c)
Significant forcing of upward motion, causing rapid cloud-top cooling and expansion of cold tops, appears to be progressing eastward all the way into eastern Montana, and appears particularly strong over southeastern Alberta, southwestern Saskatchewan, and central/southwestern Montana after 06 UTC.
Early in the period (02-09 UTC), note the presence of an intense mountain wave signature to the lee of the Rockies over Montana and Alberta, as mid-level westerly flow increases in advance of the disturbance moving in from the west-northwest. Lee wave cloudiness is relatively stationary, with cold tops, in correlation with the lee side front over western Montana and Alberta.
1530 UTC 11 Nov: Nowcasting (con't)
Currently there is a lee surface trough in southern Alberta with a 1000mb low southwest of Medicine Hat (YXH), consistent with climatological studies of clipper-type systems. This development is also consistent with the lee wave-type cloudiness evident in the IR imagery from 02-09 UTC November 11. The GEM model moves the low rapidly to the east and southeast over the next 18 hours.
Note the trends in the forecast discussions towards increasing precipitation coverage for later on November 11 in the northern portions of the GGW and BIS forecast areas.
0350 UTC Nov 11 - GGW (Glasgow MT)
...Updated for increased chance POPs central and increased to likely north for tomorrow pm. Strong short wave continues to dig southeast across the Pacific northwest into western Montana. Low level moisture has also increased dramatically during the past 12 hours...with this trend to continue into the morning hours.
Tomorrow (November 11)...have increased POPs during the morning as moisture and lift increasing rapidly by late morning. Surface low pressure area will move east across north and northeast Montana tomorrow afternoon into early tomorrow night. 850 mb temps will be below zero across much of the central and north by late afternoon...
...so expect a mix of precip tomorrow afternoon all but extreme south. Have indicated likely chance north and northeast due to the forecast track of the surface low and available moisture. Low will move rapidly east later Tues. night into Wed...taking the precipitation with it.
Highlights: High wind watch Tues. night Montana ZO21-23>25-27>60
Zone Forecast, from GGW, for northeastern corner of Montana (including Plentywood, Scobey), from 0344 UTC November 11: Veteran's Day (Tues.)...A chance of snow then snow likely in the afternoon. Snow accumulation 1 inch. Highs in the lower 30s. West winds 5 to 15 mph becoming northwest 15 to 25 mph in the afternoon. Chance of snow 60%.
Tuesday night.mostly cloudy with a 40% chance of snow showers then partly cloudy after midnight. Lows around 17. Northwest winds 15 to 25 mph with gusts to around 45 mph.
0815 UTC Nov 11 - GGW (Glasgow MT)
...A developing surface low pressure area over Alberta will move east and southeast across north and northeast Montana Tues. afternoon and night. 850 mb temps lingering near zero across the CWFA.so a mix of precipitation is forecast for today. Expected generally light amounts of precipitation today with northern portions in the likely category due to the expected track of the low...
...the low will exit east very rapidly early Wed. morning but with another shortwave on the back side of the upper trough to push southeast with some very cold air aloft over the central and east portions early Wed.
Thu...have lingering chance for snow showers central and east Wed. am.gusty winds expected to develop as low moves east across northeast Montana later today. However, stronger gradient and wind expected to occur overnight so will allow high wind watch to expire. Lake Wind Advisory will be issued for this afternoon and evening with wind expected to reach 25 mph with higher gusts by late today.
Highlights: Lake Wind Advisory for Fort Peck Reservoir this afternoon and evening.
0845 UTC Nov 11 - BIS (Bismarck, North Dakota )
SHORT RANGE: Main problem today is strength and path of clipper moving through northern portion of CWA. Models a bit closer in agreement today...but consistency and coordinating offices and HPC like the Eta for main forecast elements. Position and timing of Eta would bring a chance of rain or snow to the far west late this morning...and into central North Dakota this afternoon. Forecast sounding indicate that by 00 UTC precipitation would be all snow northern half...but still in the rain/snow temperature regime for southern counties until mid to late evening. Best chance of precipitation is along and north of the low. Could get up to an inch of snow in the northwest this afternoon. Thinking 1 to 3 inches possible north tonight. This combined with strong northwest winds will cause areas of blowing snow. Will issue winter weather advisory for northern half for tonight.
Highlights: Winter weather advisory tonight north (ISN/MOT/Bottineau/Garrison/Carrington)
1530 UTC 11 Nov: Mesoscale Thermodynamic Factors
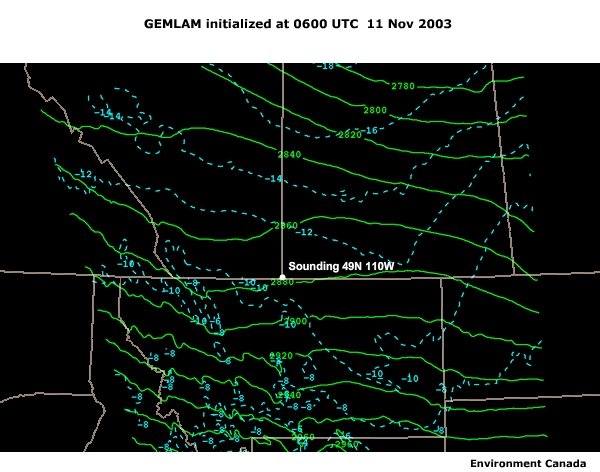
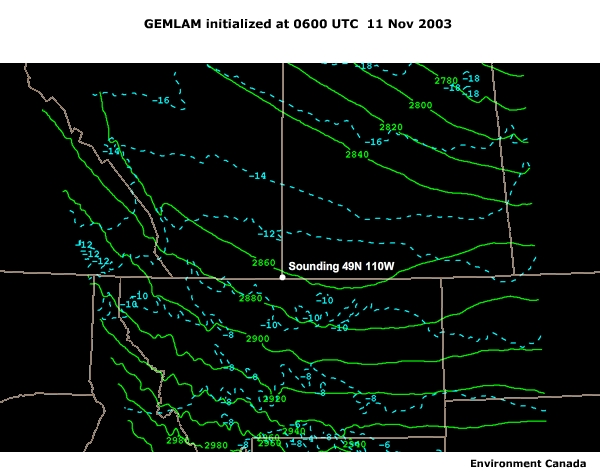
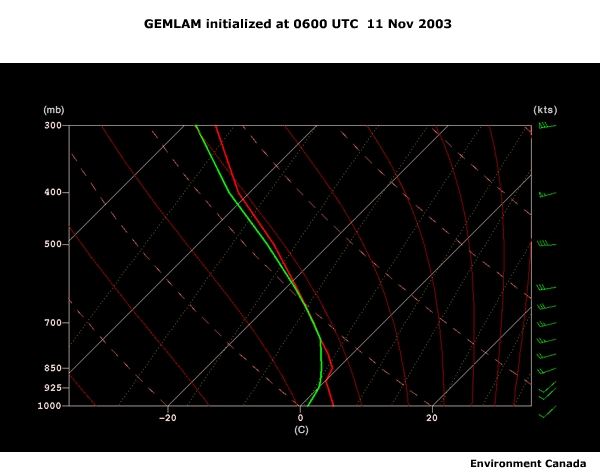
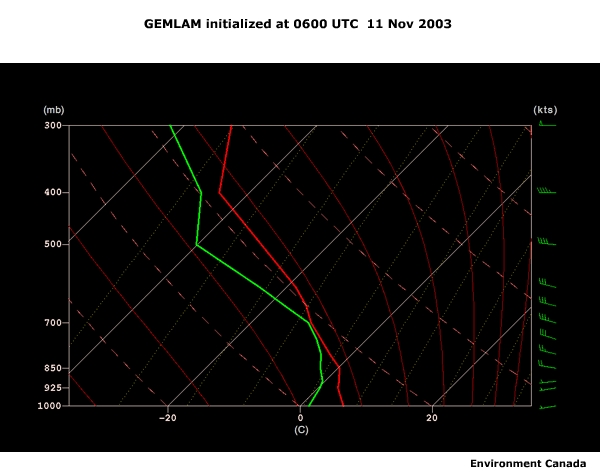
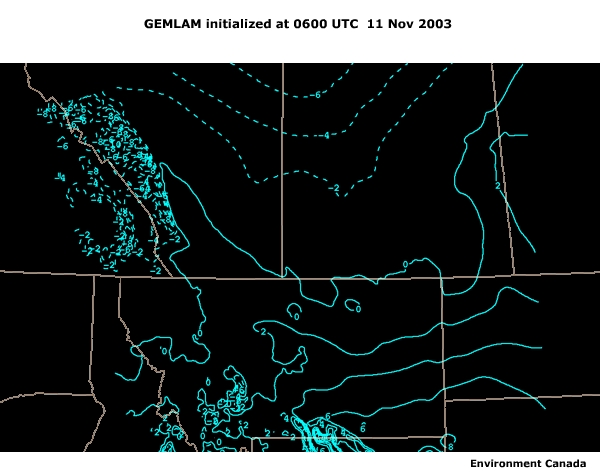
Let's take a closer look at the mesoscale thermodynamic factors at 1530 UTC. Take a look at the GEMLAM 2.5 km model data initialized at 06 UTC. Shown are the 700mb height and temperature fields for the 12 and 18 UTC time points and model soundings for a point near our area of interest (the border point where Alberta, Saskatchewan and Montana meet). Use the radio buttons to switch between the data products and the the two time points provided.
700mb heights (dam) and temps (C)
model sounding at 49° N 110 ° W
This is the most recent Glasgow forecast discussion.
1530 UTC 11 Nov - GGW (Glasgow, Montana):
Mixed bag of weather for the forecast area today. Strong shortwave and associated system still on track to trek on through the area today. Surface analysis show surface low centered just about over Havre. Models seem a tad too slow with movement so have adjusted POPs a bit to account for this. Put POPs up to categorical where heaviest snow seen on radar. Fast moving nature of system will help keep snow accumulations minimal in most areas.
Other problem today is precipitation type. Observations and reports indicating snow currently in most of the CWA...with rain in the southwest corner. May see a transition to rain/snow mix over the central part of the forecast area.remaining rain in the southwest.and staying all snow in the northeast. Northeast corner of forecast area still looks most favorable for advisory criteria accumulation and will issue an advisory for 2 to 4 inches. Models continue to paint copious amounts of qpf there.
Also...BUFKIT still showing deep (negative) omega through best snow growth layer. At the same time, strong 700 mb frontogenesis also taking place...which is favorable for heavy snow band. Lake wind advisory looks marginal today...but will let it ride for now and re-evaluate this afternoon.
Highlights: Lake wind advisory for Fort Peck (Reservoir) this afternoon and evening. Winter weather advisory for snow for Sheridan and Daniels Counties.
As a refresher, here are some references on the thermodynamics of snow production.
Thermodynamics of snow production
Snow amount predictions are greatly aided by monitoring and interpreting model vertical profiles of temperature, humidity, wind and vertical motion. Snowflake growth and aggregation are most rapid in the -12 to -16°C range, and isothermal profiles of some depth in the lower and middle troposphere favor rapid production of large snowflakes. These situations are especially favorable for the development of heavy snowfall. Of course, synoptically, deep surface-based layers of high RH, with forcing of upward motion, are background necessities for significant snow to develop in any temperature range.
For more information, see: From mm to cm.Study of snow/liquid water rations in Quebec by Ivan Dubé, 2003; available as a .pdf at: https://www.meted.ucar.edu/norlat/snowdensity/from_mm_to_cm.pdf
Effect of Temperature on Crystal Habits
The crystal habit, or shape, of a growing ice crystal is determined by the temperature and associated saturation vapor pressure difference between ice and supercooled water. The following graph and chart illustrate the habits that form at various temperatures at saturation with respect to liquid water.
|
Ice/Snow Crystal Habits at various temperatures at saturation with
respect to liquid water
|
||
|---|---|---|
| Initiation temperature (°C) | Crystal Habit | |
|
0 to -4
|
thin plate |  |
|
-3 to -6
|
needles | 
|
|
-6 to -10
|
hollow columns |
|
|
-10 to -12
|
solid plates sector plates broad-branch plates |
  |
|
-12 to -16
|
dendrites (as well as most plates) |
 |
|
-16 to -22
|
solid plates sector plates broad-branch plates |
|
|
-22 to -40
|
solid columns hollow columns bullet rosette |
   |
Ratio of Supercooled Cloud to Mixed Phase
Within clouds, at temperatures warmer than -10°C, supercooled liquid can be expected most often. Generally, with decreasing temperature, the likelihood of the cloud containing ice increases. At -20° C, fewer than 10% of the sampled clouds consisted entirely of supercooled liquid.
Optimal Temperatures and Conditions for Ice Crystal Initiation and Growth
Observation and laboratory experiments indicate that the optimal conditions for ice crystal initiation and growth are in cloud layers that are saturated with respect to liquid water, and thus supersaturated with respect to ice, with temperatures in the -10 to -18°C range.
|
Potential presence of ice crystal initiation in clouds based on
temperature
|
|
|---|---|
| Temperature (°C) | Potential presence of ice initiation |
| 0 | no initiation |
| -4 | no initiation |
| -10 | 60% chance of initiation and presence of ice |
| -12 | 70% chance of initiation and presence of ice |
| -15 | 90% chance of initiation and presence of ice |
| -20 | 100% chance of initiation and presence of ice |
For more information, see: Topics in Precipitation Type Forecasting (https://www.meted.ucar.edu/training_module.php?id=179)
Question
What does the model's thermodynamic profile for the region of interest indicate for temperatures in the vicinity of 700 mb, and is this favorable for heavy snow? (Choose the best answer.)
The correct answer is b)
The NWP indicates -10° to -14°C which is a favorable setting for heavy snow. Note the near-saturation of the layer encompassing the dendritic growth zone in the predicted thermal profile, at -12° to -16°C.
Also, the lapse rate is moist adiabatic in that layer at 12 UTC, and a bit more unstable at 18 UTC. The sounding indicates a very favorable situation for the development of large snowflakes in this layer, with large-scale uplift saturating the atmosphere at favorable temperatures, along with the potential for convection.
1530 UTC 11 Nov: A Look at Baroclinicity Aloft
Use the radio buttons to switch between the data products and the the two time points provided here.
850mb temps (C)
700 mb temps (C)
Question
Assess the horizontal temperature gradient in the 850-700 mb layer for southern Alberta and Saskatchewan. Which one of the following statements applies? (Choose the best answer.)
The correct answer is a)
At 700 mb, note that for 06 UTC the region of interest - northern Montana, southeastern Alberta and southwestern Saskatchewan - sits at the southern edge of a strong thermal gradient oriented mostly north-south. The area of strong gradient is moving southward in time and propagates over the region by 12 UTC. At 850 mb, the temperature gradient signature is similar, but there is a bit more of a northeast-southwest orientation.
Overall, the temperature gradients in the low- and mid-levels are such that baroclinic forcing of upward motion is likely over the area. This dynamic setup and favorable thermodynamics would be conducive to large-scale upward motion and precipitation. The ingredients for significant weather associated with the Alberta Clipper are falling into place.
1530 UTC 11 Nov: GEM MSLP and Precipitation Predictions
With the ingredients for an Alberta Clipper in place, it becomes important to forecast the anticipated track and snow totals accurately. Here are the updated GEM MSLP and 6-hr precipitation totals for the 12 UTC model run.
Question
Based on these GEM forecasts, what is the most likely path of the Clipper and what are you forecasting in regards to accumulations to the north of the low? (Choose the best answer.)
The correct answer is b)
The GEM takes the 1000-mb surface low to the Montana/North Dakota border by 00 UTC on November 12 then on through northeastern South Dakota and across central Minnesota. Very light precipitation amounts of 3mm or less are forecast over the area of interest in the first 6 hours. By 00 UTC November 12, a strip of 5mm accumulation is over the Montana/Saskatchewan border. As time progresses, amounts over 5 mm are indicated in a downstream region stretching from central North Dakota and northern Minnesota. Keep in mind that the model precipitation amount is liquid-equivalent, and the snow-to-liquid ratio for Alberta Clippers tends to be substantially higher than 10:1.
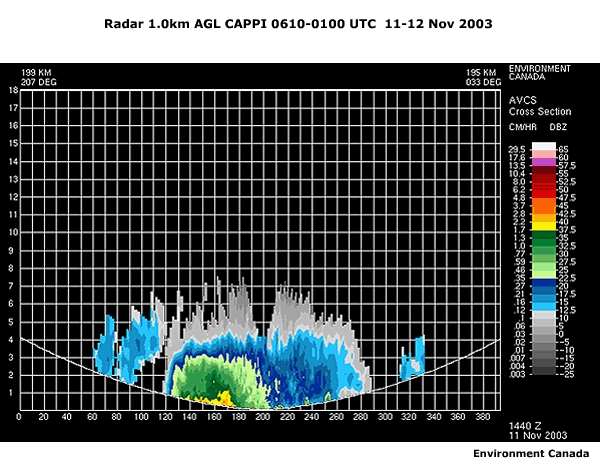
1530 UTC 11 Nov: Radar Observations
Here's the 1.0 km CAPPI Doppler composite reflectivity over southern Alberta and Saskatchewan for the past 9 hours. By 1000 UTC, significant reflectivity was developing just west of the Cypress Hills and by 1500 UTC over and just north of the hills. Stationary high reflectivity values over the lower center portion of the screen represent the Cypress Hills.
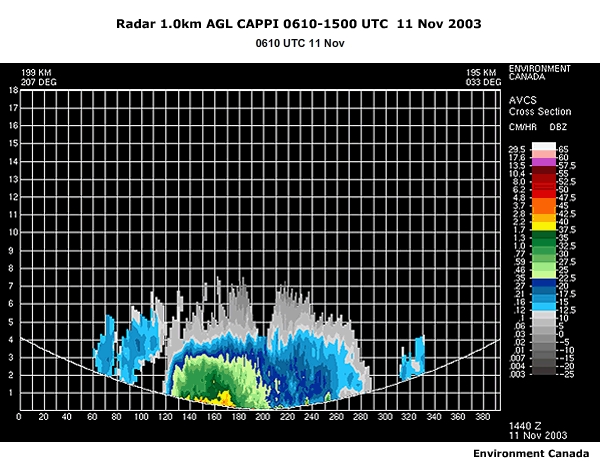
The precipitating region is oriented northwest-southeast and is propagating east-southeastward. Reflectivities of 30-35 dBZ are common, with some areas of 40 dBZ near the Cypress Hills by 1500 UTC. At the 1 km level, the radar-estimated snowfall rate reaches a maximum of 1 to 1.5 cm/hr at 1500 UTC. The radar estimates for ground accumulation are higher, with some local areas of 2-3 cm/hr.
The reflectivity cross section at 1440 UTC is oriented north northeast to south southwest and passes through the strong portion of the precipitating region at that time. Note the core of the maximum reflectivity near the ground at the center of the band, with reflectivity values of 35-40 dBZ.
As reference, here are the METARS for 15 UTC.
Question
Do you think the reflectivity values in the core of the band were contaminated by melting, and if not, what is causing the increased values in the lowest levels? The surface observations for 1500 UTC might help to make this determination. (Choose the best answer.)
The correct answer is a)
Surface observations at this time show surface temperatures below 0°C in this region, as well as light to moderate snowfall. Melting does not appear to be a factor in this region of Canada. Active microphysical growth processes appear to be causing rapid growth of snowflakes as they fall to the ground. As discussed previously, temperatures in the mid-levels were favorable for the development and rapid growth of dendritic crystals in this region. Also, with surface temperatures below freezing, a deep isothermal ground-based layer is likely, another favorable factor for rapid snowflake growth. Dendritic crystal habits are conducive to rapid aggregation in saturated layers of lift, and this in itself appears to be causing the low-level reflectivity maximum in the cross section.
Nowcasting Part 2
1530 UTC 11 Nov: Nowcasting Part 2
During the morning hours of November 11, as noted previously, the 1000 mb low was moving into north-central Montana. A surface trough extends back to extreme southern Alberta as the surface system begins to exhibit more organized frontal-type characteristics. This provides the potential for northeasterly flow over southeastern Alberta and SW Saskatchewan, which is an upslope flow due to the presence of the Cypress Hills.
Question
When did cyclogenesis occur in the GEM forecasts? (Choose the best answer.)
The correct answer is b)
Deepening of the central pressure is not required to have intensification of the pressure gradient. The model MSLP values to the north over southern Alberta and Saskatchewan increase by about 20 mb while the low's central pressure remaines nearly steady in the 24 hours after 12 UTC November 11. Thus the pressure gradient increases between the high and the low. If one considers only the central pressure, then cyclogenesis does not occur. However, the pressure gradient near the low certainly intensifies.
At a later time point, 1650 UTC, the local forecast office issued the following warning:
PASPC warning issued at 1650 UTC...
Wwcn13 cwwg 111650
Severe weather bulletin
Issued by
Environment Canada
At 10:50 am cst Tuesday November 11 2003
---------------------------------------------------------------------
Watches/warnings in effect for southern saskatchewan...
Heavy snowfall warning for:
=new=
assiniboia-gravelbourg-coronach
=new= leader-gull lake
=new=
shaunavon-maple creek-val marie-cypress hills.
10 to 15 centimetres of snow are expected in parts of southwestern saskatchewan today.
==Discussion==
A fast moving weather system has already given 10
centimetres of snow to Maple Creek, as well as Medicine Hat this
morning.
At 10:30 a.m. radar showed the heaviest snow from maple creek through Shaunavon, and generally west and south of Gull Lake. The city of Swift Current, as well as areas north and east of there should receive only a dusting of new snow.
The heaviest snow should end early this afternoon, however occasional snow will likely continue to affect visibility until some time this evening. Total amounts should be in the 10 to 15 centimetres range along a narrow band from Cypress Hills Park and Maple Creek through Coronach and Rockglen.
At this point, the heaviest snow is expected to remain southwest of Weyburn, possibly giving 5 centimetres to Estevan.
2300 UTC 11 Nov: Nowcasting

It's now 2300 UTC on November 11. Looking at the IR satellite imagery, note the continued development of cold tops and deep cloudiness into eastern Montana and the Dakotas. The colder cloud tops have a convective appearance. The system is propagating southeastward, and general cyclonic curvature is noted in the motion from western Montana into the Dakotas.
Looking at the 4km GOES-10 visible satellite over the northern US plains and southern Canada, again, note the prevailing northwesterly flow at cloud-top level for the cloud tops associated with rapidly developing convection over western Montana and southern Alberta. Meanwhile, clouds appearing to have significant depth and lift are persistent over southern Saskatchewan and into western North Dakota near the end of the loop.
The following forecast discussions and warnings have been issued in the past few hours:
Significant weather discussion for the Canadian Prairies issued by the Prairie Storm Prediction Centre of Environment Canada at 2:00 pm CST Tuesday November 11 2003 (1900 UTC).
Warnings or statements... Special Weather Statement issued for Medicine Hat region this morning. Heavy snowfall warning in effect for the Leader, Shaunavon, and Assiniboia regions.
Discussion... Alberta Clipper gave 13 cm of snow this morning to Medicine Hat. Radar suggests similar amounts may have fallen from just north of Brooks through Maple creek.
At 18z 1000 mb sfc low was just south of Eastend Saskatchewan tracking ESEwd. Narrow band of heavy snow stretches out in a WNW-ESE orientation from north of Medicine Hat thru Rockglen. Fast moving cold front area. Expect improvement thru SErn Alberta in the next few hours, and by late aftn thru SWrn Saskatchewan.
Other area of concern is Churchill where northwest winds of 50 gusting 70 km/h are possible on Wednesday. This may arise to streamers off the bay as well as blowing snow. Will consider warning of some type for the afternoon update.
Small craft warning has been pushed back to overnight when the colder low level air arrives.
2000 UTC Nov 11 - GGW (Glasgow MT)
Complicated weather system still making its way through the forecast area at this time. Surface low enter just about over Jordan. Snow still falling in northeastern corner of forecast area. Will leave up snow advisory there with models still painting high qpf amounts there. Already got report from Plentywood of 2 inches as of 1 pm (MST)...and still snowing. More convective type showers now beginning to show up on radar in the southern part of the forecast area where steeper lapse rates and instability sits. Scattered POPs will handle the situation fine. Will see rain showers...changing to snow later this evening. (Also) will... keep rather strong winds in through the nighttime hours...and will keep up lake wind advisory and word for southwest side of lake where stronger winds with higher gusts will occur. Winds have been more modest elsewhere.
Highlights: Lake wind advisory for Fort Peck (Reservoir) through this evening.
Winter weather advisory for snow for Sheridan and Daniels Counties through tonight.
2100 UTC Nov 11 - BIS (Bismarck, North Dakota)
SHORT RANGE: Main problem today is strength of winds south of and path of clipper moving through the northern portion of CWA as well as accumulation totals to the north. Low now in northeast Montana closest to 12 UTC Eta solution. Will continue ongoing advisory for 2 to 4 inches of snow. 12 UTC meso-Eta shows potential for more but ground truth reports indicate some melting occurring as snow falls over northwest CWA this afternoon. Winds south and west of low will crank up to or near advisory criteria. Will issue NPW for remaining zones not in WSW.
Winter weather advisory tonight north (ISN/MOT/Bottineau/Garrison/Carrington.
Wind advisory south tonight through Wednesday morning.
0200 UTC 12 Nov: Current Conditions

With those considerations in mind, let’s conclude the temporal evolution of the plains portion of the case. It’s now 0200 UTC on November 12.
The surface low was over western North Dakota by 00 UTC November 12 and moving rapidly eastward, consistent with the observed satellite data trend towards destabilization aloft, and rapid movement of convective-type cloud tops to the east and southeast.
Radar indicated general weakening of echoes during the 1800-2300 UTC period over southern Alberta and Saskatchewan.
This concludes the real-time forecasting issues with this case, which focused on the snowfall in southern Canadian Prairies and the northern US plains with this Alberta Clipper event.
Case Summary
Let's review the case and highlight the most important points in the forecast process.
In this case, on the synoptic scale, the models generally performed well in the 12- to 36- hour time frame ahead of the snowfall. However, some mesoscale aspects of Alberta Clippers presented particular challenges when trying to fine tune forecast details, such as the positioning of the surface and 850mb low pressure centers and the associated mesoscale forcing. These details were crucial as the MSC and NWS forecasters attempted to inform the public about the impacts of the narrow regions of snowfall and blowing snow in this storm.
The 6-hourly position track and intensity of the surface cyclone from 06 UTC November 11 through 18 UTC November 12 shows initial movement along the southern edge of typical tracks for Alberta Clippers. The track then trends toward the central portion of the climatological envelope later on.

Note that it was not the deepening of the central pressure but the intensification of the pressure gradient on the northern and western sides of the cyclone that was key to the strong winds as it tracked through the far northern plains of the US.
Snow Reports for the Region
An objective analysis of snowfall shows the largest amounts from southeastern Alberta into extreme southern Saskatchewan.
The snow began falling in southeastern Alberta about 12-13 UTC November 11, and by 1330 UTC, heavy snow was reported in the area. Local radars began to detect precipitation in the 11-12 UTC period. At 14 UTC, 5 cm accumulation was reported at Medicine Hat with visibilities less than 1 km. Strong easterly winds accompanied heavy, wet snowfall. Later on 11 November, much lower snowfall densities were reported over southern Saskatchewan. After 15 UTC, heavy snow moved into southeastern Saskatchewan, northeastern Montana, and northern and eastern North Dakota, primarily south of the Trans-Canada highway.
A Useful Forecast Tool
Compare the observed snowfall over Alberta and Saskatchewan with the location of the Eta-analysed 850mb lows through this event.
The heaviest band of snowfall appeared to have been just north of the track of the developing low at 850 mb, extending east-southeastward from just west of the British Columbia/Alberta border border at 12 UTC November 11 to western North Dakota by 00 UTC on Novemebr 12. This track was about 160 km north of the primary surface feature. Generally speaking, the frontogenetic forcing in the low- and mid-levels was likely a primary forcing mechanism for upward motion in this area during the 12 hours ending on 00 UTC on November 12.
Radar Snowfall Estimates
Canadian radar data indicated that the highest snowfall rates were along the Trans-Canada highway from Brooks to Medicine Hat, Alberta and into southwestern Saskatchewan from 12-18 UTC November 11. Ten to fifteen cm fell in portions of southeastern Alberta during that time.
The Strathmore radar indicated a strongly sheared wind profile behind the cyclone with low level north-northwesterly winds in excess of 25 kt, backing to westerly aloft. The Canadian radar 1.0 km CAPPI composite estimate of accumulated snow values for the 12 hour period ending at 00 UTC November 12 shows values of 5 to 7 cm over and just north of the Cypress Hills, considerably less than observed. This is due in part to the radar beam overshooting regions of rapid crystal growth and uncertainties in the radar snowfall accumulation algorithm. The 24hr accumulation ending at 06 UTC November 12 shows a secondary maximum of 5-7.5 cm over extreme south-central Saskatchewan.
A Closer Look at the GEM QPF
Let’s take a look at how the models performed. First, the GEM QPF and storm track prognoses will be briefly examined.
The GEM model run from 12 UTC November 10 forecast an initially weak disturbance moving across the area over the next 48 hours.
This was in general agreement with the observed cyclone track and intensity. The model forecast little to no precipitation for the area of interest prior to 18 UTC November 11. As shown, the only significant precipitation forecast at that time was well to the west, over western Montana and Alberta, and west of the Continental Divide.
SCRIBE, the Meteorlogical Service of Canada's real real-time automated system for model-based forecasts, indicated only trace amounts of precipitation for this period in the area of interest.
A Closer Look at the GEMLAM QPF
Now let’s take a retrospective look at the GEMLAM and the location of QPF.
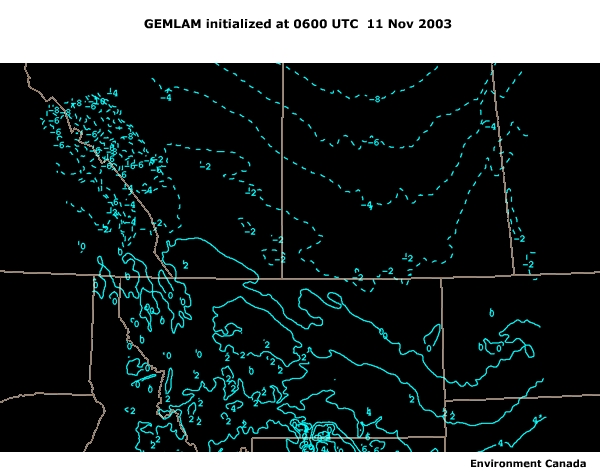
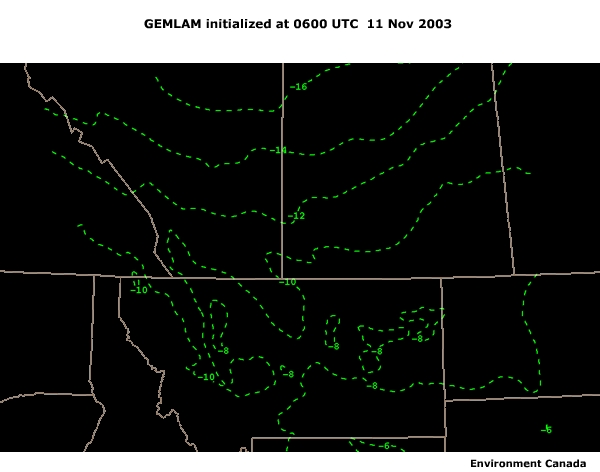
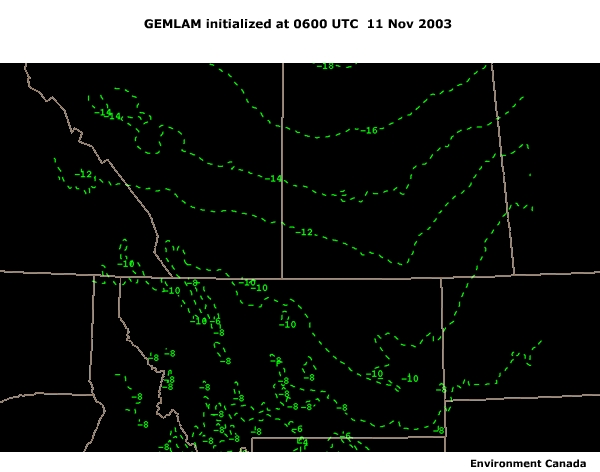
The GEMLAM initialized at 06 UTC November 11 predicted significant precipitation over the higher terrain, but lighter liquid amounts of 5-10 mm over extreme southern Alberta and Saskatchewan during the first 12 hours. The subsequent 12 hours yielded higher totals exceeding 15 mm by 06 UTC November 12, significantly greater than those forecast by the GEM.
Question
Given the model QPF information, what model processes could explain the higher local precipitation amounts in GEMLAM versus those in the GEM model? (Choose the best answer.)
The correct answer is d)
Several processes are plausible. Due to the improved model resolution of the GEMLAM, all of these are possible: improved local orographic lift due to Cypress Hills, better explicit model handling of convective processes (leading to locally higher snow amounts), optimum dendritic growth region, and tighter local pressure and precipitation gradients than the GEM model could resolve. Also, remember the potential of a higher snow-to-liquid ratio (greater than, say, 12 to 1) when generating forecasts in a situation like this.
Mesoscale Orographic Considerations
Let's take a closer look at potential orographic impacts. Consider the terrain map of the region.
Question
Assess the potential role of the Cypress Hills in southwestern Saskatchewan in enhancing snowfall. What impacts do the orographics of Cypress Hills have? (Choose the best answer.)
The correct answer is a)
The heaviest snowfall in southwestern Saskatchewan is on the northern and eastern sides of the Cypress Hills. The GEMLAM did not forecast northeasterly upslope flow at 850 or 925 mb, and the location of the heaviest snowfall was fortuitously on the northeastern side of the Cypress Hills.
However, the Eta-analyzed MSLP field at 18 UTC suggested the possibility of low-level northeasterly upslope flow.
Surface observations did indicate development of northeasterly winds by 18 UTC in the Cypress Hills region. The 850mb height forecasts in the GEMLAM showed a closed circulation/trough developing over southern Alberta and Saskatchewan between 12 and 18 UTC November 11. Note that a slight shift in forecast position would place favorable winds at that level in and upstream of the Cypress Hills.
In fact, the Eta analysis placed the 18 UTC 850mb low just east of the Hills, a favorable location for enhancement of upslope flow.
The Doppler radar data confirms the east-northeasterly flow in the low levels during this period. At 1730 UTC, the winds in the lowest levels were oriented at about 70 degrees just north of the Cypress Hills region. Significant reflectivities of 25-35 dBZ (not shown) associated with upslope were measured in an extended area from northwest to well east-southeast of the Hills along the Montana border.
Snowfall over Montana/North Dakota
Note that forecast surface temperatures for this event generally ranged from 0 to -5 °C, so the possibility of mixed or liquid precipitation should have been considered from a forecast viewpoint. Now take a look at that U.S. radar loop and the visible satellite imagery and answer the question below.
Question
Was there any indication of bright bands in the US radar data? You might also check the visible satellite imagery during this time for the presence of convection. (Choose the best answer.)
The correct answer is d)
First, recall the surface plots during the 1300-1800 UTC period. The surface observations are sparse, but do support the melting/bright banding scenario, with temperatures near 0°C. At 1500 UTC, a distinct NW-SE oriented surface thermal boundary is in place and persists for several hours over eastern Montana, generally coincident with significant radar echoes with some cores exceeding 35 dBZ. Warmer surface temperatures (well above 0°C) are in place southwest of the boundary, with subfreezing conditions to the northeast. Observations of freezing precipitation are common along the thermal boundary. Visible imagery does imply the presence of convection over the region, which further supports the melting and bright banding scenario.
Bright bands do appear to develop in some areas of Montana in the radar data (yellow cores above 35 dBZ). For the US radars, here is the radar data overview:
- 09-12z: A NW-SE oriented band develops just west of the Alberta/Saskatchewan/Montana intersection and grows to a few tens of km wide, extending into east-central Montana by 12z. There is general eastward propagation, although strongest cores (25 dBZ) remain for up to 30 minutes over a given location.
- 12-15z: The large band moves eastward in Montana, with stronger 35 dBZ localized cores due to bright banding. At this point, the primary band appears to redevelop as it moves eastward, coincident with the propagation of the 850 mb cyclone, and the band widens, covering most of eastern Montana by 15z.
- 15-18z: The band contines to move east, but some cyclonic rotation is evident such that movement rotates to east-northeast with bright band cores briefly reaching 40+ dBZ over the northeast corner of Montana by 18z. Extreme south-central Saskatchewan also has significant echo coverage late in the period.
- 18-21z: The wide band moves eastward into western North Dakota, with 30 dBZ cores, and continues widening while losing it's banded appearance.
Snowfall over Montana/North Dakota (cont'd)
Here are exerpts from nowcasts from the Glagow, Montana WFO for November 11-12.
13-14 UTC: ...only minor accumulations expected across general area. Visibilities as low as 1 mile at times. Rain showers mentioned for southern portion.
1538 UTC: For Circle, Glasgow, Jordan, Wolf Point
An area of heavier snow
located from near Saint Marie, extending south through Glasgow to near Circle, will
continue to move east this morning. Visibilities will be reduced to less than one
mile at times, with snow accumulation through noon, up to 1 or 2 inches, less for
most locations. The heavier snow will move in a line to near Larslan, Wolf Point and
Richey by 10:30 am, and to near Bredette, Poplar and Savage by noon. Additional
light snow showers can be expected through the remainder of the afternoon.
1538 UTC: For Plentywood, Scobey
...Winter weather advisory until 11pm this
evening...Snow will move into the area throughout the morning and afternoon hours.
Snow will be light at first, with snow accumulations through noon 1 inch or less.
Heavier snow can be expected to spread east in the later afternoon hours.
1823 UTC: For Circle, Culbertson, Glasgow, Glendive, Opheim, Sidney, Wolf Point
Areas of rain or rain mixed with snow will persist across the area through the
afternoon hours. Accumulation of rain or snow will be light.
1823 MST: For Plentywood, Scobey
...Winter Weather Advisory in effect until
11pm this evening...Areas of heavier snow will continue through the late afternoon
hours. Additional snowfall amounts through 3 pm will be up to 1 or 2 inches for most
locations.
2113 MST: updated to add mainly north of highway 5 and an inch or
less for most locations through 6 pm...
0230 UTC November 12 (GGW)
Update for higher POPs across central and east portions along with an increase in winds until midnight...shortwave trough with associated surface low pressure area continues to move rapidly east across eastern Montana and North Dakota tonight. Snow that is falling is generally light with additional accumulations up to 1 inch expected mostly east and southeast portion. Have adjusted wind velocity and gusts upward as good mixing continues this evening. Allowed for decreasing wind and precipitation trend from previous forecast to stand after midnight.
Highlights: Lake Wind Advisory for Fort Peck (Reservoir) through this evening. Winter Weather Advisory for snow and blowing snow for Sheridan and Daniels counties through 11pm (MST) tonight.
0830 UTC November 12 (BIS)
Main problem today is strength of winds behind clipper which has moved southeast of the state into southern Minnesota. Northwest winds are 20 to 30 mph with gusts to around 35 mph. These winds will remain through the morning...then begin to subside a bit in the west this afternoon. These speeds are below wind advisory criteria so will allow wind advisory to expire. 3-6" fell over much of the advisory area Tue (November 11)
Tue night-early this morning - think Eta did the best job in the last couple of days with this clipper regarding timing and areal position and extent of accumulating snow. Snowfall in the current winter weather advisory area in northern counties is on its way out...so will also allow it to expire. Light snow entering southeastern zones so will put light snow likely in the Jamestown area this morning...then flurries this afternoon. Some light precip on KGGW radar moving southeast...so will put morning flurries over rest of forecast area. New snow cover northern counties so will lower max temps today and Thursday...as well as min temps tonight.
Recall that the satellite imagery revealed widespread convection over Montana, and persistent, relatively deep cloudiness over southern Saskatchewan from 15-22z November 11. The imagery also showed the cyclonic rotation mentioned above in the radar animation for the single large snowband over Montana. Generally, convection would increase the likelihood of radar bright-band contamination data due to extension of microphysically-active processes upward, and an increased likelihood of larger snowflakes entering the warmer low levels on the southern side of the system.
The 1.0 km CAPPI radar data did not show any obvious significant bright bands or the presence of melting over southern Saskatchewan and Alberta. However, it is still possible that some of the local 35 dBZ+ reflectivity values could have been associated with melting even though surface observations did not show any liquid or frozen precipitation.
A Brief Look at Isentropic Model Data
For fast moving systems such as Alberta Clippers, system-relative assessment of upward motion can be important. To learn more about this concept, please the COMET module, Isentropic Analysis (https://www.meted.ucar.edu/training_module.php?id=94) by Dr. Jim Moore.
One useful model field to look at is pressure advection by the total wind along an isentropic surface.
Question
Look at the pressure advection plots, both ground- and system-relative, on the 300K isentropic surface in the AVN model. Is the approximation of the forcing of upward motion denoted by the red contours different in magnitude for the two model calculations over the area of interest?
The correct answer is YES
Ground-relative analysis shows only weak upward motion was forecast across the extreme southern Canadian and northern US plains during the period 06 UTC November 12 through 00 UTC November 13.
The system-relative plots show significant upward motion on the 300K surface beginning over extreme eastern ND at 06 UTC on November 12. The upward motion intensified as the system moved across northern MN into the extreme northwestern Great Lakes region over the next 18 hours. Significant snowfall was observed over the areas where relatively strong upward motion was indicated in the storm-relative plots after 06 UTC on November 12. Therefore, the system-relative isentropic pressure advection would appear to be a useful forecasting tool for diagnosing areas of signficiant upward motion and potential heavier snow fall during the latter stages of this event.
Conclusion
The Alberta Clipper system continued to strengthen after moving eastward into the northern Great Lakes region and on into Ontario. Very strong winds and snow occurred over southern Ontario early on November 13, after severe thunderstorms the previous day.
In closing
- A fast-moving Alberta Clipper system developed in southern Alberta, moved east-southeastward and was associated with significant snowfall and high winds over a relatively short duration and a narrow area, as is typical with these storms.
- A relatively narrow swath of snowfall amounts in the 5-15 cm range was observed from southern Alberta east-southeastward into Northern Minnesota during the early portion of this storm development. Since the positioning of this snowband was closely tied to the position of the 850mb low center, the forecast model track of the low was crucial to the 12-36 hour forecasts.
Forecasting challenges
- The forecast models tended to place the 850mb low center too far north, leading to problems with positioning of the regions of significant snowfall. Mixed-phase precipitation was important over MT in the storm.
- Snowfall associated with strong winds heightened the impact on the public, severely reducing visibilities even in light to moderate snowfall. Despite lack of intensification of the surface low, winds increased in association with a signficant intensification of the low-level pressure gradient on the back side of the system.
- Sytem-relative analysis of vertical motion did not appear to help the forecasting process early on, but proved a very useful tool once the storm became better defined later in the event.
References
Thomas, B.C and J. Martin, 2007: A synoptic climatology and composite analysis of the Alberta
Clipper.
Weather and Forecasting, 22, 315-333.
https://journals.ametsoc.org/view/journals/wefo/22/2/waf982_1.xml
Dube, R., 2003: From mm to cm…Study of snow/liquid water ratios in Quebec. At http://www.meted.ucar.edu/norlat/snowdensity/from_mm_to_cm.pdf
Moore, J.: Isentropic Analysis Webcast, COMET: https://www.meted.ucar.edu/training_module.php?id=94.
Contributors
COMET Sponsors
The COMET® Program is sponsored by NOAA National Weather Service (NWS), with additional funding by:
- Air Force Weather (AFW)
- European Organisation for the Exploitation of Meteorological Satellites (EUMETSAT)
- Meteorological Service of Canada (MSC)
- National Environmental Education Foundation (NEEF)
- National Polar-orbiting Operational Environmental Satellite System (NPOESS)
- NOAA National Environmental Satellite, Data and Information Service (NESDIS)
- Naval Meteorology and Oceanography Command (NMOC)
Project Contributors
Senior Project Manager
- Dr. Greg Byrd — UCAR/COMET
Project Lead
- Dr. Douglas Wesley — UCAR/COMET
Principal Science Advisors
- James Cummine — MSC/Environment Canada
- Phil Shumacher — NWS/NOAA
- Viggo Jensen — NWS/NOAA
- Bill Martin — NWS/NOAA
Instructional Design
- Bruce Muller — UCAR/COMET
Data and Media Development
- Bruce Muller — UCAR/COMET
Interface Design
- Brannan McGill — UCAR/COMET
COMET HTML Integration Team 2021
- Tim Alberta — Project Manager
- Ariana Kiessling — Web Developer
- Dolores Kiessling — Project Lead
- Steve Deyo — Graphic Artist
- Gary Pacheco — Lead Web Developer
- David Russi — Translations
- Tyler Winstead — Web Developer
COMET Staff, December 2009
Director
- Dr. Timothy Spangler
Deputy Director
- Dr. Joe Lamos
Administration
- Elizabeth Lessard, Administration and Business Manager
- Lorrie Alberta
- Michelle Harrison
- Hildy Kane
- Ellen Martinez
Hardware/Software Support and Programming
- Tim Alberta, Group Manager
- Bob Bubon
- James Hamm
- Ken Kim
- Mark Mulholland
- Wade Pentz, Student
- Malte Winkler
Instructional Designers
- Dr. Patrick Parrish, Senior Project Manager
- Dr. Alan Bol
- Maria Frostic
- Lon Goldstein
- Bryan Guarente
- Dr. Vickie Johnson
- Tsvetomir Ross-Lazarov
- Marianne Weingroff
Media Production Group
- Bruce Muller, Group Manager
- Steve Deyo
- Seth Lamos
- Brannan McGill
- Dan Riter
- Carl Whitehurst
Meteorologists/Scientists
- Dr. Greg Byrd, Senior Project Manager
- Wendy Schreiber-Abshire, Senior Project Manager
- Dr. William Bua
- Patrick Dills
- Dr. Stephen Jascourt
- Matthew Kelsch
- Dolores Kiessling
- Dr. Arlene Laing
- Dave Linder
- Dr. Elizabeth Mulvihill Page
- Amy Stevermer
- Warren Rodie
Science Writer
- Jennifer Frazer
Spanish Translations
- David Russi
NOAA/National Weather Service - Forecast Decision Training Branch
- Anthony Mostek, Branch Chief
- Dr. Richard Koehler, Hydrology Training Lead
- Brian Motta, IFPS Training
- Dr. Robert Rozumalski, SOO Science and Training Resource (SOO/STRC) Coordinator
- Ross Van Til, Meteorologist
- Shannon White, AWIPS Training
Meteorological Service of Canada Visiting Meteorologists
- Phil Chadwick