Produced by The COMET® Program
Learn about all the Latest Core components and their respective use.
The Case
Hurricane Michael was a baroclinically initiated hurricane which formed north of the Bahamas in mid-October, 2000. An upper-level low drifted southeastward from the eastern United States and eventually stalled above an old surface frontal zone. The vorticity associated with the upper low eventually made its presence felt at the surface owing to the statically unstable atmosphere. A "subtropical" low formed, with a broad area of gale force winds well displaced from its core. With time, the circulation contracted and convection became better organized over the center. By October 17, the subtropical depression attained status of hurricane Michael.
Analyze the data associated with Michael's progression from the eyes of a Canadian forecaster in the Maritimes region of the Canadian east coast. What aspects of the data would most influence your forecast decisions? How much trust do you place in the NHC forecasts? If you are going to issue a warning, at what point should you do so? What weather elements do you forecast, for what locations, and when? Review the information provided for this case then respond to a series of questions regarding Michael's movement and potential interaction with a nearby mid-latitude trough.
The Set Up
The following information provides insight on the evolution of the sub-tropical depression leading to Hurricane Michael.
Evolution of the subtropical depression as it intensified to become Hurricane Michael
    Date: 15-17 OCT 2000
    Hurricane MICHAEL


    ADV  LAT   LON       TIME     WIND  PR  STAT
      1  30.00  -71.20 10/15/12Z   30  1007 SUBTROPICAL DEPRESSION
      2  30.00  -71.50 10/15/18Z   30  1006 SUBTROPICAL DEPRESSION
      3  29.90  -71.80 10/16/00Z   35  1005 TROPICAL STORM
      4  29.90  -71.90 10/16/06Z   35  1005 TROPICAL STORM
      5  29.70  -71.70 10/16/12Z   35  1005 TROPICAL STORM
      6  29.80  -71.40 10/16/18Z   35  1004 TROPICAL STORM
      7  29.90  -71.10 10/17/00Z   35  1003 TROPICAL STORM
      8  29.80  -71.00 10/17/06Z   45  1000 TROPICAL STORM
      9  29.80  -70.90 10/17/12Z   55   995 TROPICAL STORM
     10  30.10  -70.90 10/17/18Z   65   988 HURRICANE-1
(source: http://weather.unisys.com/hurricane/atlantic/2000/MICHAEL/track.dat)
Tropical Storm Advisory and Strike Probabilities
Prior to the upgrading of Michael to hurricane status, the National Weather Service in Miami was already keeping a close eye on the storm.
** WTNT32 KNHC 171431 ***
TCPAT2
BULLETIN
TROPICAL STORM MICHAEL ADVISORY NUMBER 3
NATIONAL WEATHER SERVICE MIAMI FL
11 AM EDT TUE OCT 17 2000


...MICHAEL STRENGTHENING...


INTERESTS IN BERMUDA SHOULD MONITOR THE PROGRESS OF MICHAEL.


AT 11 AM EDT...1500Z...THE CENTER OF TROPICAL STORM MICHAEL
WAS LOCATED NEAR LATITUDE 29.8 NORTH...LONGITUDE 71.0 WEST
OR ABOUT 405 MILES...650 KM...WEST-SOUTHWEST OF BERMUDA.


MICHAEL HAS BEEN MEANDERING BUT IS NEARLY STATIONARY. A SLOW NORTH-
NORTHEASTWARD MOTION IS EXPECTED TO BEGIN DURING THE NEXT 24 HOURS.


MAXIMUM SUSTAINED WINDS ARE NEAR 50 MPH... 85 KM/HR...WITH HIGHER
GUSTS. FURTHER STRENGTHENING IS FORECAST DURING THE NEXT 24 HOURS.
AN AIR FORCE HURRICANE HUNTER PLANE WILL INVESTIGATE THE STORM LATER
TODAY.


TROPICAL STORM FORCE WINDS EXTEND OUTWARD UP TO 45 MILES
... 75 KM FROM THE CENTER.


ESTIMATED MINIMUM CENTRAL PRESSURE IS 1000 MB...29.53 INCHES.


REPEATING THE 11 AM EDT POSITION...29.8 N... 71.0 W. MOVEMENT
NEARLY STATIONARY. MAXIMUM SUSTAINED WINDS... 50 MPH. MINIMUM
CENTRAL PRESSURE...1000 MB.


FOR STORM INFORMATION SPECIFIC TO YOUR AREA...PLEASE MONITOR
PRODUCTS ISSUED BY YOUR LOCAL WEATHER OFFICE.


THE NEXT ADVISORY WILL BE ISSUED BY THE NATIONAL HURRICANE CENTER AT
5 PM EDT.


FORECASTER PASCH
(source: http://www.nhc.noaa.gov/archive/2000/prb/LAL1700.003.html)
ZCZC MIASPFAT2 ALL
TTAA00 KNHC DDHHMM
TROPICAL STORM MICHAEL PROBABILITIES NUMBER   3
NATIONAL WEATHER SERVICE MIAMI FL
11 AM EDT TUE OCT 17 2000


PROBABILITIES FOR GUIDANCE IN HURRICANE PROTECTION
PLANNING BY GOVERNMENT AND DISASTER OFFICIALS


AT 11 AM EDT...1500Z...THE CENTER OF MICHAEL WAS LOCATED NEAR
LATITUDE 29.8 NORTH...LONGITUDE  71.0 WEST


CHANCES OF CENTER OF THE STORM PASSING WITHIN 65 NAUTICAL MILES
OF LISTED LOCATIONS THROUGH  8AM EDT FRI OCT 20 2000


LOCATION           A  B  C  D  E   LOCATION           A  B  C  D  E


32.0N  70.0W      41  X  X  1 42   BOSTON MA          X  X  3  6  9
34.0N  69.0W      14  7  2  X 23   PORTLAND ME        X  X  2  7  9
38.0N  66.0W       X  4 11  2 17   BAR HARBOR ME      X  X  2  8 10
BERMUDA            X  3  5  2 10   EASTPORT ME        X  X  2  8 10
WILMINGTON NC      X  X  1  1  2   ST JOHN NB         X  X  2  9 11
MOREHEAD CITY NC   X  1  1  1  3   MONCTON NB         X  X  1  9 10
CAPE HATTERAS NC   X  1  4  1  6   YARMOUTH NS        X  X  3  9 12
NORFOLK VA         X  X  2  2  4   HALIFAX NS         X  X  2 10 12
OCEAN CITY MD      X  X  3  2  5   SABLE ISLAND NS    X  X  1  9 10
ATLANTIC CITY NJ   X  X  2  4  6   SYDNEY NS          X  X  X 10 10
NEW YORK CITY NY   X  X  2  4  6   EDDY POINT NS      X  X  1 10 11
MONTAUK POINT NY   X  X  4  5  9   PTX BASQUES NFLD   X  X  X  9  9
PROVIDENCE RI      X  X  4  5  9   BURGEO NFLD        X  X  X  8  8
NANTUCKET MA       X  X  6  5 11   ILE ST PIERRE      X  X  X  7  7
HYANNIS MA         X  X  5  5 10   CAPE RACE NFLD     X  X  X  4  4


COLUMN DEFINITION   PROBABILITIES IN PERCENT
A IS PROBABILITY FROM NOW TO  8AM WED
FOLLOWING ARE ADDITIONAL PROBABILITIES
B FROM  8AM WED TO  8PM WED
C FROM  8PM WED TO  8AM THU
D FROM  8AM THU TO  8AM FRI
E IS TOTAL PROBABILITY FROM NOW TO  8AM FRI
X MEANS LESS THAN ONE PERCENT


FORECASTER PASCH
(source: http://www.nhc.noaa.gov/archive/2000/prb/LAL1700.003.html)
Data
The following data becomes available on 12Z on 18 OCT. Compare the position of vorticity maximum at model initialization with the water vapor image for the same time. Follow the vorticity maximum in the model and compare it to the strike probabilities.
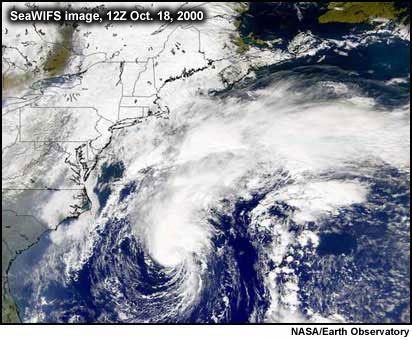
GOES-8 Water Vapor image at 12Z 17-18 OCT
GEM Model Run
Updated Strike Probability
ZCZC MIASPFAT2 ALL
TTAA00 KNHC DDHHMM
HURRICANE MICHAEL PROBABILITIES NUMBER   6
NATIONAL WEATHER SERVICE MIAMI FL
5 AM EDT WED OCT 18 2000


PROBABILITIES FOR GUIDANCE IN HURRICANE PROTECTION
PLANNING BY GOVERNMENT AND DISASTER OFFICIALS


AT 5 AM EDT...0900Z...THE CENTER OF MICHAEL WAS LOCATED NEAR
LATITUDE 31.1 NORTH...LONGITUDE  70.8 WEST


CHANCES OF CENTER OF THE HURRICANE PASSING WITHIN 65 NAUTICAL MILES
OF LISTED LOCATIONS THROUGH  2AM EDT SAT OCT 21 2000


LOCATION           A  B  C  D  E   LOCATION           A  B  C  D  E


34.7N  68.5W      41  4  X  X 45   EASTPORT ME        X  X  6  X  6
38.7N  64.5W       X 17  6  X 23   ST JOHN NB         X  X  7  X  7
44.0N  58.5W       X  X 10  X 10   MONCTON NB         X  X  7  X  7
BERMUDA            X  2  X  X  2   YARMOUTH NS        X  1 10  X 11
MONTAUK POINT NY   X  2  1  X  3   HALIFAX NS         X  X 11  X 11
PROVIDENCE RI      X  2  1  X  3   SABLE ISLAND NS    X  X 12  X 12
NANTUCKET MA       X  4  3  X  7   SYDNEY NS          X  X  7  X  7
HYANNIS MA         X  3  3  X  6   EDDY POINT NS      X  X  9  X  9
BOSTON MA          X  1  2  X  3   PTX BASQUES NFLD   X  X  4  X  4
PORTLAND ME        X  1  2  X  3   BURGEO NFLD        X  X  3  X  3
BAR HARBOR ME      X  X  5  X  5   ILE ST PIERRE      X  X  3  X  3


COLUMN DEFINITION   PROBABILITIES IN PERCENT
A IS PROBABILITY FROM NOW TO  2AM THU
FOLLOWING ARE ADDITIONAL PROBABILITIES
B FROM  2AM THU TO  2PM THU
C FROM  2PM THU TO  2AM FRI
D FROM  2AM FRI TO  2AM SAT
E IS TOTAL PROBABILITY FROM NOW TO  2AM SAT
X MEANS LESS THAN ONE PERCENT


FORECASTER BEVEN
(source: http://www.nhc.noaa.gov/archive/2000/prb/LAL1700.006.html)
Guidelines
Guidelines for Forecasting the Interaction of a Tropical System with a Baroclinic Trough
These guidelines have been developed from the study of several trough/tropical system interactions off the east coast of North America.
- Diagnose any baroclinic troughs that could potentially interact with the tropical system. Note their characteristics: speed; direction of movement; diffluent/confluent; tilt.
- Estimate when the 500mb vorticity maximum associated with the tropical system first encounters the strengthening 500mb flow east of the approaching baroclinic trough.
- The beginning of the extratropical transition process (ET) can be considered the approximate time the tropical system becomes absorbed into the 500mb stream.
- The speed of the transitioning storm can be estimated by taking 3/4 of the geostrophic wind at 500 mb early in transition to 1/2 late in the transition process.
- Deepening of the transitioning system is likely to begin when the approaching baroclinic trough axis moves to within 5° latitude of that system.
- The direction of motion of the transitioning system is approximately the same direction as the 500mb wind before deepening and approximately 25° cross-contour towards lower heights during the deepening period.
Questions
Question 1
Consider the mid-latitude trough approaching Hurricane Michael at 12Z 18 OCT.
Question 1a
Does this trough appear to be diffluent or confluent?
Question 1b
Is the "tilt' of the trough favorable for development?
Question 1c
Does this situation appear to be favorable for extratropical transition?
Question 2
Question 2
At what time does it appear that Michael has become absorbed into the 500mb flow?
Question 3
Forecast Guidelines
Guidelines for Forecasting the Interaction of a Tropical System with a Baroclinic Trough
- Diagnose any baroclinic troughs that could potentially interact with the tropical system. Note their characteristics: speed; direction of movement; diffluent/confluent; tilt.
- Estimate when the 500mb vorticity maximum associated with the tropical system first encounters the strengthening 500mb flow east of the approaching baroclinic trough.
- The beginning of the extratropical transition process (ET) can be considered the approximate time the tropical system becomes absorbed into the 500mb stream.
- The speed of the transitioning storm can be estimated by taking 3/4 of the geostrophic wind at 500 mb early in transition to 1/2 late in the transition process.
- Deepening of the transitioning system is likely to begin when the baroclinic trough axis moves to within 5° latitude of that system.
- The direction of motion of the transitioning system is approximately the same direction as the 500mb wind before deepening and approximately 25° cross-contour towards lower heights during the deepening period.
Rules of Thumb
Rules of Thumb: Estimating 500mb wind from height charts
- Measure separation between two height contours 6 dam apart (y°).
- Use the following formula:
x ÷ y° = estimated 500mb wind (knots)
x = factor based on latitude
y° = separation between two height contours 6 dam apart:
| latitude at measurement (°) | factor (x) |
|---|---|
| 30 | 140 |
| 35 | 125 |
| 40 | 110 |
| 45 | 100 |
| 50 | 90 |
Question 3
Using the 500mb vorticity maximum as a central fix for Michael at 00Z 19 OCT, use the forecast guidelines and the rules of thumb for estimating the 500mb wind from height charts to estimate where Michael will be at 12Z 19 OCT. Click the appropriate longitude/latitude position to check your answer.
Question 4
Question 2
At what time does it appear that Michael is within 5° of the trough axis?
Question 5
Question 5
Is this pattern consistent with ET re-intensification?
Question 6
Forecast Guidelines
Guidelines for Forecasting the Interaction of a Tropical System with a Baroclinic Trough
- Diagnose any baroclinic troughs that could potentially interact with the tropical system. Note their characteristics: speed; direction of movement; diffluent/confluent; tilt.
- Estimate when the 500mb vorticity maximum associated with the tropical system first encounters the strengthening 500mb flow east of the approaching baroclinic trough.
- The beginning of the extratropical transition process (ET) can be considered the approximate time the tropical system becomes absorbed into the 500mb stream.
- The speed of the transitioning storm can be estimated by taking 3/4 of the geostrophic wind at 500 mb early in transition to 1/2 late in the transition process.
- Deepening of the transitioning system is likely to begin when the baroclinic trough axis moves to within 5° latitude of that system.
- The direction of motion of the transitioning system is approximately the same direction as the 500mb wind before deepening and approximately 25° cross-contour towards lower heights during the deepening period.
Rules of Thumb
Rules of Thumb: Estimating 500mb wind from height charts
- Measure separation between two height contours 6 dam apart (y°).
- Use the following formula:
x ÷ y° = estimated 500mb wind (knots)
x = factor based on latitude
y° = separation between two height contours 6 dam apart:
| latitude at measurement (°) | factor (x) |
|---|---|
| 30 | 140 |
| 35 | 125 |
| 40 | 110 |
| 45 | 100 |
| 50 | 90 |
Question 6
Do you anticipate Michael making landfall within this time period?
Question 7
Question 7a
How has the 500mb gradient over the storm changed between 12Z 19 OCT and 00Z 20 OCT?
Question 7b
How might this change affect your forecast position?
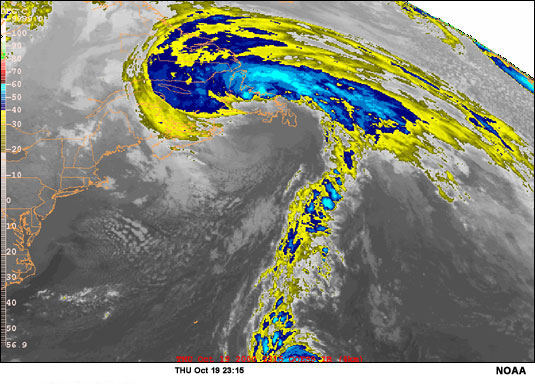
Given that the 500mb gradient has strengthened, you would expect the storm's position to be further north than the rules of thumb would suggest. The storm system had moved well inland by 00Z 20 OCT. It has completed the transiton process to an extratropical system. Note the well defined frontal system and comma cloud pattern evident on the 2315Z 19 OCT Satellite image below.
Summary
At 12Z 18 OCT, Hurricane Michael was situated to the southeast of a diffluent trough over the Great Lakes. By 00Z 19 OCT, Michael encountered the 500mb flow within the trough and began accelerating to the northeast, thus beginning the extratropical transition process. By 12Z 19 OCT, Michael was within 5 degrees latitude of the diffluent trough, moving northeastward near 40 knots and beginning to deepen, consistent with the potential for development diagnoses used for winter storms. Significant deepening occurred during the afternoon of 19 OCT, while Michael continued transitioning into an extratropical storm. The center of this storm made landfall on the south coast of Newfoundland near 2230Z 19 OCT, still undergoing extratropical transition. Michael had both tropical and extratropical characteristics when it made landfall but was categorized as a hurricane by the Canadian Hurricane Center based on surface and radar data, but classified as extratropical by the Hurricane Center in Miami; this illustrates the current lack of understanding of the transition process and the lack of consistent guidelines in classifying these storms. The storm tracking map and data appear below along with an infrared satellite image prior to landfall.
Supporting Data
The Track of Hurricane Michael
This hurricane track chart makes apparent the rapid acceleration that took place after Hurricane Michael entered the 500mb flow late on the 18th, moving more than 15 degrees in 24 hours after being nearly stalled in the days leading up to that time.
    Date: 15-20 OCT 2000
    Hurricane MICHAEL
    ADV  LAT   LON       TIME     WIND  PR  STAT
      1  30.00  -71.20 10/15/12Z   30  1007 SUBTROPICAL DEPRESSION
      2  30.00  -71.50 10/15/18Z   30  1006 SUBTROPICAL DEPRESSION
      3  29.90  -71.80 10/16/00Z   35  1005 TROPICAL STORM
      4  29.90  -71.90 10/16/06Z   35  1005 TROPICAL STORM
      5  29.70  -71.70 10/16/12Z   35  1005 TROPICAL STORM
      6  29.80  -71.40 10/16/18Z   35  1004 TROPICAL STORM
      7  29.90  -71.10 10/17/00Z   35  1003 TROPICAL STORM
      8  29.80  -71.00 10/17/06Z   45  1000 TROPICAL STORM
      9  29.80  -70.90 10/17/12Z   55   995 TROPICAL STORM
     10  30.10  -70.90 10/17/18Z   65   988 HURRICANE-1
     11  30.40  -70.90 10/18/00Z   65   988 HURRICANE-1
     12  30.80  -70.80 10/18/06Z   65   986 HURRICANE-1
     13  31.50  -70.40 10/18/12Z   65   984 HURRICANE-1
     14  32.60  -69.50 10/18/18Z   70   979 HURRICANE-1
     15  34.20  -67.80 10/19/00Z   75   983 HURRICANE-1
     16  36.30  -65.50 10/19/06Z   65   986 HURRICANE-1
     17  39.80  -61.60 10/19/12Z   75   979 HURRICANE-1
     18  44.00  -58.50 10/19/18Z   85   965 HURRICANE-2
     19  48.00  -56.50 10/20/00Z   75   966 EXTRATROPICAL STORM-1
     20  50.00  -56.00 10/20/06Z   70   966 EXTRATROPICAL STORM-1
     21  51.00  -53.50 10/20/12Z   65   968 EXTRATROPICAL STORM-1
     22  52.00  -50.50 10/20/18Z   60   970 EXTRATROPICAL STORM
(source: http://weather.unisys.com/hurricane/atlantic/2000/MICHAEL/track.dat)
Summary (continued)
Shifting Wind Pattern
Note in the four plots below how the wind pattern evolves as Hurricane Michael experiences extratropical transition. Early on the 17th, the wind pattern is very symmetrical, relatively small, and the maximum winds surround the hurricane eyewall. By the 18th, The wind pattern has already become slightly asymmetrical and is widening. On the 19th, the winds have extended even more broadly, and the maximum winds are now shifted to the right or east of the hurricane's path. As the storm makes landfall on the 20th, the pattern is at its broadest and is highly asymmetrical, with little of the high winds extending left of the moving storm system.
Water Vapor images at 1215Z from 17-20 Oct
The compact, nearly-symmetrical hurricane initially east of Florida accelerates northeastward and its associated cloud band, represented by the lighter tones, expands and becomes highly asymmetrical during this period. The end result is a system that looks more like a large, mature mid-latitude low, including darker areas of drier, subsident air behind the cold front and curling into the low. This sequence represents the extratropical transition process of Michael.
GOES-8 IR image at 1915Z, 19 Oct
The IR image indicates that the areas of heaviest clouds and rain are shifting to the left side of the extratropical storm's path.
More Details
A detailed synoptic history of Michael is available on the National Centers for Environmental
Prediction Web site:
https://www.nhc.noaa.gov/data/tcr/AL142018_Michael.pdf
A technical note, Summary Report and Storm Impact on Canada, by the author of
this case exercise is available as a PDF file at:
http://www.novaweather.net/Hurricane_Michael_files/Michael_MSC.pdf
Contributors
COMET Sponsors
- Meteorological Service of Canada (MSC)
- National Weather Service (NWS)
- National Oceanic and Atmospheric Administration (NOAA)
Principal Investigator
- Chris Fogarty– MSC
Science Advisors
- Jim Abraham– MSC
- Peter Bowyer– MSC
- Steve Miller– MSC
Project Lead/Instructional Design
- Bruce Muller– UCAR/COMET
Project Meteorologist
- Peter Lewis– MSC
Multimedia Authoring/Additional Instructional Design
- Bruce Muller– UCAR/COMET
Computer Graphics/Animation
- Steve Deyo – UCAR/COMET
Software Testing/Quality Assurance
- Michael Smith – UCAR/COMET
Copyright Administration
- Lorrie Fyffe – UCAR/COMET
Data Provided by
- MSC
- NWS – NOAA
COMET HTML Integration Team 2020
- Tim Alberta — Project Manager
- Dolores Kiessling — Project Lead
- Steve Deyo — Graphic Artist
- Gary Pacheco — Lead Web Developer
- Justin Richling — Web Developer
- David Russi — Translations
- Gretchen Throop Williams — Web Developer
- Tyler Winstead — Web Developer
COMET Staff, Summer 2002
Director
- Dr. Timothy Spangler
Assistant Director
- Dr. Joe Lamos
Meteorologist Resources Group Head
- Dr. Greg Byrd
Business Manager/Supervisor of Administration
- Elizabeth Lessard
Administration
- Alfreda Darden
- Lorrie Fyffe
- Bonnie Slagel
Graphics/Media Production
- Steve Deyo
- Heidi Godsil
- Seth Lamos
- Kay Levesque
Hardware/Software Support and Programming
- Steve Drake (Supervisor)
- Tim Alberta
- Dennis Ward
- Carl Whitehurst
Instructional Design
- Dr. Patrick Parrish (Supervisor)
- Dr. Alan Bol
- Dr. Vickie Johnson
- Bruce Muller
- Dr. Sherwood Wang
Meteorologists
- Dr. William Bua
- Patrick Dills
- Doug Drogurub (Student)
- Kevin Fuell
- Jonathan Heyl (Student)
- Dr. Stephen Jascourt
- Matthew Kelsch
- Dolores Kiessling
- Wendy Schreiber-Abshire
- Dr. Doug Wesley
Software Testing/Quality Assurance
- Michael Smith (Coordinator)
Systems Administration
- Karl Hanzel
- James Hamm
- Max Parris (Student)
National Weather Service COMET Branch
- Richard Cianflone
- Anthony Mostek (National Satellite Training Coordinator)
- Elizabeth Mulvihill Page
- Dr. Robert Rozumalski (SOO/SAC Coordinator)
Meteorological Service of Canada Visiting Meteorologists
- Peter Lewis
- Garry Toth