Media elements used in this module are protected by a variety of copyright licenses. Please use the "copyright terms" link associated with each item below for more information.
Description:
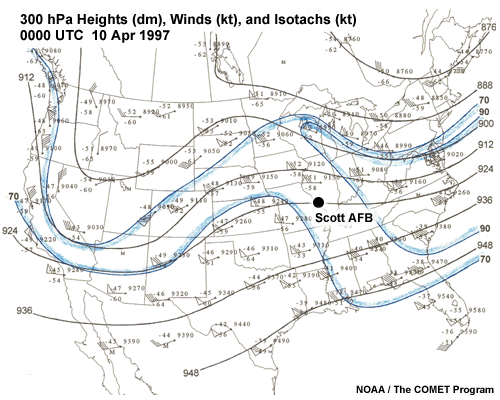
300 hPa Heights (dm), Winds (kt), and Isotachs (kt) Over the Coterminous U.S. 0000 UTC 10 Apr 1997
File Name:
10apr97_300.gif
Credits:
NOAA / The COMET Program
Copyright Terms:
COMET Standard Terms
of Use
Description:
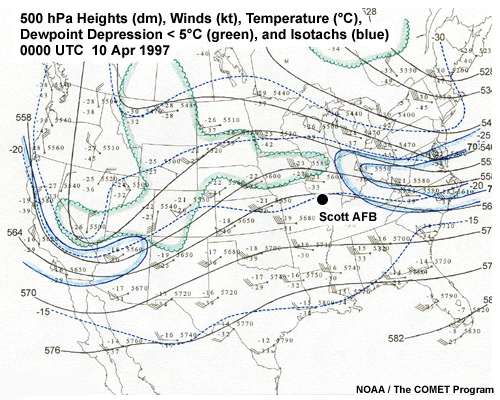
500 hPa Heights (dm), Winds (kt), Isotachs (kt), and Dewpoint Depression < 5C Over the Coterminous U.S. 0000 UTC 10 Apr 1997
File Name:
10apr97_500.gif
Credits:
NOAA / The COMET Program
Copyright Terms:
COMET Standard Terms
of Use
Description:
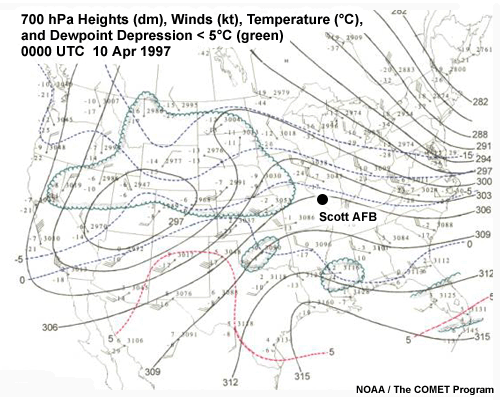
700 hPa Heights (dm), Winds (kt), Temperature ( C), and Dewpoint Depression < 5 C Over the Coterminous U.S. 0000 UTC 10 Apr 1997
File Name:
10apr97_700.gif
Credits:
NOAA / The COMET Program
Copyright Terms:
COMET Standard Terms
of Use
Description:
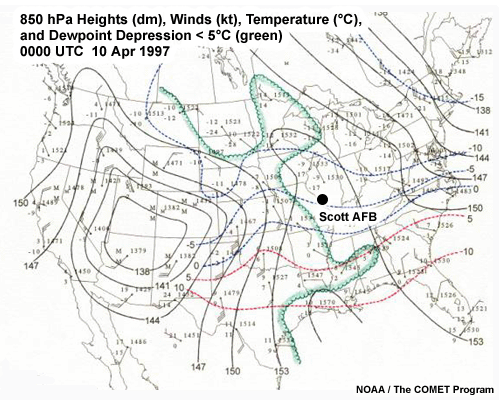
850 hPa Heights (dm), Winds (kt), Temperature ( C), and Dewpoint Depression < 5 C Over the Coterminous U.S. 0000 UTC 10 Apr 1997
File Name:
10apr97_850.gif
Credits:
NOAA / The COMET Program
Copyright Terms:
COMET Standard Terms
of Use
Description:
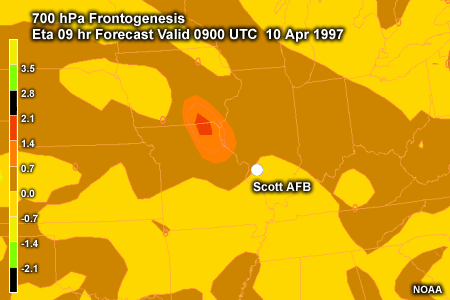
700 hPa Frontogenesis (shaded) and Omega (contours) Eta 09 hr Forecast valid 0900 UTC 10 Apr 1997
File Name:
10apr97fronto.gif
Credits:
NOAA
Copyright Terms:
COMET Standard Terms
of Use
Description:
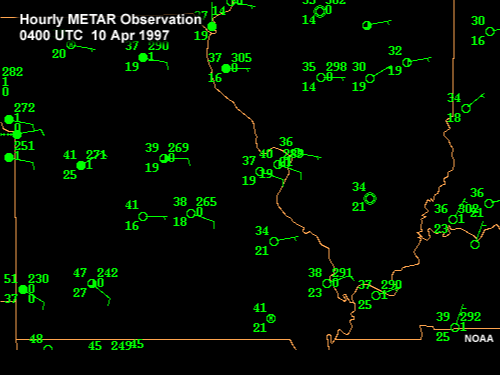
Hourly METAR observations in Missouri and Illinois 0000 to 2300 UTC 10 Apr 1997
File Name:
10apr97obs_01.htm
Credits:
NOAA
Copyright Terms:
COMET Standard Terms
of Use
Description:
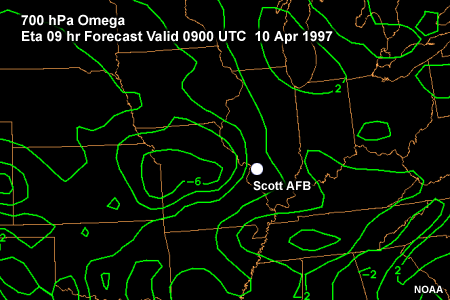
700 hPa Omega over the Midwestern US 50 km MASS 9 hr Forecast Valid 0900 UTC 10 Apr 1997
File Name:
10apr97omega.gif
Credits:
NOAA
Copyright Terms:
COMET Standard Terms
of Use
Description:
Composite Radar Reflectivity over the Central U.S. 1200 to 1600 UTC 10 Apr 1997
File Name:
10apr97radar.jpg
Credits:
NOAA
Copyright Terms:
COMET Standard Terms
of Use

Description:
Radar Image from St Louis, MO, 0931 UTC 10 Apr 1997
File Name:
10apr97radar_01.htm
Credits:
NOAA
Copyright Terms:
COMET Standard Terms
of Use
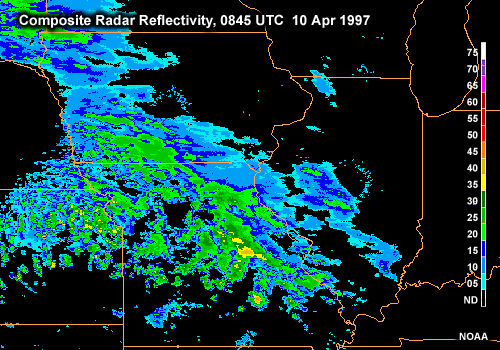
Description:
Composite Radar Reflectivity, over the Mississippi Valley, 0845 UTC 10 Apr 1997
File Name:
10apr97radar0845z.gif
Credits:
NOAA
Copyright Terms:
COMET Standard Terms
of Use

Description:
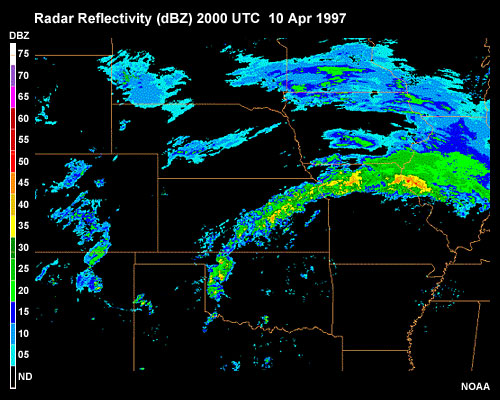
Radar reflectivity (dBZ) over the central U.S. 2000 UTC 10 Apr 1997
File Name:
10apr97radar2.gif
Credits:
NOAA
Copyright Terms:
COMET Standard Terms
of Use
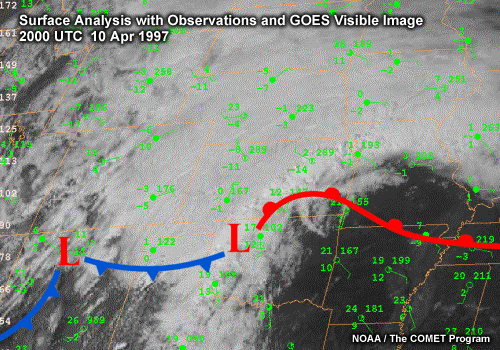
Description:
Surface Analysis with observations and GOES visible image 2000 UTC 10 Apr 1997
File Name:
10apr97satobs.gif
Credits:
NOAA/ The COMET Program
Copyright Terms:
COMET Standard Terms
of Use
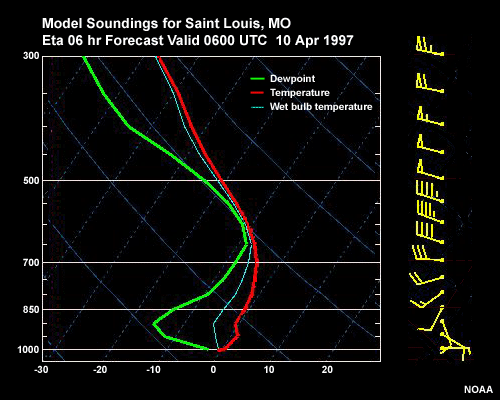
Description:
Eta Model soundings for Saint Louis, MO 0600 to 1800 10 Apr 1997
File Name:
10apr97sounding_01.htm
Credits:
NOAA
Copyright Terms:
COMET Standard Terms
of Use

Description:
24-hr loop of 6-hr Precipitation (blue, mm), 1000 hPa Temperature (green, C) and Wind(kt). Eta Forecast, 10 April 1997.
File Name:
10apr97twp_01.htm
Credits:
NOAA
Copyright Terms:
COMET Standard Terms
of Use
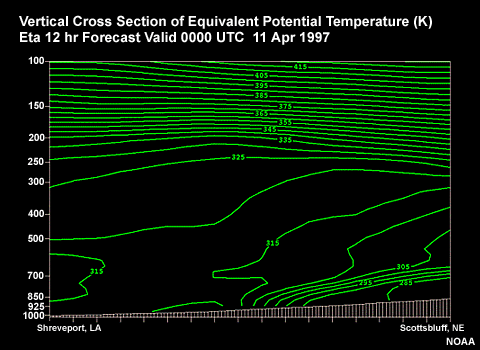
Description:
Vertical Cross Section of Equivalent Potential Temperature (K) from Shreveport LA to Scottsbluff, NE. Eta 12 hr Forecast Valid 0000 UTC 11 Apr 1997
File Name:
10apr97xs.gif
Credits:
NOAA
Copyright Terms:
COMET Standard Terms
of Use
Description:
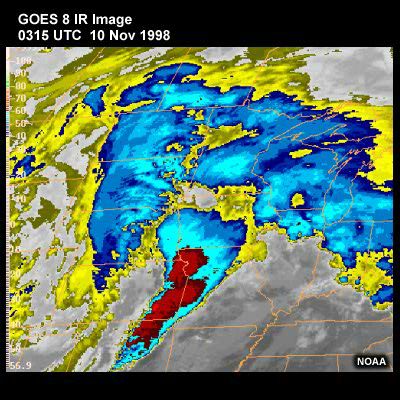
Loop of GOES-8 IR Images over the north central U.S. showing comma cloud 0315 UTC to 1615 UTC 10 Nov 1998
File Name:
10apr98ir_01.htm
Credits:
NOAA
Copyright Terms:
COMET Standard Terms
of Use
Description:
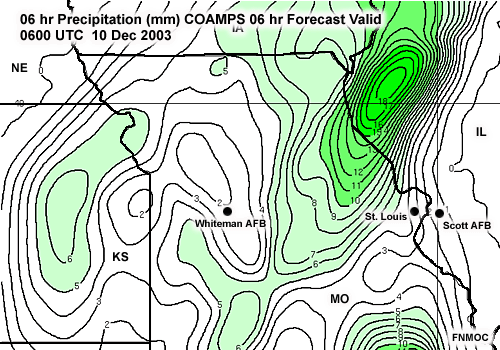
6 hr Precipitation (mm) over the Central US COAMPS 6 hr Forecast valid 0600 UTC 10 Dec 2003
File Name:
10dec03coamps_precip.gif
Credits:
FNMOC
Copyright Terms:
COMET Standard Terms
of Use
Description:
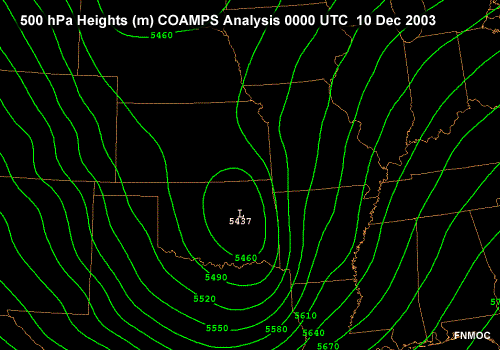
500 hPa Heights over the central U.S. COAMPS Analysis 0000 UTC 10 Dec 2003
File Name:
10dec03coamps500.gif
Credits:
FNMOC
Copyright Terms:
COMET Standard Terms
of Use
Description:
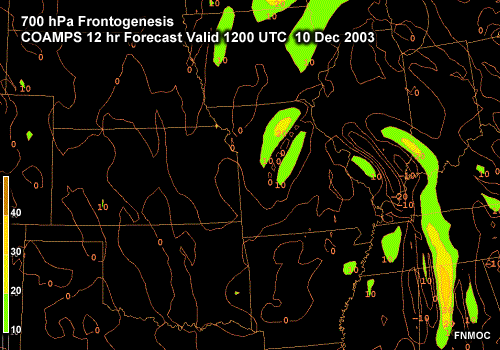
700 hPa Frontogenesis over the central US NOGAPS 12 hr Forecast valid 1200 UTC 10 Dec 2003
File Name:
10dec03coamps700frontg.gif
Credits:
FNMOC
Copyright Terms:
COMET Standard Terms
of Use
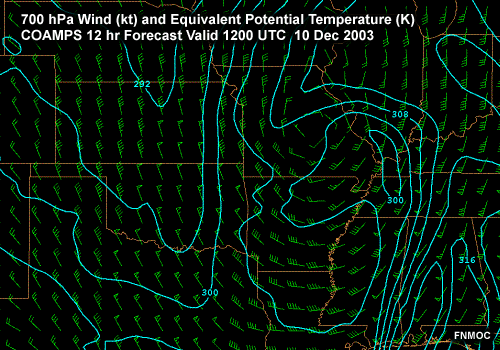
Description:
700 hPa Wind (kt) and Equivalent Potential Temperature (K) over the central US COAMPS 12 hr Forecast valid 1200 UTC 10 Dec 2003
File Name:
10dec03coamps700wept_1.gif
Credits:
FNMOC
Copyright Terms:
COMET Standard Terms
of Use
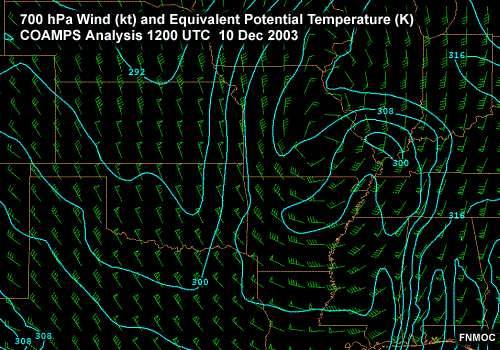
Description:
700 hPa Wind (kt) and Equivalent Potential Temperature (K) over the central US COAMPS Analysis 1200 UTC 10 Dec 2003
File Name:
10dec03coamps700wept_2.gif
Credits:
FNMOC
Copyright Terms:
COMET Standard Terms
of Use
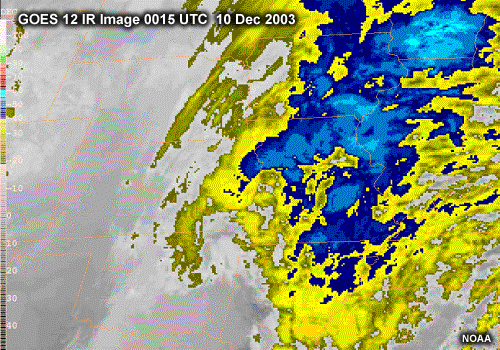
Description:
GOES-12 IR image of the central US 0015 UTC 10 Dec 2003
File Name:
10dec03ir.gif
Credits:
NOAA
Copyright Terms:
COMET Standard Terms
of Use
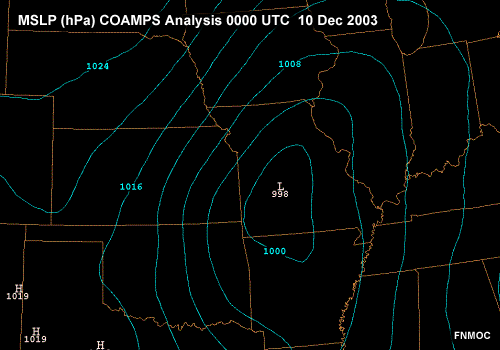
Description:
MSLP over the central US COAMPS Analysis 0000 UTC 10 Dec 2003
File Name:
10dec03mslp.gif
Credits:
FNMOC
Copyright Terms:
COMET Standard Terms
of Use
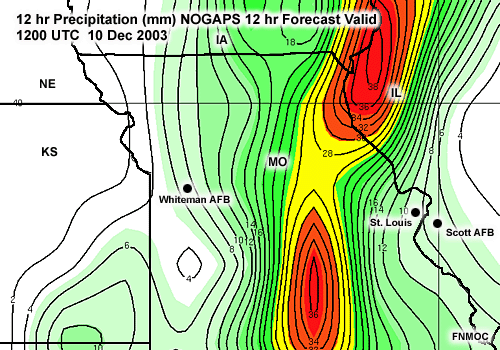
Description:
12 hr Precipitation (mm) over the Central US NOGAPS 12 hr Forecast valid 1200 UTC 10 Dec 2003
File Name:
10dec03nogaps_precip.gif
Credits:
FNMOC
Copyright Terms:
COMET Standard Terms
of Use

Description:
500 hPa Heights over the central U.S. NOGAPS Analysis 0000 UTC 10 Dec 2003
File Name:
10dec03nogaps500.gif
Credits:
FNMOC
Copyright Terms:
COMET Standard Terms
of Use
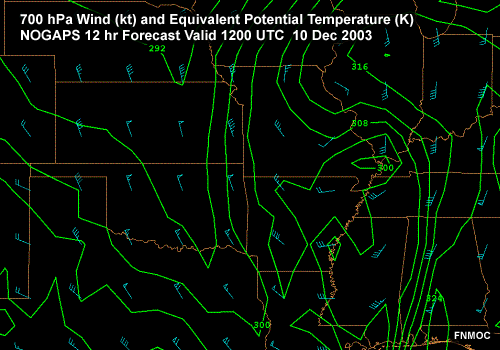
Description:
700 hPa Wind (kt) and Equivalent Potential Temperature (K) over the central US NOGAPS 12 hr Forecast valid 1200 UTC 10 Dec 2003
File Name:
10dec03nogaps700wept.gif
Credits:
FNMOC
Copyright Terms:
COMET Standard Terms
of Use
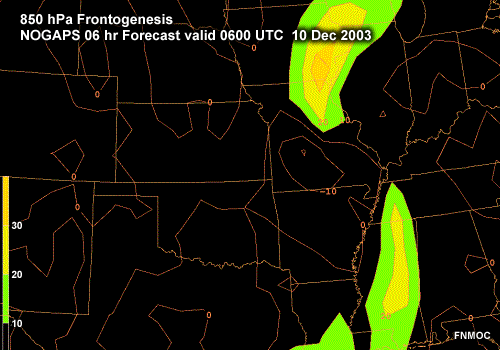
Description:
850 hPa Frontogenesis over the central US NOGAPS 6 hr Forecast valid 0600 UTC 10 Dec 2003
File Name:
10dec03nogaps850frontg.gif
Credits:
FNMOC
Copyright Terms:
COMET Standard Terms
of Use
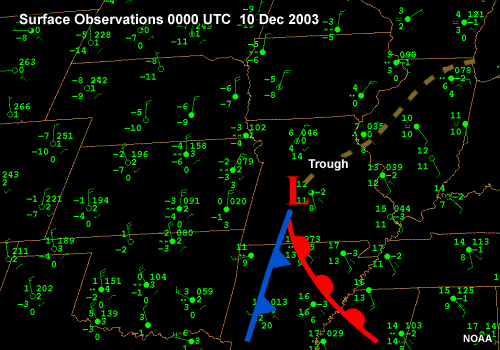
Description:
Surface Observations over the central US 0000 UTC 10 Dec 2003
File Name:
10dec03obs.gif
Credits:
NOAA
Copyright Terms:
COMET Standard Terms
of Use
Description:
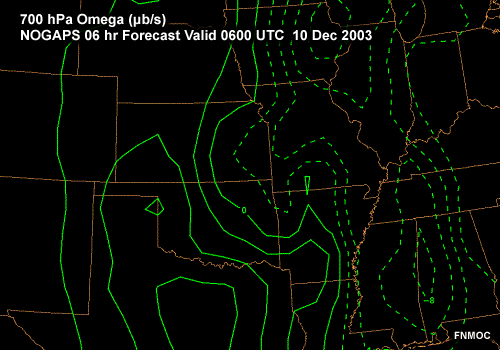
700 hPa Omega over the central US NOGAPS 6 hr Forecast valid 0600 UTC 10 Dec 2003
File Name:
10dec03omega06h.gif
Credits:
FNMOC
Copyright Terms:
COMET Standard Terms
of Use
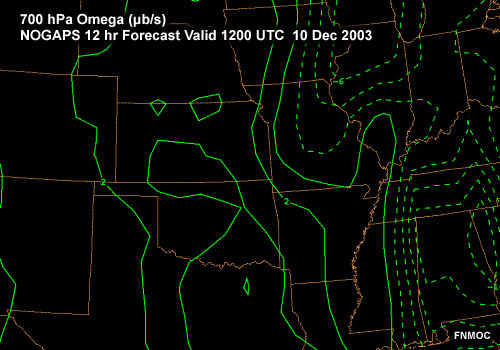
Description:
700 hPa Omega over the central US NOGAPS 12 hr Forecast valid 1200 UTC 10 Dec 2003
File Name:
10dec03omega12h.gif
Credits:
FNMOC
Copyright Terms:
COMET Standard Terms
of Use
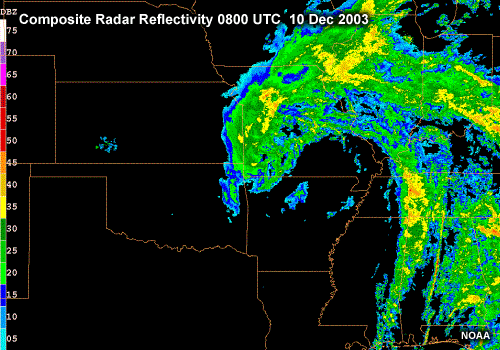
Description:
Composite Radar Reflectivity over the central US 0800 UTC 10 Dec 2003
File Name:
10dec03radar.gif
Credits:
NOAA
Copyright Terms:
COMET Standard Terms
of Use
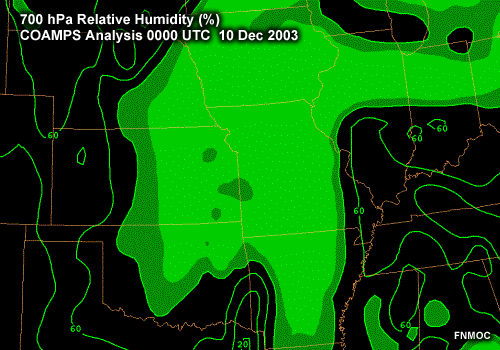
Description:
700 hPa Relative Humidity over the central US COAMPS Analysis 0000 UTC 10 Dec 2003
File Name:
10dec03rh700.gif
Credits:
FNMOC
Copyright Terms:
COMET Standard Terms
of Use
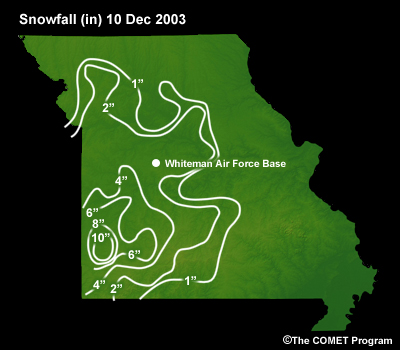
Description:
Map of Missouri showing snowfall for storm of 10 Dec 2003. Over 6" fell in the southwest part of the state
File Name:
10dec03snow.jpg
Credits:
©The COMET Program
Copyright Terms:
COMET Standard Terms
of Use
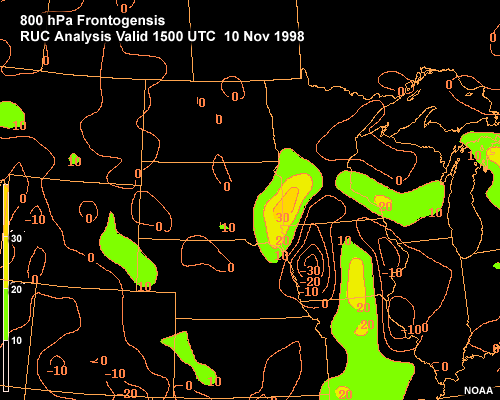
Description:
800 hPa Frontogenesis RUC Analysis valid 1200 UTC 10 Nov 1998
File Name:
10nov98fronto.gif
Credits:
NOAA
Copyright Terms:
COMET Standard Terms
of Use
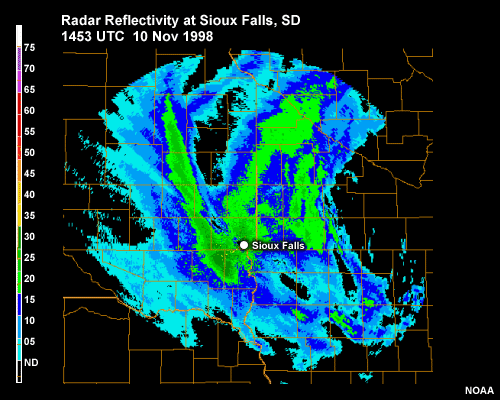
Description:
Loop of Radar Reflectivity at Sioux Falls, SD 1453 UTC to 1701 UTC 10 Nov 1998 showing persistent banded precipitation through the period
File Name:
10nov98kfsd_01.htm
Credits:
NOAA
Copyright Terms:
COMET Standard Terms
of Use
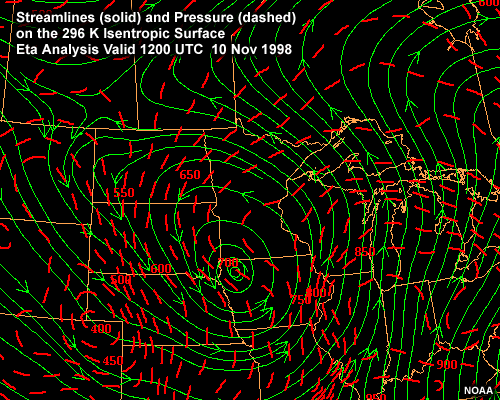
Description:
Streamlines and Pressure on the 296-K Isentropic Surface Eta Analysis valid 1200 UTC 10 Nov 1998
File Name:
10nov98stream.gif
Credits:
NOAA
Copyright Terms:
COMET Standard Terms
of Use
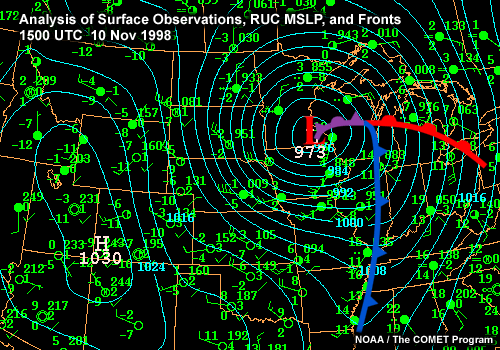
Description:
Surface Analysis of the central U.S. 1500 UTC 10 Nov 1998
File Name:
10nov98synsfc.gif
Credits:
NOAA / The COMET Program
Copyright Terms:
COMET Standard Terms
of Use
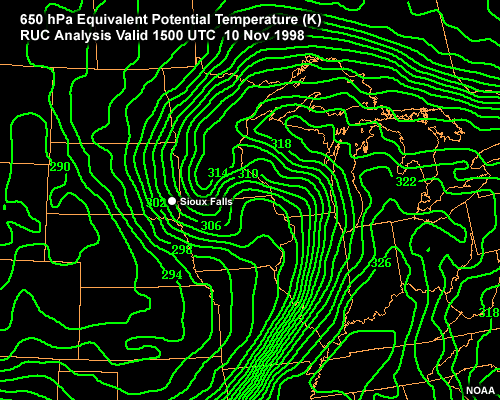
Description:
Equivalent Potential Temperature over the north-central U.S. showing a distinctive S-pattern associated with a TROWAL RUC Analysis valid 1500 UTC 10 Nov 1998
File Name:
10nov98thetae.gif
Credits:
NOAA
Copyright Terms:
COMET Standard Terms
of Use
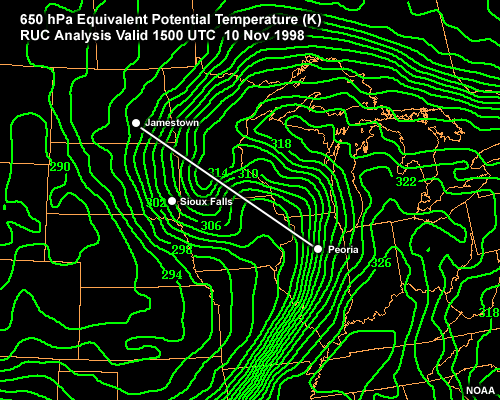
Description:
same as 10nov98thetae.gif, but has a line of cross section added from Jamestown, ND to Peoria, IL
File Name:
10nov98thetae_2.gif
Credits:
NOAA
Copyright Terms:
COMET Standard Terms
of Use
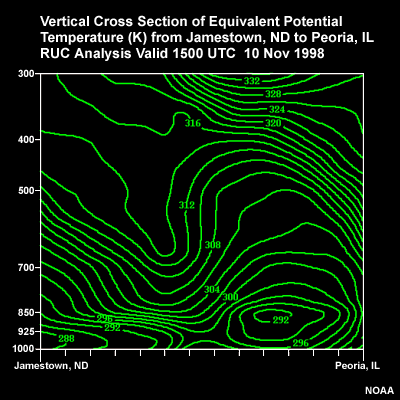
Description:
Vertical Cross Section of Equivalent Potential Temperature from Jamestown, ND to Peoria, IL showing a distinct TROWAL RUC Analysis valid 1500 UTC 10 Nov 1998
File Name:
10nov98thetae_xs.gif
Credits:
NOAA
Copyright Terms:
COMET Standard Terms
of Use
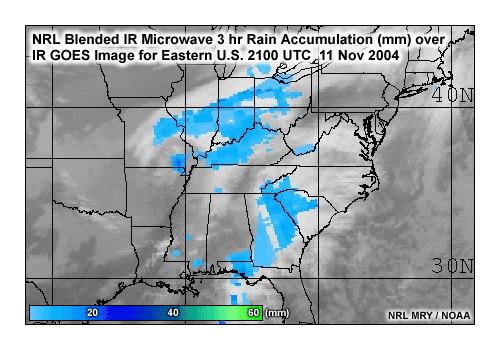
Description:
NRL Blended IR-Microwave 3-hr Rain Accumulation (mm) over GOES IR Image for eastern US. 2100 UTC 11 Nov 2004
File Name:
11nov04nrlrain.gif
Credits:
NRL MRY / NOAA
Copyright Terms:
COMET Standard Terms
of Use
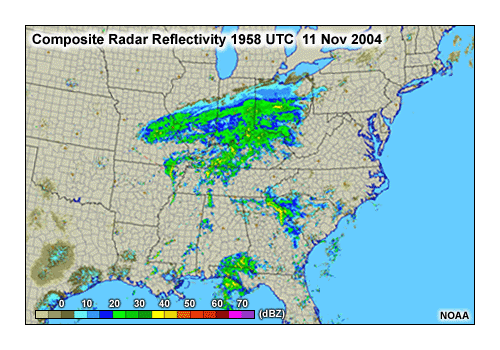
Description:
Composite radar reflectivity over the eastern U.S. 1958 UTC 11 Nov 2004
File Name:
11nov04radar.gif
Credits:
NOAA
Copyright Terms:
COMET Standard Terms
of Use
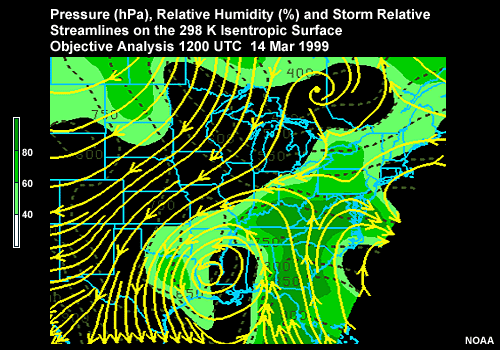
Description:
Pressure (hPa), Relative Humidity (%) and Storm-relative Streamlines on the 298 K Isentropic Surface. MASS Analysis 1200 UTC 14 Mar 1999 over the US
File Name:
14mar99_298k.gif
Credits:
NOAA
Copyright Terms:
COMET Standard Terms
of Use
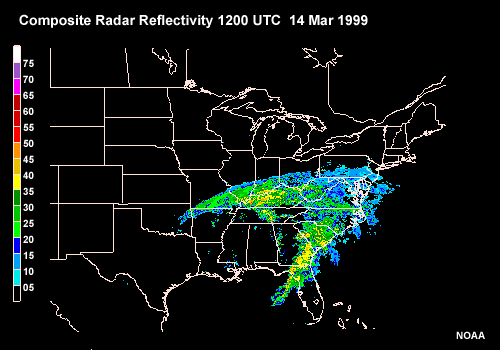
Description:
Composite Radar Reflectivity over the U.S. 1200 UTC 14 Mar 1999
File Name:
14mar99_radar.gif
Credits:
NOAA
Copyright Terms:
COMET Standard Terms
of Use
Description:
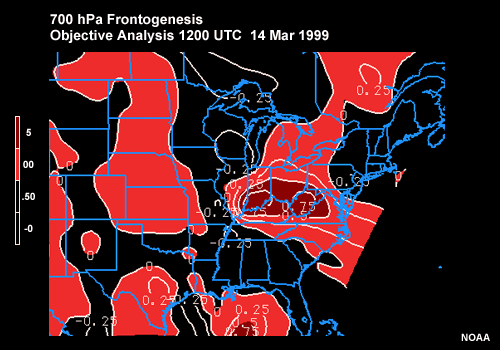
Frontogenesis over the coterminous U.S. Objective Analysis 1200 UTC 14 Mar 1999
File Name:
14mar99fronto.gif
Credits:
NOAA
Copyright Terms:
COMET Standard Terms
of Use
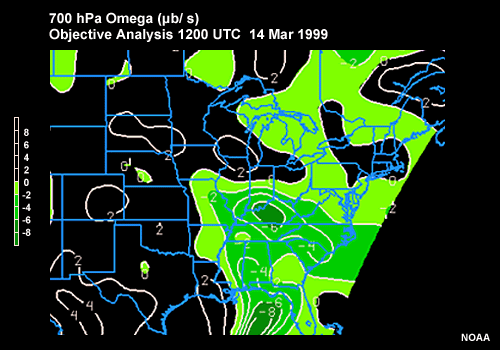
Description:
Omega over the coterminous U.S. Objective Analysis 1200 UTC 14 Mar 1999
File Name:
14mar99omega.gif
Credits:
NOAA
Copyright Terms:
COMET Standard Terms
of Use
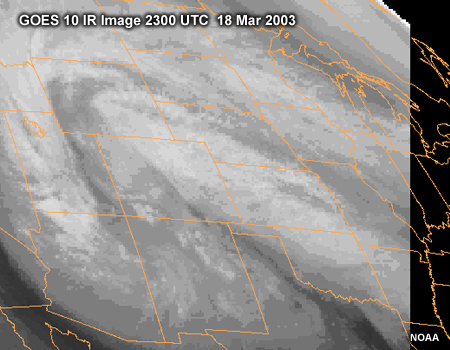
Description:
GOES-10 IR Image of the western U.S. 2300 UTC 18 Mar 2003
File Name:
18mar03ir.jpg
Credits:
NOAA
Copyright Terms:
COMET Standard Terms
of Use
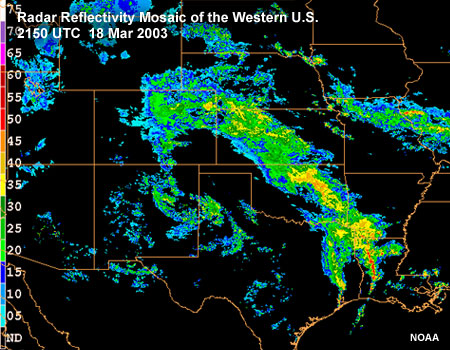
Description:
Radar Reflectivity Mosaic of the Western U.S. 2150 UTC 18 Mar 2003
File Name:
18mar03radar.jpg
Credits:
NOAA
Copyright Terms:
COMET Standard Terms
of Use
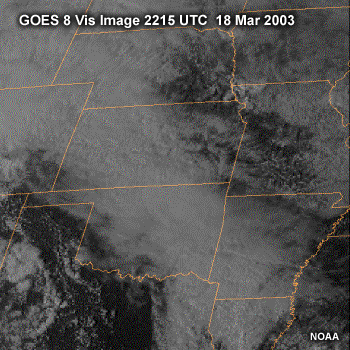
Description:
GOES-8 Vis Image over the central U.S. 2215 UTC 18 Mar 2003
File Name:
18mar03vis.gif
Credits:
NOAA
Copyright Terms:
COMET Standard Terms
of Use

Description:
Vertical Cross Section of Equivalent Potential Temperture (K) from Amarillo, TX to Omaha, NE. Eta 6 hr Forecast Valid 0600 UTC 19 Mar 2003
File Name:
19mar03xs.jpg
Credits:
NOAA
Copyright Terms:
COMET Standard Terms
of Use
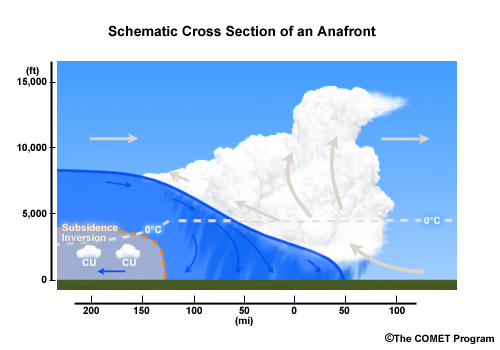
Description:
Schematic cross section of an anafront showing clouds and winds
File Name:
anafront_schematic.jpg
Credits:
©The COMET Program
Copyright Terms:
COMET Standard Terms
of Use
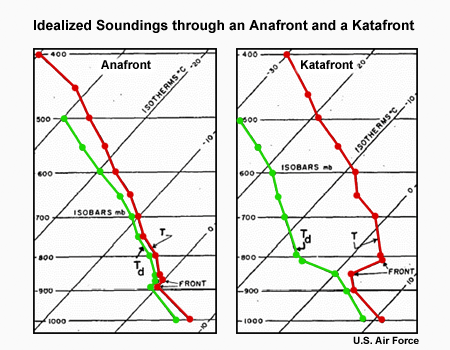
Description:
Idealized soundings through an anafront and a katafront.
File Name:
anakata_soundings.gif
Credits:
U.S Air Force
Copyright Terms:
COMET Standard Terms
of Use
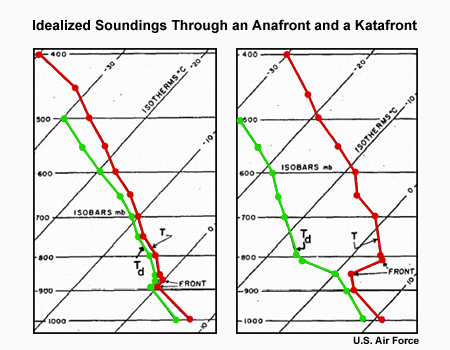
Description:
Idealized soundings through an anafront and a katafront.
File Name:
anakata_soundings1.gif
Credits:
U.S Air Force
Copyright Terms:
COMET Standard Terms
of Use
Description:
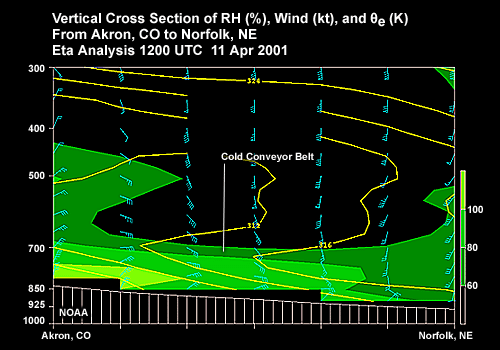
Vertical cross section of RH (%), Wind (kt), and Theta-e (K) from Akron, CO to Norfolk, NE Eta Analysis 1200 UTC 11 Apr 2001 showing low-level cold conveyor belt
File Name:
ccb_xs.gif
Credits:
NOAA
Copyright Terms:
COMET Standard Terms
of Use
Description:
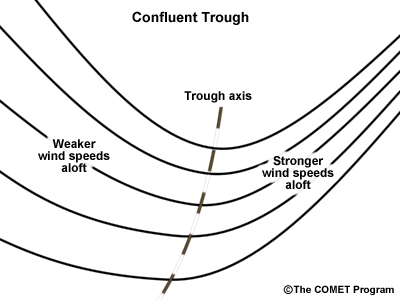
Schematic diagram of a confluent trough
File Name:
confluent_trough.gif
Credits:
©The COMET Program
Copyright Terms:
COMET Standard Terms
of Use
Description:
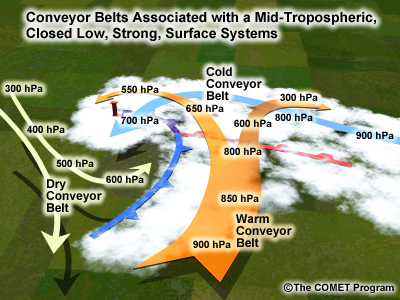
Schematic diagram of conveyor belts associated with a mid-tropospheric closed low, strong surface systems
File Name:
conveyor_strong.jpg
Credits:
©The COMET Program
Copyright Terms:
COMET Standard Terms
of Use
Description:
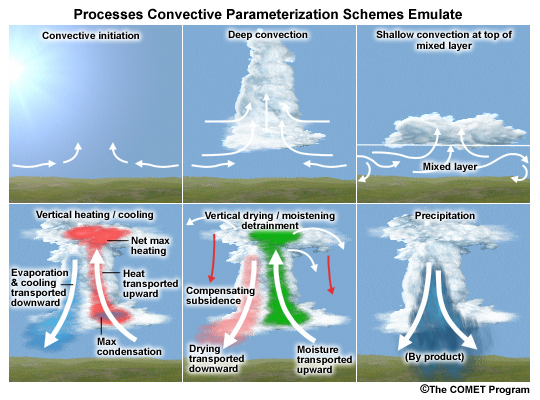
6-panel diagram showing processes that are emulated by convective parameterization schemes
File Name:
cpsimtbl.jpg
Credits:
©The COMET Program
Copyright Terms:
COMET Standard Terms
of Use
Description:
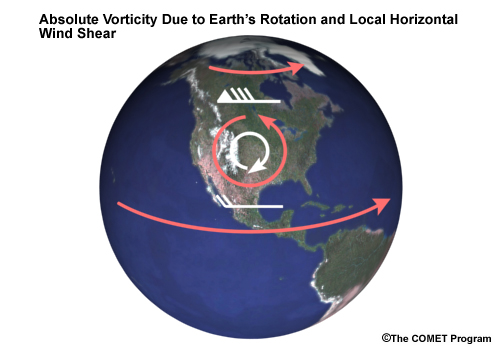
Absolute Vorticity due to Earth's Rotation and Local Horizontal Wind Shear
File Name:
csi_abs_vort.jpg
Credits:
©The COMET Program
Copyright Terms:
COMET Standard Terms
of Use
Description:
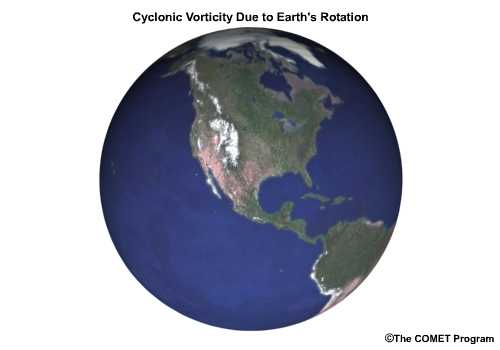
Cyclonic Vorticity due to Earth's Rotation
File Name:
csi_earth_vort.jpg
Credits:
©The COMET Program
Copyright Terms:
COMET Standard Terms
of Use

Description:
Schematic plot of 500 hPa heights with arrows depicting geostrophic flow
File Name:
csi_horz_stability.gif
Credits:
©The COMET Program
Copyright Terms:
COMET Standard Terms
of Use
Description:
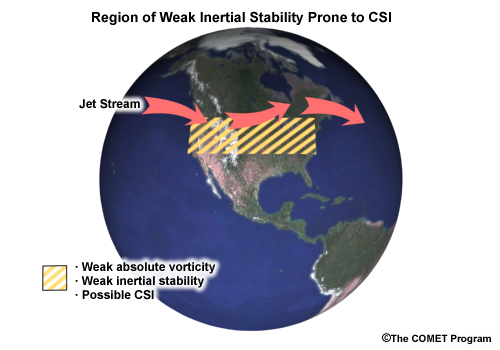
Region of Weak Inertial Stability Prone to CSI
File Name:
csi_inertial_stability.jpg
Credits:
©The COMET Program
Copyright Terms:
COMET Standard Terms
of Use
Description:
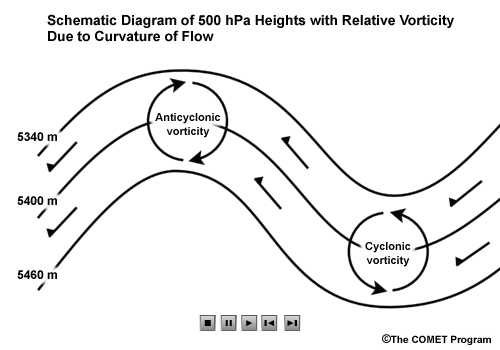
Schematic diagram of 500 hPa heights with relative vorticity due to curvature of flow
File Name:
csi_rel_vert_curve.jpg
Credits:
©The COMET Program
Copyright Terms:
COMET Standard Terms
of Use
Description:
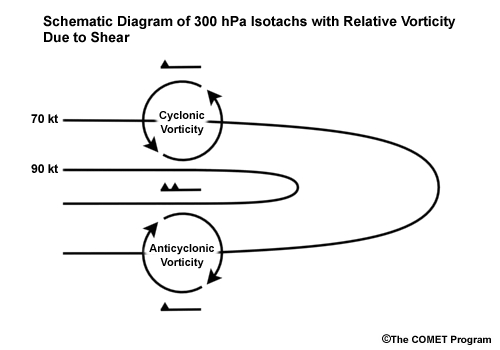
Schematic diagram of 300 hPa isotachs with relative vorticity due tohorizontal wind shear
File Name:
csi_rel_vort_shear.gif
Credits:
©The COMET Program
Copyright Terms:
COMET Standard Terms
of Use
Description:
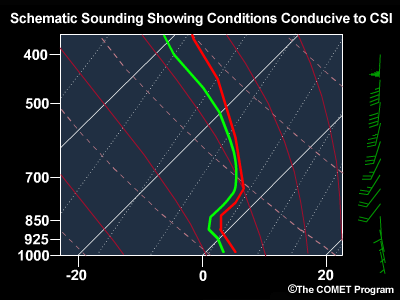
Schematic sounding showing conditions conducive to CSI
File Name:
csi_sounding.gif
Credits:
©The COMET Program
Copyright Terms:
COMET Standard Terms
of Use
Description:
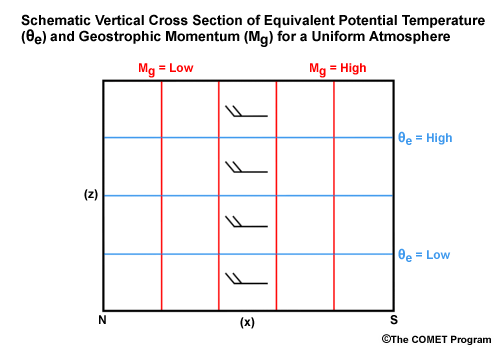
Schematic Vertical Cross Section of Equivalent Potential Temperature and Geostrophic Momentum for a Uniform Atmosphere
File Name:
csi_thetaemg_1.gif
Credits:
©The COMET Program
Copyright Terms:
COMET Standard Terms
of Use
Description:
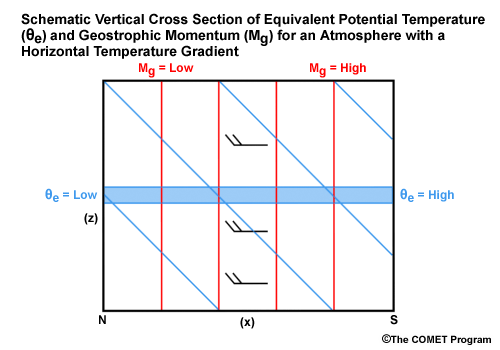
Schematic Vertical Cross Section of Equivalent Potential Temperature and Geostrophic Momentum for an Atmosphere with a Horizontal Temperature Gradient
File Name:
csi_thetaemg_2.gif
Credits:
©The COMET Program
Copyright Terms:
COMET Standard Terms
of Use
Description:
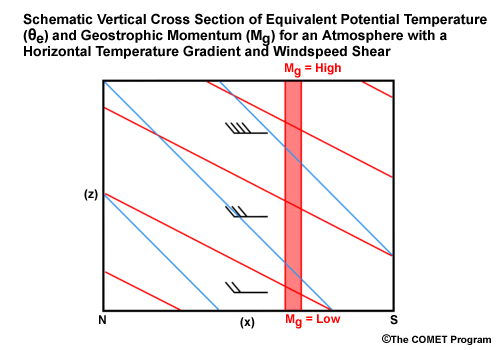
Schematic Vertical Cross Section of Equivalent Potential Temperature and Geostrophic Momentum for an Atmosphere with a Horizontal Temperature Gradient and Windspeed Shear
File Name:
csi_thetaemg_3.gif
Credits:
©The COMET Program
Copyright Terms:
COMET Standard Terms
of Use
Description:
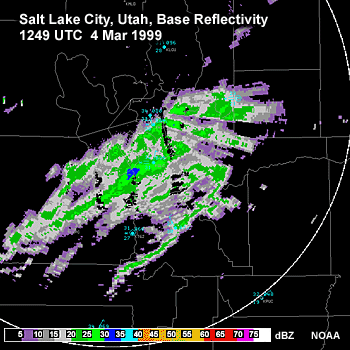
Radar base reflectivity image showing csi-caused banded precipitaiton over northern Utah 1249 UTC 4 Mar 1999.
File Name:
csi_utah_radar.gif
Credits:
NOAA
Copyright Terms:
COMET Standard Terms
of Use

Description:
Skew-T / log P diagram showing stability fields for an air parcel at 1000 hPa at 10 degrees C
File Name:
csi_vert_stability.jpg
Credits:
©The COMET Program
Copyright Terms:
COMET Standard Terms
of Use
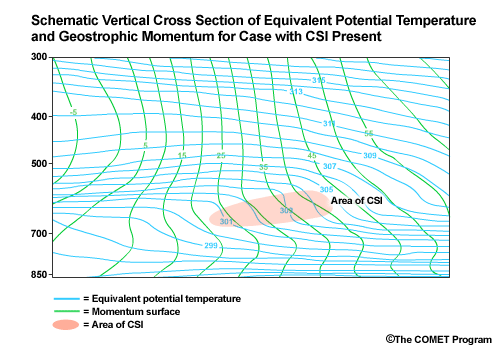
Description:
Schematic vertical cross section of equivalent potential temperature and geostrophic momentum with region of CSI shown where theta-e contours are steeper than mommentum contours
File Name:
csi_xs.gif
Credits:
©The COMET Program
Copyright Terms:
COMET Standard Terms
of Use
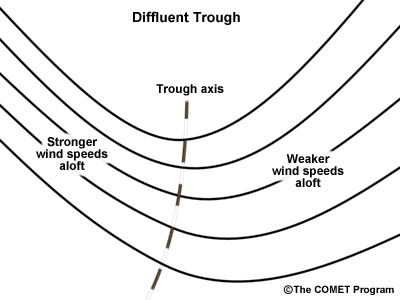
Description:
Schematic diagram of a diffluent trough
File Name:
diffluent_trough.gif
Credits:
©The COMET Program
Copyright Terms:
COMET Standard Terms
of Use
Description:
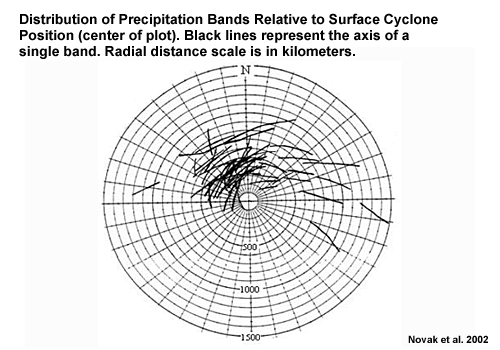
Distribution of precipitation bands relative to surface cyclone position (center of plot). Black lines represent the axis of a single band. Radial distance scale is in kilometers.
File Name:
dist_rel_stereo.gif
Credits:
Novak et. al. 2002
Copyright Terms:
COMET Standard Terms
of Use
Description:
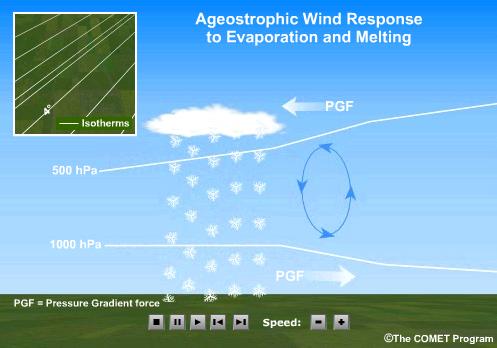
Animation depicting ageostrophic wind circulation induced by evaporation of falling precipitation
File Name:
evap_ageowind.jpg
Credits:
©The COMET Program
Copyright Terms:
COMET Standard Terms
of Use
Description:
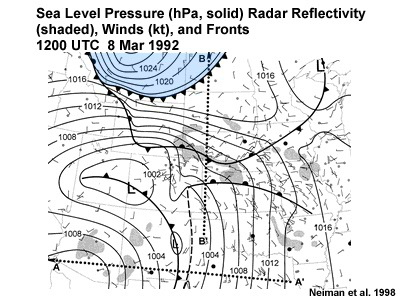
Sequence of surface weather maps over the central US from 1200 UTC 8 Mar 1992 to 1200 UTC 10 Mar 1992 showing a frontal merger event. Sea level pressure (hPa, solid) radar reflectivity (shaded), and analysis.
File Name:
frontal_merger_mar92_01.htm
Credits:
Neiman et al. 1998
Copyright Terms:
COMET Standard Terms
of Use
Description:
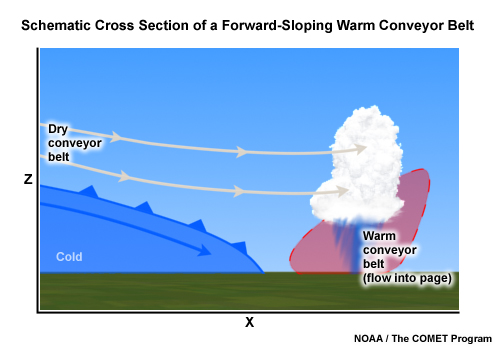
Schematic cross section of a forward-sloping warm conveyor belt
File Name:
fwd_wcb_xs.jpg
Credits:
©The COMET Program
Copyright Terms:
COMET Standard Terms
of Use
Description:
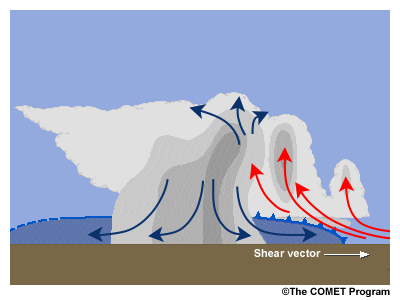
schematic diagram showing downshear propagation of a convective storm
File Name:
gustfrnt.gif
Credits:
©The COMET Program
Copyright Terms:
COMET Standard Terms
of Use
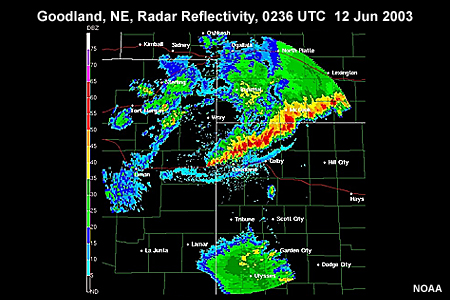
Description:
Goodland , NE, radar reflectivity showing a strong squall line with associated gust front (blue reflection) south of strong red and yellow reflections) in northwest Kansas, 0236 UTC 12 Jun 2003.
File Name:
gustfront_radar.jpg
Credits:
NOAA
Copyright Terms:
COMET Standard Terms
of Use
Description:
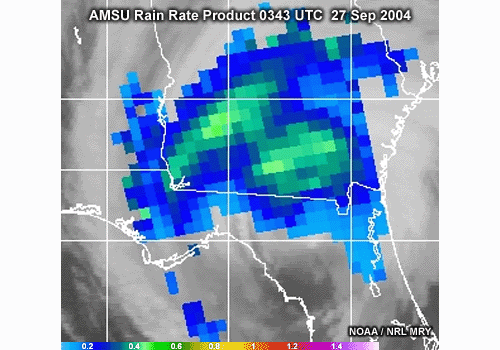
AMSU-B Rain Rate Image over the southeast U.S. showing Hurrican Jeanne 0343 UTC 27 Sep 2004
File Name:
jeanne_amsub.gif
Credits:
NOAA / NRL MRY
Copyright Terms:
COMET Standard Terms
of Use
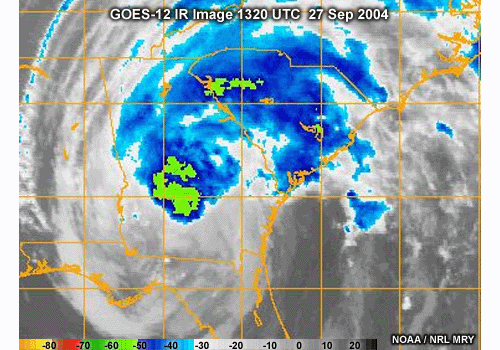
Description:
GOES-12 IR Image over the southeast U.S. showing Hurrican Jeanne 1320 UTC 27 Sep 2004
File Name:
jeanne_ir.gif
Credits:
NOAA / NRL MRY
Copyright Terms:
COMET Standard Terms
of Use
Description:
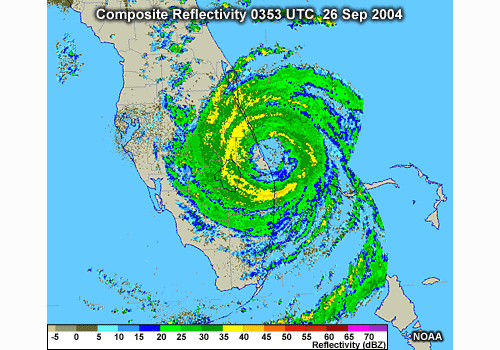
Composite Reflectivity over the southeast U.S. showing Hurrican Jeanne 0353 UTC 26 Sep 2004
File Name:
jeanne_radar_0353.gif
Credits:
NOAA
Copyright Terms:
COMET Standard Terms
of Use
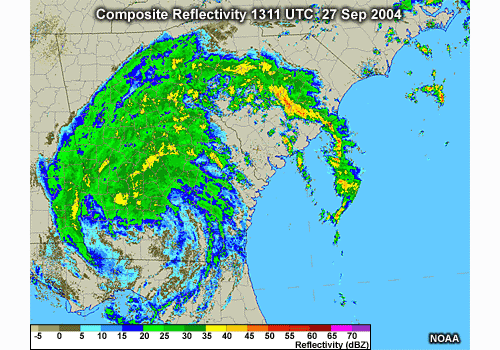
Description:
Composite Reflectivity over the southeast U.S. showing Hurrican Jeanne 1311 UTC 27 Sep 2004
File Name:
jeanne_radar_1311.gif
Credits:
NOAA
Copyright Terms:
COMET Standard Terms
of Use
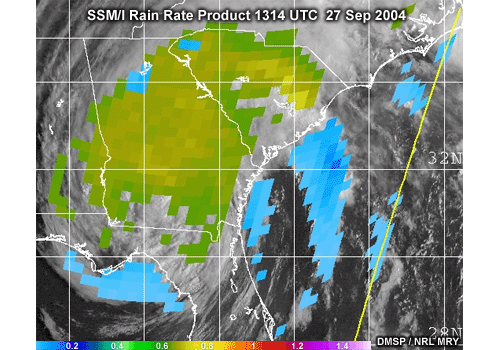
Description:
SSM/I Rain Rate Product overylying the GOES-12 Vis Image over the southeast U.S. showing Hurrican Jeanne 1314 UTC 27 Sep 2004
File Name:
jeanne_smmi.gif
Credits:
DMSP / NRL MRY
Copyright Terms:
COMET Standard Terms
of Use
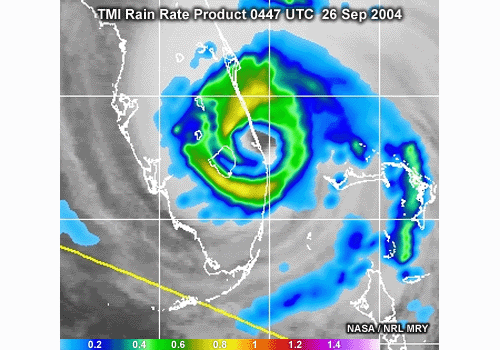
Description:
TMI Rain Rate Product overylying the GOES-12 Vis Image over the southeast U.S. showing Hurrican Jeanne 0447 UTC 26 Sep 2004
File Name:
jeanne_tmi.gif
Credits:
NASA / NRL MRY
Copyright Terms:
COMET Standard Terms
of Use

Description:
Jacksonville, FL Base Reflectivity over the southeast U.S. showing Hurrican Jeanne 0348 UTC 27 Sep 2004
File Name:
jeanne_trmmpr.gif
Credits:
NASA / NRL MRY
Copyright Terms:
COMET Standard Terms
of Use
Description:
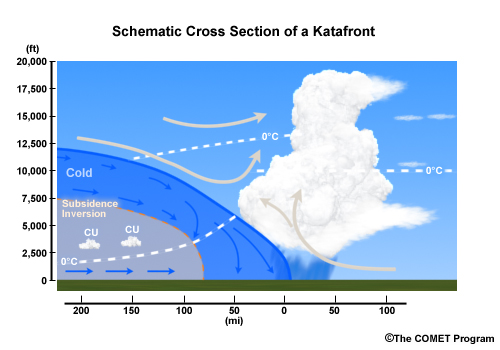
Schematic cross section of an katafront showing clouds and winds
File Name:
katafront_schematic.jpg
Credits:
©The COMET Program
Copyright Terms:
COMET Standard Terms
of Use
Description:
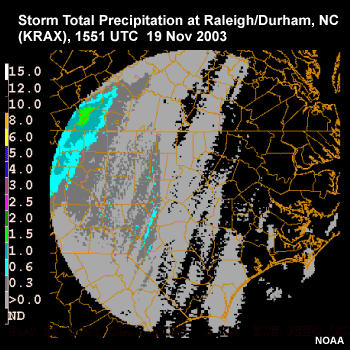
Storm total precipitation at Raleigh/Durham, NC (KRAX), 1552 UTC 19 Nov 2003
File Name:
krax_stp.gif
Credits:
NOAA
Copyright Terms:
COMET Standard Terms
of Use
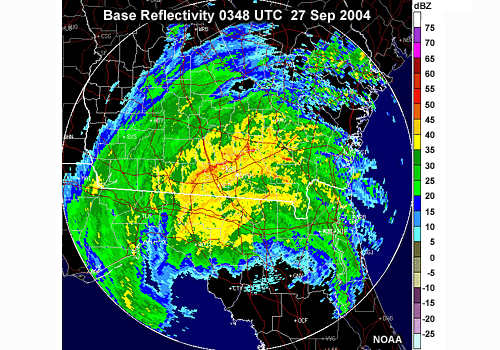
Description:
Jacksonville, FL Base Reflectivity over the southeast U.S. showing Hurrican Jeanne 0348 UTC 27 Sep 2004
File Name:
kvax_0348.gif
Credits:
NOAA
Copyright Terms:
COMET Standard Terms
of Use
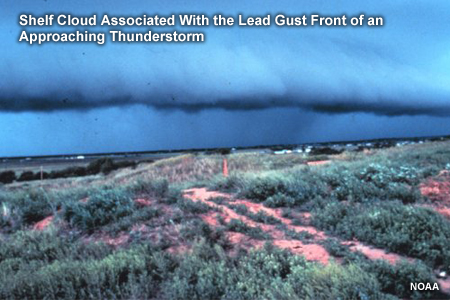
Description:
Photo of shelf cloud associated with the lead gust front of an approaching thunderstorm, Brookhaven, New Mexico, 1982.
File Name:
shelfcloud.jpg
Credits:
NOAA Photo Library, NOAA Central Library; OAR/ERL/NSSL
Copyright Terms:
COMET Standard Terms
of Use
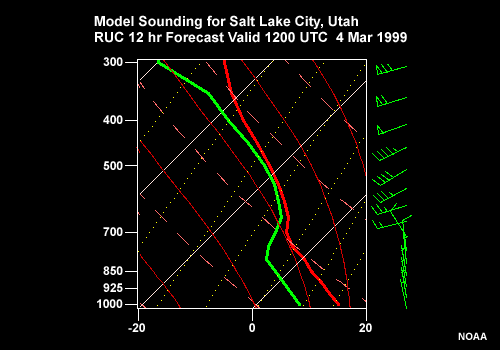
Description:
Model Sounding at Salt Lake City, Utah. Ruc 12 hr Forecast valid 1200 UTC 4 Mar 1999
File Name:
slc_ruc_sounding.gif
Credits:
NOAA
Copyright Terms:
COMET Standard Terms
of Use
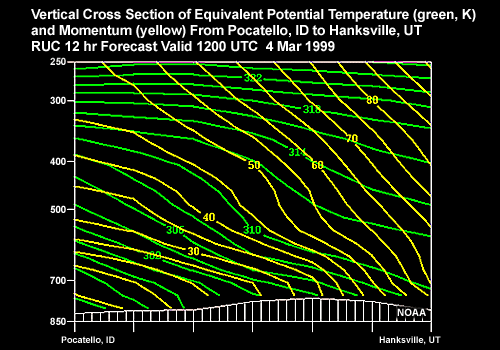
Description:
Vertical Cross Section of Equivalent Potential Temperature (green, K) and Momentum (yellow) from Pocatello, ID to Hanksville, UT. RUC 12 hr Forecast valid 1200 UTC 4 Mar 1999
File Name:
slc_xs1.gif
Credits:
NOAA
Copyright Terms:
COMET Standard Terms
of Use
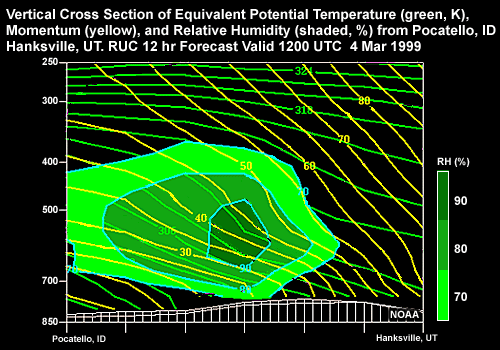
Description:
Vertical Cross Section of Equivalent Potential Temperature (green, K), Momentum (yellow), Omega ( b/s), and Relative Humidity (shaded, %) from Pocatello, ID to Hanksville, UT. RUC 12 hr Forecast valid 1200 UTC 4 Mar 1999
File Name:
slc_xs2.gif
Credits:
NOAA
Copyright Terms:
COMET Standard Terms
of Use
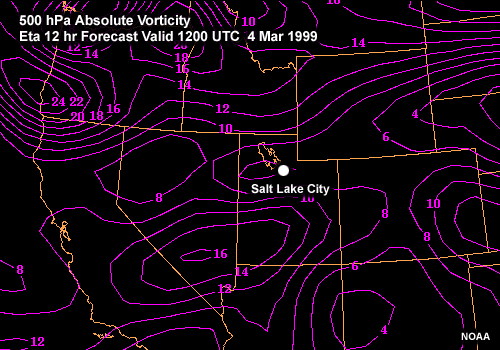
Description:
500 hPa Absolute Vorticity over the Western U.S. Eta 12 hr Forecast valid 1200 UTC 4 Mar 1999
File Name:
slc500absvort.gif
Credits:
NOAA
Copyright Terms:
COMET Standard Terms
of Use
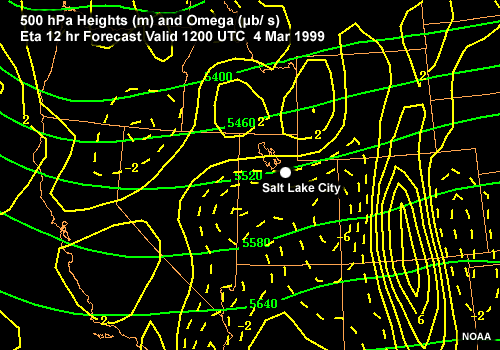
Description:
500 hPa Heights (m) and Omega ( b/s) over the Western U.S. Eta 12 hr Forecast valid 1200 UTC 4 Mar 1999
File Name:
slc500htomega.gif
Credits:
NOAA
Copyright Terms:
COMET Standard Terms
of Use
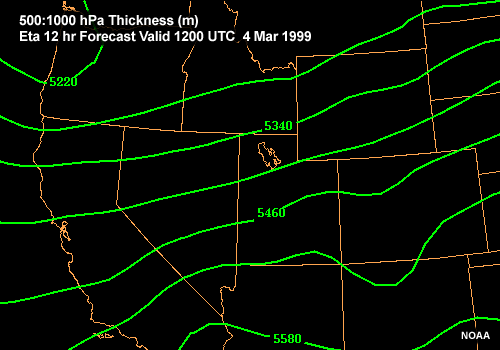
Description:
500:1000 hPa Thickness (m) over the Western U.S. Eta 12 hr Forecast valid 1200 UTC 4 Mar 1999
File Name:
slc500thk.gif
Credits:
NOAA
Copyright Terms:
COMET Standard Terms
of Use

Description:
Animation depicting a lowering snow-rain level due to diabatic cooling
File Name:
snowrain.jpg
Credits:
©The COMET Program
Copyright Terms:
COMET Standard Terms
of Use
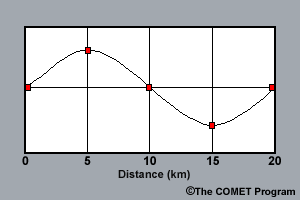
Description:
Diagram showing a sine wave with 5 points highlighted on the wave at 5 km intervals
File Name:
wave_res2.gif
Credits:
©The COMET Program
Copyright Terms:
COMET Standard Terms
of Use
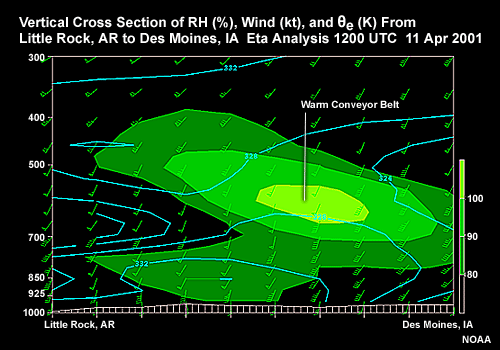
Description:
Vertical cross section of RH (%), Wind (kt), and Theta-e (K) from Little Rock, AR, to Desmoines, IA, Eta Analysis 1200 UTC 11 Apr 2001 showing warm conveyor belt
File Name:
wcb_xs.gif
Credits:
NOAA
Copyright Terms:
COMET Standard Terms
of Use