Pre-Lab: Identifying Deformation Zones » Deformation Zone Identification Practice
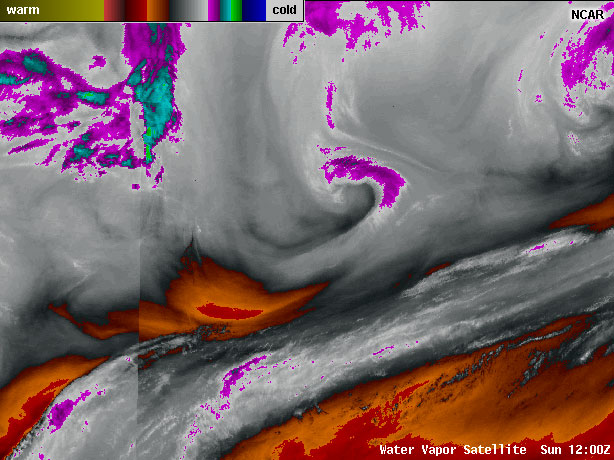
Now we will practice identifying and drawing deformation zones. Watch the satellite loops in the first tabs, and analyze major vorticity maxima, minima, axes of max winds, and deformation zones in the second tab. Click “done” to compare your analysis to the solution.
Question 1 of 2
| Tool: | Tool Size: | Color: |
|---|---|---|
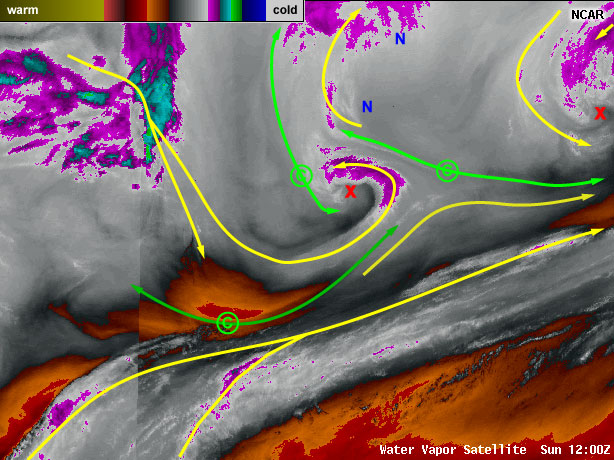
We'll start our discussion with the southernmost axes of maximum winds - these are southwesterly flow associated with the subtropical jet.
The main player in the image is the vorticity maximum at the center of the page. This vort max/cyclone is on the north side of an axis of strong northwesterly flow. Note that this northwesterly jet is analyzed as split flow where part wraps around cyclone and part flows nearly due south. Air in this southward branch is also subsiding (sinking) to some degree.
At the point where the subsiding northwesterly flow spreads out in east and west directions (and also eventually cuts underneath moisture associated with subtropical jet), we can mark a deformation zone in green. This zone nicely aligns with the darkened filaments. The letter c denotes the "col" or neutral point.
Another deformation zone can be analyzed at the head of the strong flow that wraps around to the north and west of the vorticity maximum - as this wrap around encounters the background westerly flow, some of the flow will deform and stretch along the green axis.
A third deformation zone is evident as the some of the southwesterly flow coming just east of the cyclone wraps around to the west while the other portion begins to flow more easterly. The col is analyzed at the neutral point where the flow splits to west and east. This is a good real-world example of the warm conveyor belt animation that we watched in the deformation zone introduction!
We will try one more example before moving to the larger domain case in the lab.
Question 2 of 2


| Tool: | Tool Size: | Color: |
|---|---|---|
Again, we have a case with a pronounced cyclone/vorticity max near the center of the image. Strong northwesterly flow is splitting and wrapping around the cyclone while some is visibly turning the opposite direction (and subsiding to some degree). A green line denotes the deformation zone where the northwesterly flow stretches along a SSW-NNE axis. This lines up well with the dark filament in that location, and is trackable for many frames of the loop.
The main southerly flow that comes into the cyclone helps create two more deformation zones - one where the southerly flow splits between wrapping around the cyclone or heading to northeast (just like in the warm conveyor belt animation!), and another zone can be noted at the head of the wrap-around flow where the easterly winds meet the westerly background flow.
Finally, the northwesterly flow at the top of the image makes a classic deformation pattern as it nears the split of southerly flow into the cyclone. Another branch of strong northwesterly winds can be seen creating a deformation zone as some of the flow slowly subsides and spreads eastward and westward (note darkening and widening of red filament there in loop).