Pre-Lab: Identifying Vorticity Centers » Vorticity Minima Identification Practice
Now we will practice identifying both vorticity maxima and minima. Watch the loop in the first tab below. In the second tab, analyze the locations of the main vorticity maxima with a red dot and the main vorticity minima with a blue dot. Draw in a single axis of maximum winds using the yellow pen. Compare your answers to the solution by clicking “done”.
Question 1 of 2

| Tool: | Tool Size: | Color: |
|---|---|---|
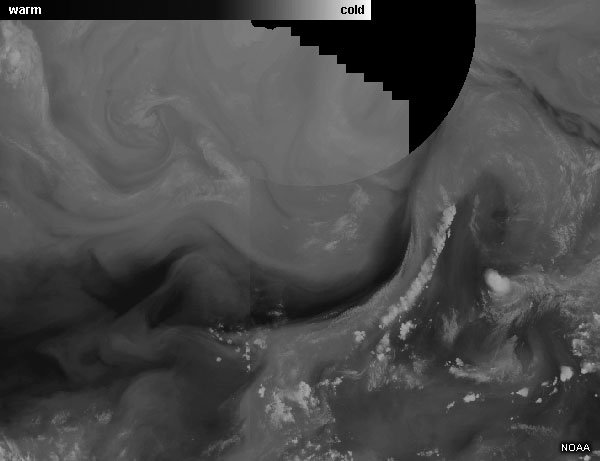
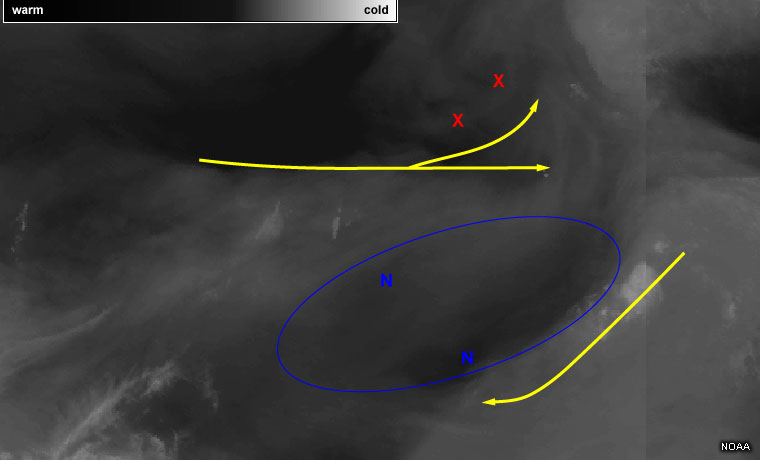
There are a lot of waves and weak vorticity maxima that could be analyzed in this loop. For our purposes, the main vorticity maximum is noted with the red X. The main vorticity minimum is noted with the blue N, and lies to the south of where the main jet begins to curve anticyclonically.
Let's try one more example. Analyze the vorticity centers and major axes of winds in the tabs below.
Question 2 of 2
| Tool: | Tool Size: | Color: |
|---|---|---|
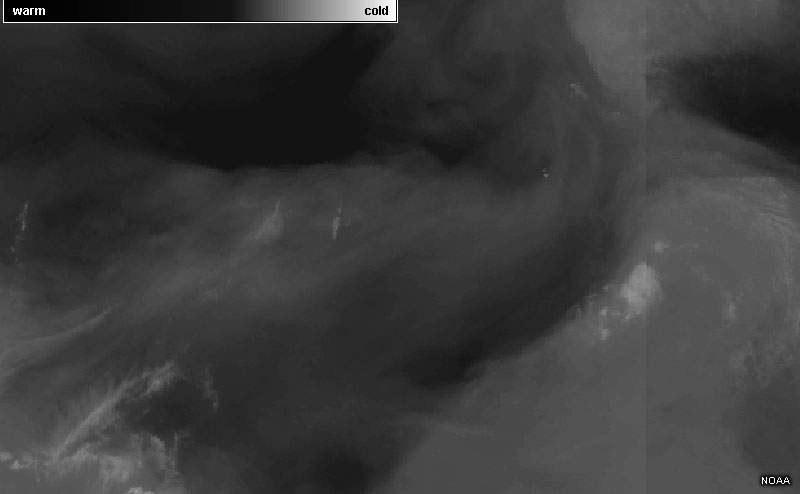
This case has a readily identifiable axis of maximum winds that is nearly zonal in the northern half of the image. There are a couple weak vorticity maxima along the northern side where cyclonic motion can be detected with the darker pulses.
The vorticity minima are noted with blue Ns. One could subjectively place the maxima at one of several locations where anticyclonic motion is most notable within the very broad clockwise flow (blue outline).
Now that you've had some practice with identifying vorticity centers and maximum wind axes, we will look briefly at how to identify the deformation zones around them using water vapor imagery.