Pre-Lab: Identifying Vorticity Centers » Vorticity Maxima Identification Practice
Next, we will practice identifying these types of vorticity maxima ourselves. Watch the satellite animation in the first tab below. Then in the second tab, analyze the location(s) of vorticity maxima by drawing a red dot over their centers (using a large pen size and clicking once will create a dot). Draw along major axis(es) of winds using the yellow pen. Give analyzing our next topic, vorticity minima, a try here if you like - draw a blue dot over anticyclonic circulation centers you note. Click done to compare your analysis to the solution.
Question 1 of 2

| Tool: | Tool Size: | Color: |
|---|---|---|
Here we have analyzed the most prominent vorticity maxima and axes of maximum winds. While watching the loop one can note the strong northwesterly (and lower altitude) flow that wraps into and around the vorticity maximum in the center of the image. The larger scale pattern to the east shows another axis of maximum winds, and a separate weaker and wider vorticity maximum.
Let's try another example. Follow the same process as in the previous question and check your analysis by clicking “done”.
Question 2 of 2


| Tool: | Tool Size: | Color: |
|---|---|---|
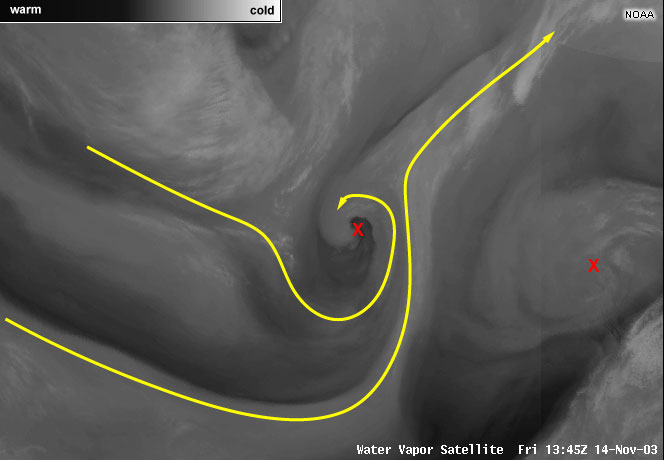
Again, we have strong northwesterly flow at mid-levels coming into a strong vorticity maximum in the center of the image. The brighter white region at the far west in image appears to be moving more directly to east than the main wind axis that is drawn in that location - one must remember that water vapor imagery shows many levels. The bright white is upper level moisture associated with air coming over the Rockies and is slightly higher in altitude than the northwesterly wind max.
Another main axis of winds lies in the southwesterly flow at bottom right of the image and is associated with the subtropical jet. Careful analysis reveals several other small-scale vorticity maxima in a chain along the axis of maximum winds coming into the cyclone at center, as well as two vorticity minima where there is anticyclonic motion.
Next we will look at the counterpart of vorticity maxima - the anticyclonic vorticity minima. They really are counterparts - where there is an axis of maximum winds, there must be a vort max on one side and a vort min on the other side somewhere along the line. Their strength, however, varies greatly upon scale and hemisphere, and orientation of shear and/or nearby circulation centers.