Interpreting Results: MARFC

The MARFC case also demonstrated that QPF improves hydrologic forecasts. In this case those are ensemble, or probabilistic flow forecasts. Once again it is important to examine a variety of verification scores and plots to understand the nature of the errors in forecast performance. In addition, it is important to evaluate characteristics of the data itself to gain useful perspective about what the verification scores might show. For example, box plots can provide useful information about whether there is appropriate distribution and spread in the ensemble forecasts of both the final flow forecast as well as the input QPF. Lack of spread and/or skewed distribution of forecast ensembles will impact the verification scores.
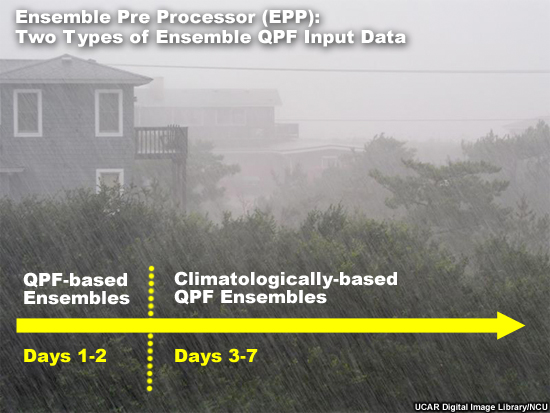
Although the case reviews error scores of ensemble means, that is just an overview of forecast performance with respect to lead time. The real important information explores the impact of switching from QPF-based ensembles to climatological QPF after 48 hours. The case also explore whether there are important difference between a headwater point and a downstream point. And finally, the case examines the difference in forecast performance between a high flows subset and all flows taken together. To get at some of the answers the case looks at measures of error, or how well calibrated the forecast system is. In addition, we reviewed measures of forecast skill, forecast reliability, forecast discrimination, and forecast confidence.

Without examining multiple verification measures, a user may have concluded that the high flow forecasts are simply more erroneous than the full data set. They are when using just measures of mean error and MCRPS. But more careful examination suggests that when compared to all flows, there is greater improvement in the high flows subset as seen in forecast skill, reliability, and discrimination. There is a very significant difference in many of the scores when switching from QPF-based ensembles to climatologically-based QPF. When we examined box plot of the QPF input, it was seen that the climatologically-based QPF suffered from lack of spread and a conditional bias (too low on big events and too high on light events). The impact from that is seen in many of the scores. Finally, the impact of QPF and then climatological QPF occur more quickly at the headwater point than at the downstream point.
So with all of this information, the user can learn more than just how quickly the forecast performance degrade with lead time as measured by simple errors statistics of the ensemble mean. Here we showed how one can obtain details of the types of errors, when and why forecast performance changes most rapidly, how different forecast points react relative to each other, and how a high flow subset may show different trends than all flows taken together. With that information important adjustments and improvements to the forecasts are possible.