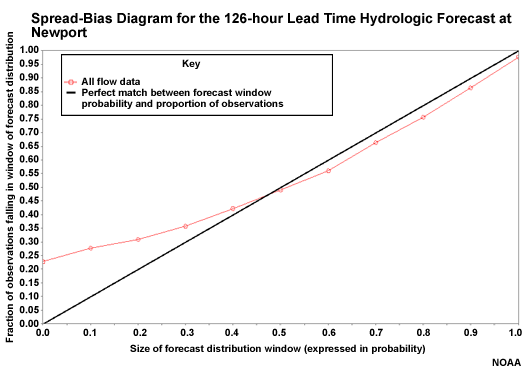
Spread-bias Diagram: Lead Hour 126
At 126 hours the spread-bias plot shows better forecast reliability, although with overforecasting on the low end.
So overall, these spread-bias diagrams indicated increasing reliability with lead time. This may seem contrary to what we looked at with the reliability component of MCRPS. But remember that these spread-bias diagrams use all data and don't isolate the top 20%. The MCRPS reliability component showed us that forecast reliability decreases at longer lead times when considering the high QPF or the high flow forecasts.
