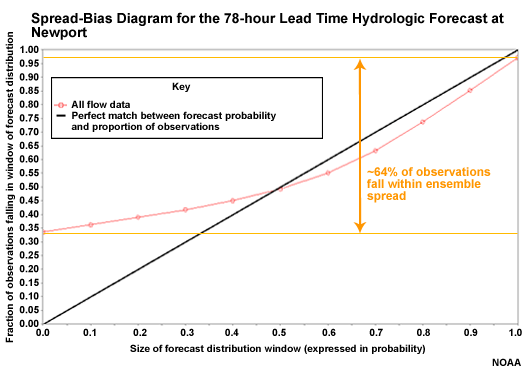
Spread-bias Diagram: Lead Hour 78
At 78 hours there is better spread with roughly 64% of observations within the ensemble spread. The curve is closer to the diagonal on the high end showing better forecast reliability. But there is still significant overforecasting on the low end.
