Observations Outside the Forecast Distribution
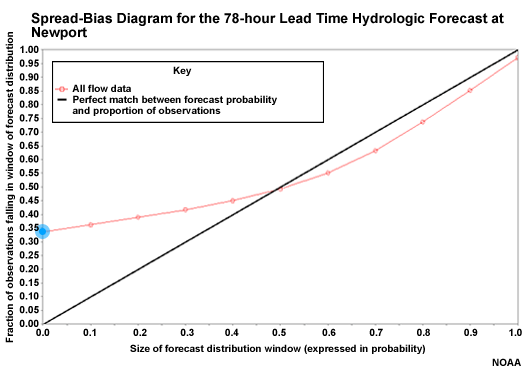
Over here we see a point that corresponds to the 0 on the X axis and 33% of observations on the Y axis. This means that 33% of observations occurred completely below the forecast distribution. So the forecast ensembles were so high that they missed 1/3 of the observations.
