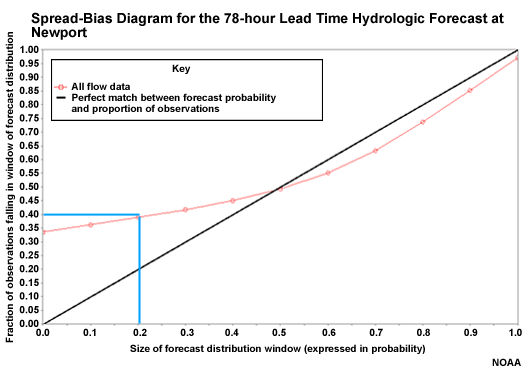
Overforecasting on the Spread-bias Diagram
In this case 40% of observations fall in the lowest 20% of the ensemble forecast distribution. This is over-forecasting, because too many observations are falling in the lower 20% of forecasts. That means that the ensemble forecast distribution would need to have lower members to capture the observations more reliably.
