Headwater Forecast Reliability
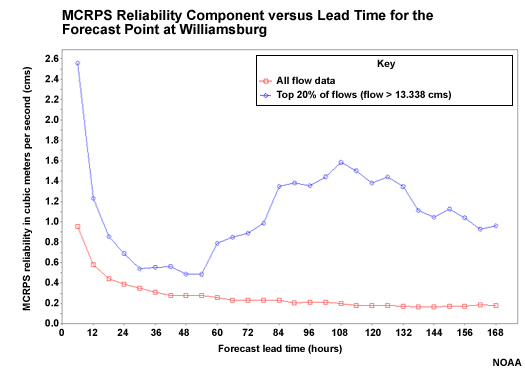
Smaller numbers are indicative of good forecast reliability. In these plots we see differences in the trends with respect to lead time when all magnitudes of flow forecasts are considered (red line) compared to when just the top 20% of flow forecasts are considered (blue line).
If we look at the headwater point, Williamsburg, when all flow forecasts are considered, we see that the worst reliability (highest value) is the first six hours. The best reliability (lower values) is the longer lead time period.
But when examining the top 20% of flows, we see a different trend. The best forecast reliability is in the 24-48 hour lead time when QPF has an influence. The reliability gets worse after that. This indicates that the big flow events, probably caused by big precipitation events, are not captured well when climatologically-derived QPF is used as input. So QPF input makes the hydrologic forecasts more reliable.
