MCRPS of Flow Forecasts
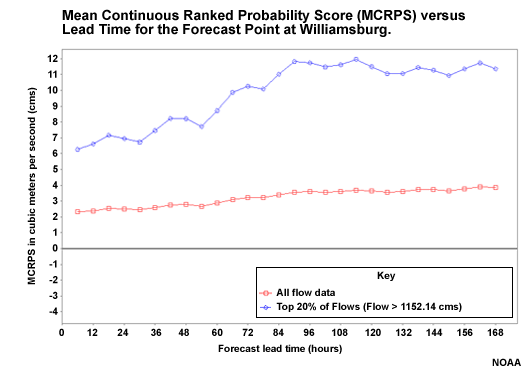
So now we know that the probabilistic QPF performs better at lead times of 48 hours or less, and least favorably for long lead times of 72 hours and greater. Let's look at the hydrologic forecasts resulting from the QPF input. This plot is for all flows (red) and for the upper 20% of flows (blue) at the Williamsburg headwater point where the contributions from reservoir operations and tributary flows are minimal.
Note that the high flow forecasts have greater MCRPS values, especially after 72 hours when the climatologically- generated QPF has influence. So just like the QPF input, the forecast performance is better for lead times of 48 hours or less least favorable after 72 hours.
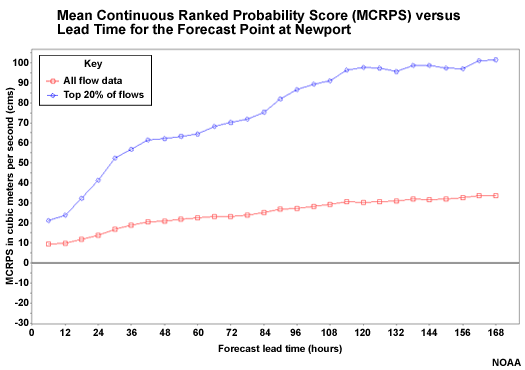
The MCRPS plot for Newport shows flows that are influenced more by reservoirs and tributary inputs, but it still shows worse scores with increasing lead time.

