Mean Continuous Ranked Probability Score (MCRPS)
The mean continuous ranked probability score (MCRPS) is a measure of the "error" in probabilistic forecasts. Measuring error in probabilistic forecasts is really measuring how well calibrated the forecast system is. We want to measure how well forecast probabilities match observed frequencies of a given event. In other words, for every time a forecast was for a 60% chance of an event, was the event observed 60% of the time. That would be a perfectly calibrated forecast system. As with the error scores used with deterministic forecasts, low values indicate better matching between forecasts and observations.
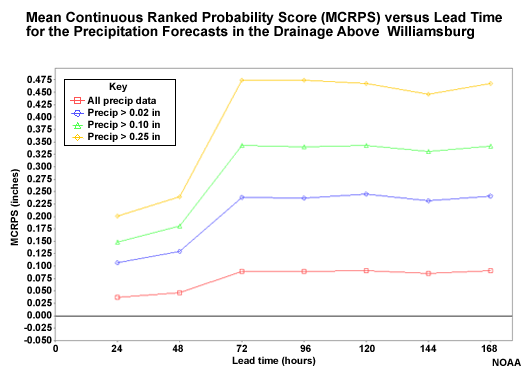
The MCRPS for the probabilistic QPF with respect to lead time is shown here. The probabilistic QPF is the mean areal value for the 754 square kilometer basin area above Williamsburg.
The red line shows all forecasts including the zero QPF forecasts. The other lines show successively higher precipitation thresholds.

Question
Where does the MCRPS indicate worse QPF forecast performance (higher MCRPS values)? (Choose all that apply.)
The correct answers are a and d.
The highest threshold shows the least favorable scores. But remember that these are not measures of relative error. So we should expect the higher precipitation thresholds to have greater absolute errors and thus higher MCRPS scores. Perhaps the most important information in this plot is how the score trends with lead time. The performance of the probabilistic QPF gets worse at 72 hours when the climatologically-based QPF becomes more influential.