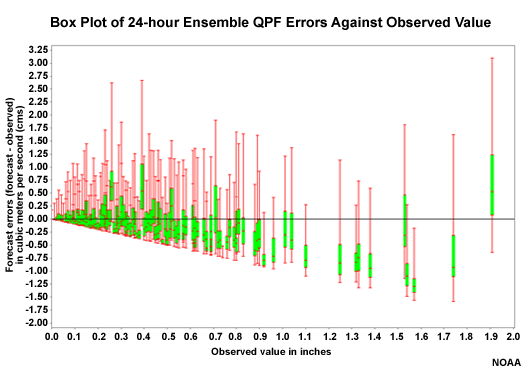
QPF Box Plots � 24 Hour Lead
If QPF input is having a strong influence on the hydrologic flow forecasts, we may expect to see a pattern of spread and bias in the QPF ensembles similar to those of the flow forecasts that we just examined. Here we can see the spread in QPF ensemble members often straddles the zero line, meaning the forecast ensemble included the actual value. For the high QPF values, there is a tendency for a low bias and for the spread, especially the middle 50% seen in the green segment, to be too low. This is similar to the forecast tendencies seen in the ensemble flow box plots at 30 and 78 hour lead times.
