Downstream vs. Headwater: 30 Hour Lead
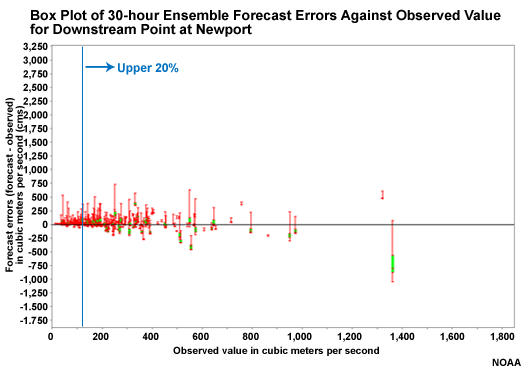
So now let's look at 30-hour lead time box plots for the downstream point at Newport and compare it to the 30-hour box plot for the upstream point at Williamsburg.


Question
How do the boxplots for downstream point (Newport) compare to those at the upstream point (Williamsburg) at 30 hours? (Choose the best answer.)
The correct answer is c.
Because it takes longer for QPF input to impact the downstream point, there is less spread in the hydrologic forecast ensembles there.