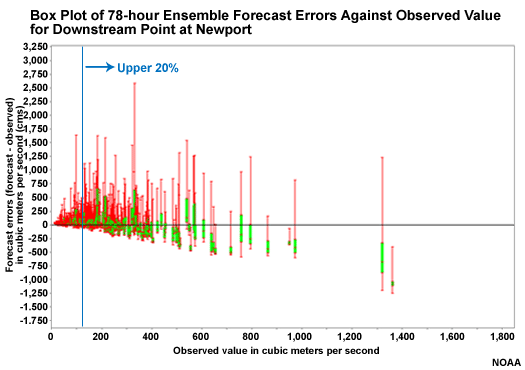
Downstream vs. Headwater � 78 Hour Lead
Now let's compare the 78-hour lead time box plots for the downstream point and the headwater point.


Question
Which point shows a more favorable distribution of forecast ensembles for the upper 20% of values? (Choose the best answer.)
The correct answer is b.
The underrepresentation of high flow values in the hydrologic ensembles occurs more quickly at the headwater point. The switch from QPF-based input to climatologically-based QPF input at 60 hours has an impact more quickly on the upstream point resulting in smaller spread and an underforecast bias. This will happen at the downstream point too, but not until later.
So the downstream point behaves similarly to the upstream point, but the timing is different. Both upstream and downstream had poor ensemble spread at 6 hours before QPF had an impact. By 30 hours the impact of QPF results in more spread in the hydrologic forecast ensembles and the observations are better captured by the ensemble forecast members. This is more obvious at the headwater point, which responds more quickly to QPF input. At longer lead times the impact of climatologically-generated QPF is dominant and we see an underspread of ensembles, with an overforecast bias at low values and an underforecast bias at high values. This occurs more quickly at the headwater point than at the downstream point.