EVS Box Plots
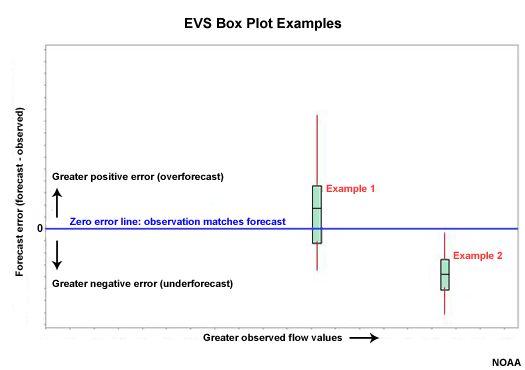
In EVS the box plots can be plotted with the observed value, flow in this case, on the X axis and the forecast error (forecast minus observed) on the Y axis. The zero line on the Y axis is where the observation matches the forecast.
In box plot 1, the zero error line falls within the middle 50% of ensemble forecast values for observation 1, which should occur 50% of the time in a perfectly calibrated forecast system. The median value and the extreme are a little skewed in the direction of positive error, or overforecasting. But we cannot say there is an overforecasting problem with just one box plot.
In box plot 2, the ensemble forecast spread associated with observation 2 is completely below the zero error line. All of the ensemble members were too low indicating an underforecast. In other words, the observation was greater than any ensemble forecast member.
Remember that in a well-calibrated forecast system the green section of the box plot should intersect the zero line 50% of the time, and the upper and lower red lines should each intersect the zero line 25% of the time. The distribution, green and red sections, should never lie completely above or below the zero line.
We will look at box plots for forecast lead times of 6, 30, 78, and 126 hours.
