Ensemble Spread: Box Plots
Box plots are used to evaluate two important aspects of the relationship between the observations and forecasts: (1) whether there is appropriate distribution and spread in the ensemble forecasts, and (2) whether there is bias in the forecast.
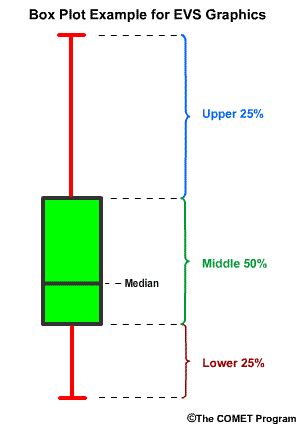
The box plots are constructed so that the green represents 50% of the forecast members between the 0.75 and 0.25 exceedance thresholds. The red lines represent the highest and lowest 25% of forecast values including the extrema.