RMSE of QPF Input
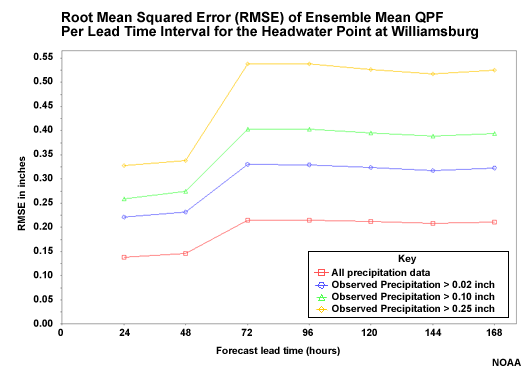
Here is the RMSE of the ensemble QPF input for the area represented by the Williamsburg point. There are four categories. The red line is all data, including forecasts of zero precipitation. The blue line is for days when the Mean Areal Precipitation (MAP) was observed to be greater than 0.02 inch, or 0.5 mm. The green line is for MAP greater than 0.10 inch (2.5 mm). And the yellow line is for MAP greater than 0.25 inch, or 6.4 mm. The 0.02, 0.10, and 0.25-inch thresholds correspond to the 63rd, 76th, and 86th percentiles respectively for this drainage.

Question
What are some features of the relationship between the different thresholds? (Choose all that apply.)
The correct answers are a and c.
Question
Why would the errors increase most rapidly from 48 to 72 hours? (Choose the best answer.)
The correct answer is d.
The mean of the ensemble QPF shows greater error with the higher precipitation categories. It also shows that the error increases most rapidly from 48 to 72 hours. This is when the QPF-based ensembles are replaced with the climatologically-based QPF input.