ROC Score: QPF
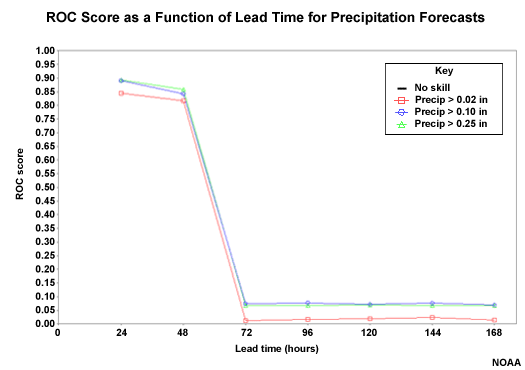
The ROC Score uses the area under the ROC curve in the following formula: ROC Score = (2*ROC Area) � 1. The ROC Score ranges from -1 to +1. Positive numbers show good forecast discrimination. Zero indicates no forecast discrimination. Negative scores indicate negative forecast discrimination. Thus +1 is optimal.
Here we see that there is good forecast discrimination through 48 hours. The ROC area drops to almost 0.00 when the climatologically-generated QPF is used.

Question
Which precipitation threshold shows better forecast discrimination (greater ROC score)? (Choose the best answer.)
The correct answer is a.
The greater precipitation threshold is associated with better forecast discrimination. This is an opposite trend compared to forecast reliability, which was best for smaller amounts and long lead times. The same trend exists for the flow forecasts. Better forecast discrimination occurs with the high flow thresholds and the shorter lead times. The QPF input is likely a major factor in that trend.