Forecast Skill and Lead Time
As shown earlier, errors start to increase notably, and correlation decreases when forecast lead times are greater than 60 hours. This occurs sooner in the small, fast response basins.
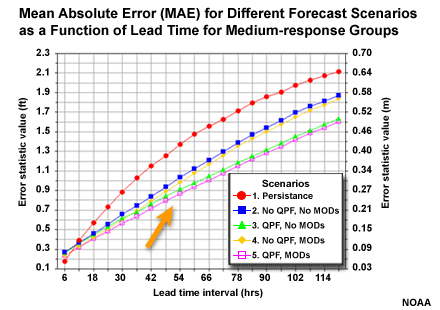
But is skill also decreasing with lead time? Remember that a forecast is skillful if it performs better than a reference forecast. The reference can be persistence, depicted by the red line. It can also be forecasts without QPF, depicted with the blue and yellow lines.
In the MAE plots note the separation between the lines for different forecast scenarios. Notice how the separation gets greater with longer lead times. The two scenarios with QPF in the hydro forecast, the pink and green lines in the graphic, have more slowly increasing errors with lead time. The separation in the lines shows that the two stage forecasts with QPF show increasing skill with lead time when compared to the two forecasts without QPF, or with the persistence forecast.
This indicates that although the QPF was mainly for 24 hours only, it is having a positive impact many hours later.
