Correlation: Short vs. Long Lead Time
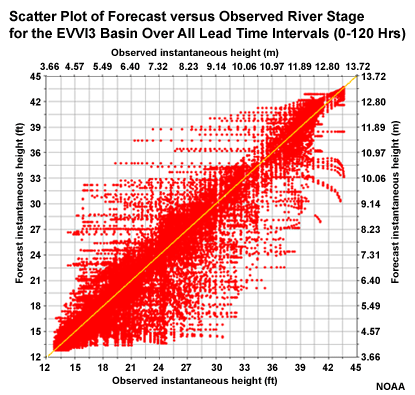
Let's look at the scatter plot again for all forecast lead times at EVVI3.

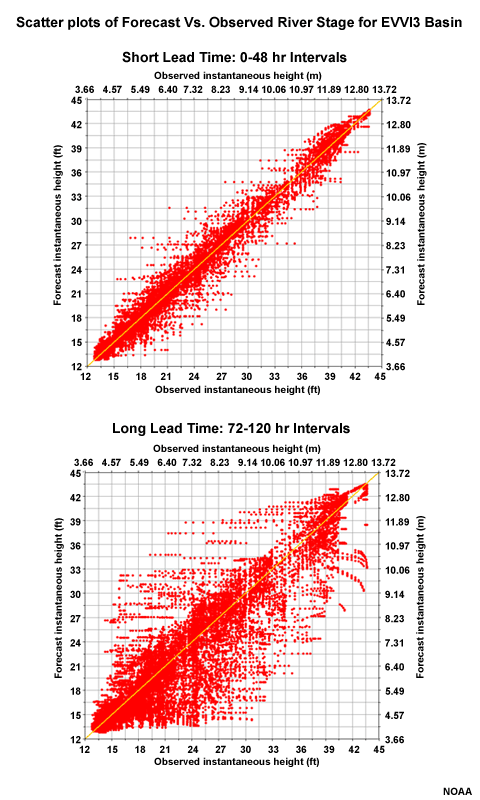
Now let's look at two more scatter plots for this location, but one only includes forecast lead time <= 48 hours, and the second includes only lead time of >= 72 hours.

Question
Compared to the >= 72 hours lead time forecast, the <= 48 hours lead time forecasts show _____. (Choose all that apply.)
The correct answers are c and d.
With lead times of 48 hours or less, there is much better correlation between forecasts and observations. This is seen as less scatter about the diagonal in the scatter plots.