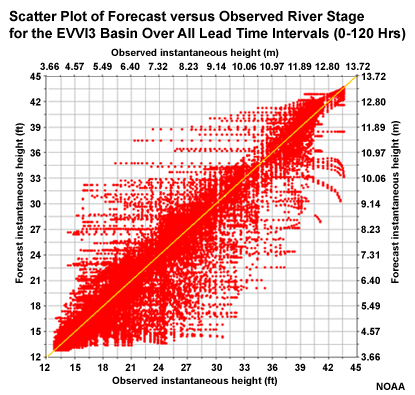
Correlation Over All Lead Times
If we choose just one basin over all lead times, in this case EVVI3, we still see quite a bit of scatter around the diagonal, although not as much as when all basins are considered together.

In the previous section we noted that errors begin to increase most notably by the 48-hour lead for the fast-response basins and at forecast lead times longer than 60 hours for the slow-response basin. It would be informative to look at the scatter plot depiction of forecast correlation for short and long lead times.