Correlation and Lead Time
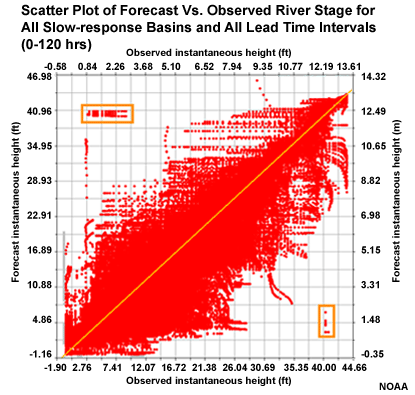
Let's look at how well the forecasts and observations of stage height are correlated. This scatter plot shows a large amount of scatter around the diagonal indicating less than ideal correlation between forecasts and observations.
This scatter plot contains all six basins and all leads times for the slow response basins in one plot. We can even see the outlier events from one basin that was discussed earlier.
