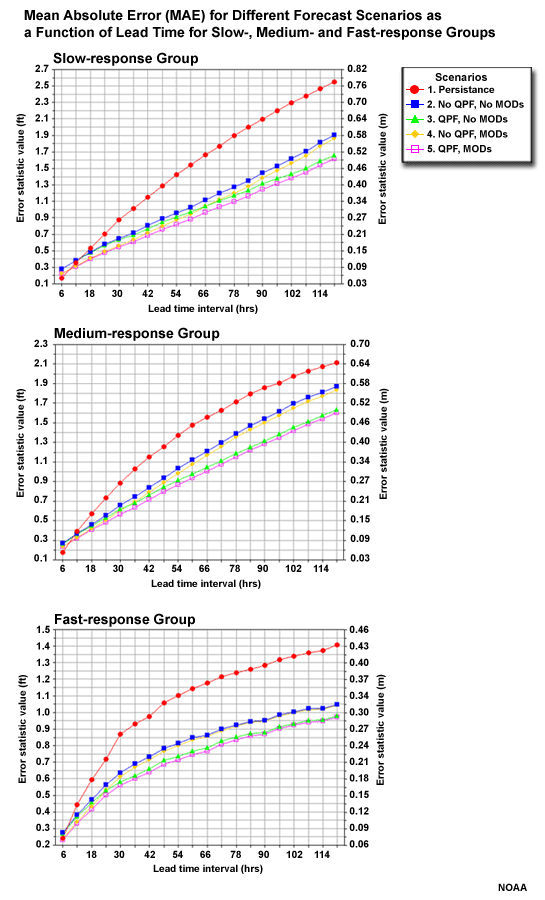
MAE for Forecast Scenarios
Let's begin by evaluating the overall performance of the different basin groups as measured by Mean Absolute Error (MAE). The different forecast scenarios are shown for each basin group.
The MAE shows increasing error with increasing lead time for all groups and scenarios. With the slow-response group, the increase in error is nearly linear. With the fast-response group, the increase in error is most rapid in the early lead time periods.

Question
For all three basin groups, which forecast scenario has the greatest error? (Choose the best answer.)
The correct answer is a.
Question
Which two forecasts have the lowest error? (Choose all that apply.)
The correct answers are c and e.
So when we look at all stage height forecast for all basins in each aggregation group, we see persistence is the worst forecast. But we also see that the two forecasts with QPF input are the best, as measured by MAE.
- Persistence is the worst forecast
- The two scenarios with QPF performed the best as measured by MAE