Forecast Verification: Errors and Bias
After the determination is made that the data grouping�in this case the basin aggregation�is appropriate, the next step is to determine how the QPF impacts hydrologic forecasts of stage height. Recall from the opening page of this section that our verification technique is designed to foster understanding about the impact of QPF by allowing us to evaluate the following:
- Characteristics of errors and bias for different forecast scenarios
- Correlation between forecasts and observations
- Forecast skill for different forecast scenarios
- Impact of lead time on error, correlation, and skill
- Sources of forecast error
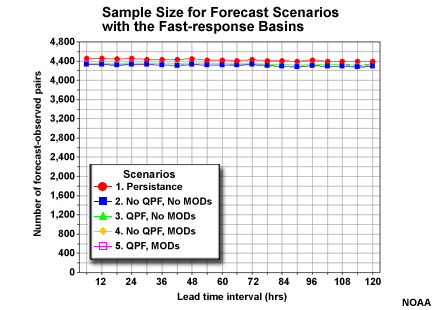
As mentioned earlier, the sample for each basin group is roughly 4,400. This number is consistent across all forecast scenarios and lead times as shown in this graphics of the fast-response basin group. The numbers are almost identical for the medium- and slow-response groups.