Compare Fast- and Slow-response Bias
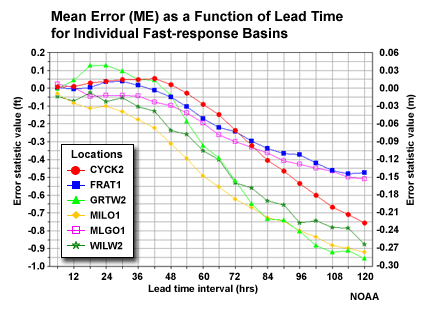
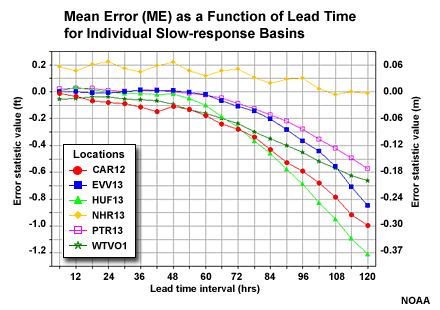
Now that we have quickly assessed that the basins within each group make sense, we should ask if the separate groups make sense too. Compare the mean error tendency with lead time for the fast response and slow response groups.


Question
If we look at the magnitude of the negative mean error in the 48-72 hr lead times, is there a difference in the trend of the error? (Choose the best answer.)
The correct answer is c.
The fast-response basins are showing increasing negative mean error (underestimating stage height) for 48 to 60-hr lead time. The slow response basins show the increase in negative mean error mainly after the 60-hr lead time. The difference between aggregated groups supports the approach of aggregating the basins based on similar response-time characteristics.