Media elements used in this module are protected by a variety of copyright licenses. Please use the "copyright terms" link associated with each item below for more information.
Description:
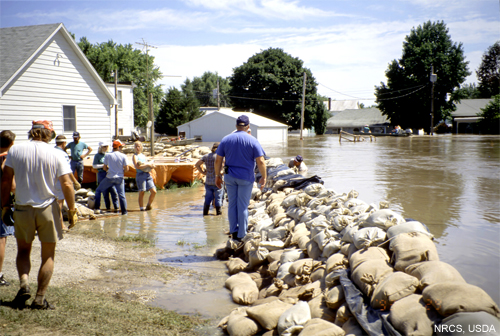
People working on sandbag dikes after flood.
File Name:
1993-hartsburg_5.jpg
Credits:
NRCS, USDA
Copyright Terms:
COMET Standard Terms
of Use
Description:
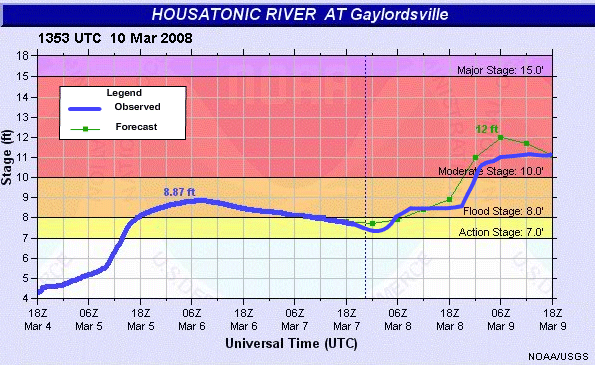
Forecast and observed flood stage for Housatonic River at Gaylordsville, 7 March, 2008 1800 UTC and 12 March 2008 1200 UTC.
File Name:
7mar08_18z-10mar08_12z_housatonicCT_hg.gif
Credits:
NOAA/USGS
Copyright Terms:
COMET Standard Terms
of Use
Description:
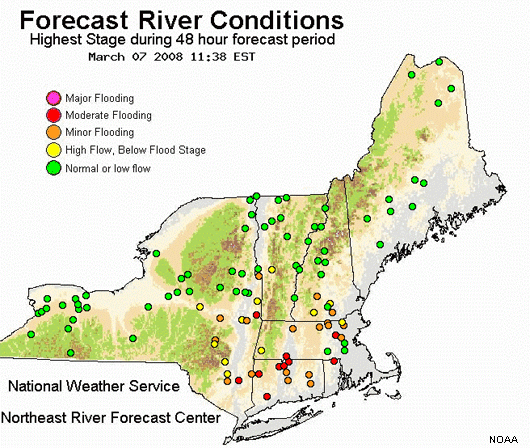
Forecast River Conditions, Northeast River Forecast Center, 07 March, 2008
File Name:
7mar08_NERFC.gif
Credits:
NOAA
Copyright Terms:
COMET Standard Terms
of Use
Description:
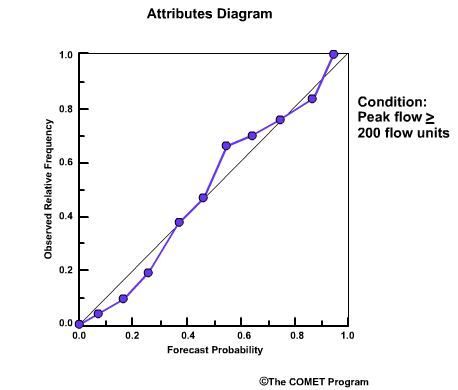
Example of attributes diagram used in forecast verification
File Name:
Attributes_diag_1.gif
Credits:
COMET
Copyright Terms:
COMET Standard Terms
of Use
Description:
Barge being loaded.
File Name:
barge_4.jpg
Credits:
NRCS, USDA
Copyright Terms:
COMET Standard Terms
of Use
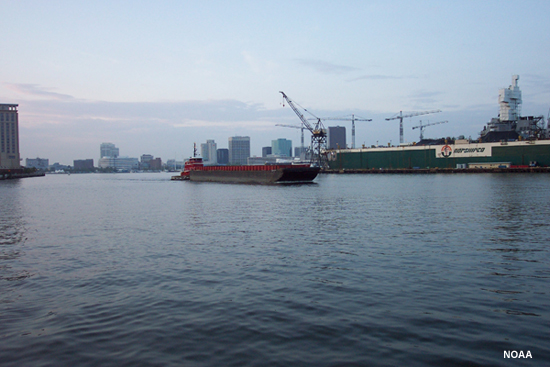
Description:
Tug pushing barge down the Elizabeth River with Norfolk skyline and shipyard in picture.
File Name:
barge_elizabeth_river.jpg
Credits:
NOAA
Copyright Terms:
COMET Standard Terms
of Use
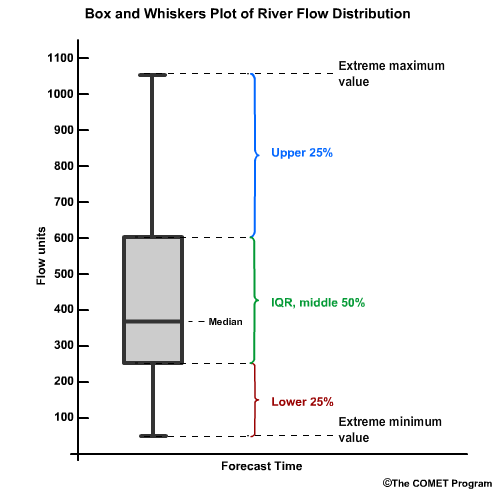
Description:
This depicts a box and whiskers plot that corresponds with our IQR graph of river flows.
File Name:
box_whiskers_river.gif
Credits:
COMET
Copyright Terms:
COMET Standard Terms
of Use
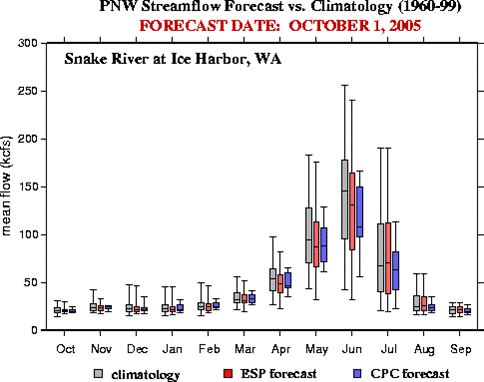
Description:
Box and whiskers plot for forecasts versus climatology of snowmelt-induced streamflow on the Snake River is Ice Harbor, WA.
File Name:
box-whiskers_sample.gif
Credits:
NOAA
Copyright Terms:
COMET Standard Terms
of Use
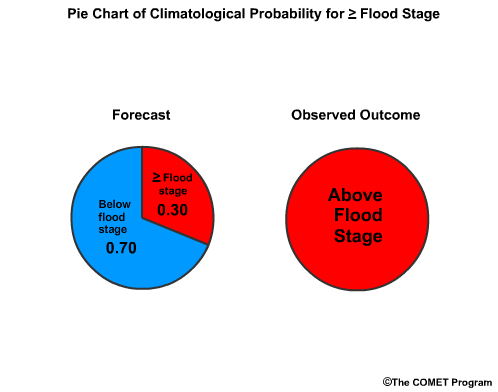
Description:
Pie chart for Climatology of flood forecast used in Brier Score
File Name:
BS_climo.gif
Credits:
COMET
Copyright Terms:
COMET Standard Terms
of Use
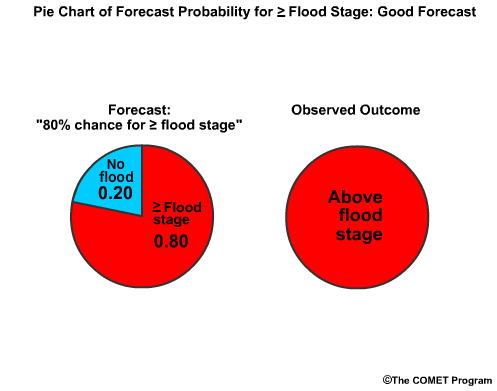
Description:
Pie chart depiction of how the Brier Score would be used in verification of flood stage.
File Name:
BS_example1.gif
Credits:
COMET
Copyright Terms:
COMET Standard Terms
of Use
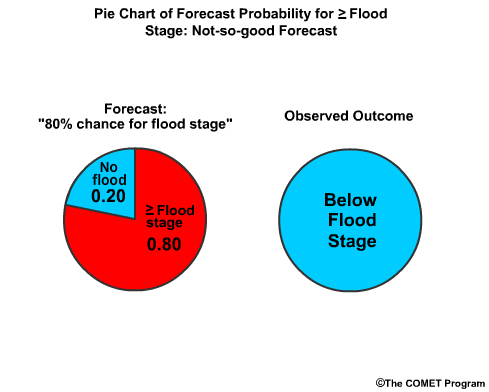
Description:
Another pie chart depiction of how the Brier Score would be used in verification of flood stage.
File Name:
BS_example2.gif
Credits:
COMET
Copyright Terms:
COMET Standard Terms
of Use
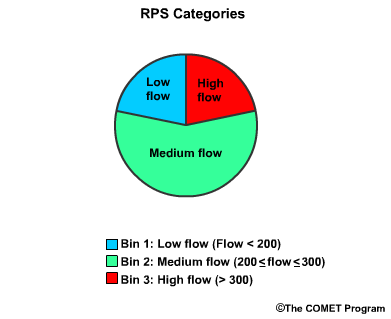
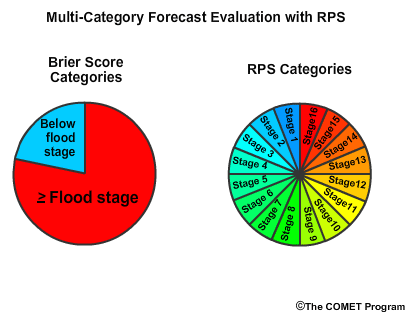
Description:
Pie chart showing how we may go from a binary forecast system (two categories) to multiple categories and therefor use the RPS verification method instead of the Brier Score.
File Name:
BS_RPS_piechart.gif
Credits:
COMET
Copyright Terms:
COMET Standard Terms
of Use

Description:
This shows the Cumulative Distribution Function (CDF) for a river.
File Name:
CDF_river.gif
Credits:
COMET
Copyright Terms:
COMET Standard Terms
of Use
Description:
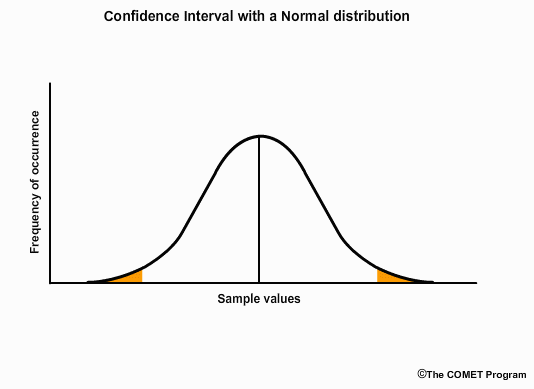
This curve shows the normal distribution of a variable.
File Name:
confidence_SD.gif
Credits:
COMET
Copyright Terms:
COMET Standard Terms
of Use
Description:
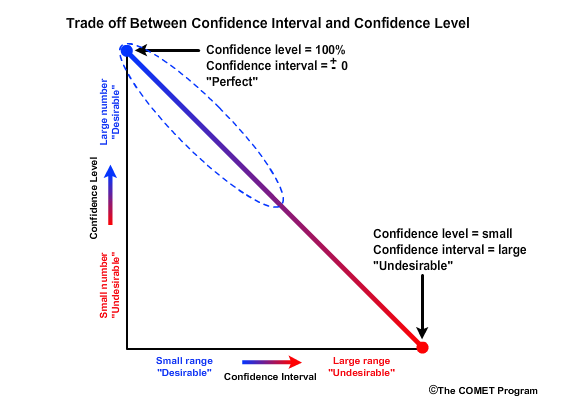
This graphic shows the trade off between confidence level and confidence interval.
File Name:
confidence_tradeoff.gif
Credits:
COMET
Copyright Terms:
COMET Standard Terms
of Use
Description:
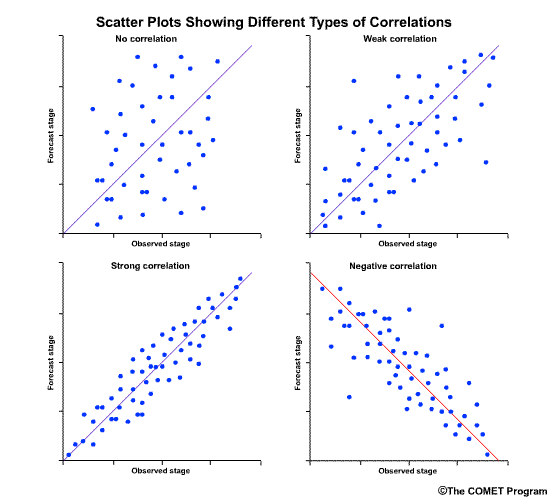
Series of scatterplots showing different types of correlation: no correlation, weak positive correlation, strong positive correlation, and strong negative correlation.
File Name:
correlation_examples_1.gif
Credits:
COMET
Copyright Terms:
COMET Standard Terms
of Use
Description:
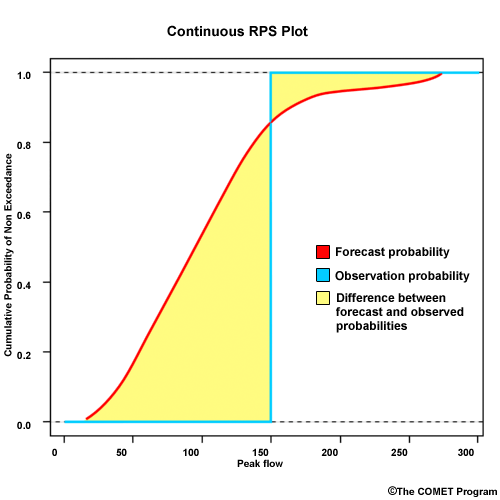
example of a plot for the Ranked Probability Score (CRPS)
File Name:
CRPS.gif
Credits:
COMET
Copyright Terms:
COMET Standard Terms
of Use
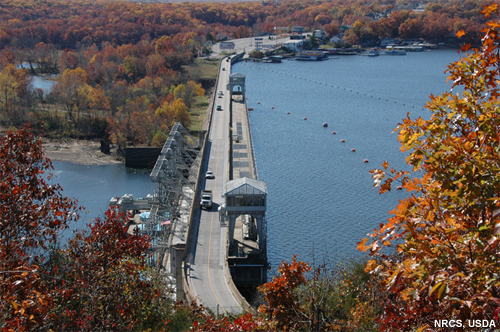
Description:
Looking down on a dam through autumn leaves.
File Name:
dam201.jpg
Credits:
NRCS, USDA
Copyright Terms:
COMET Standard Terms
of Use
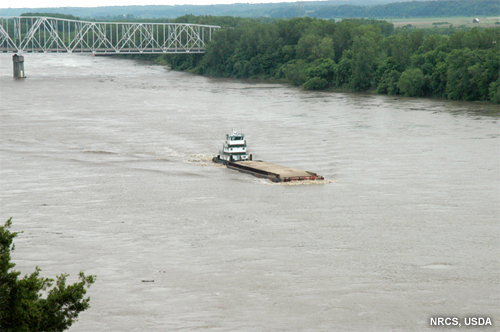
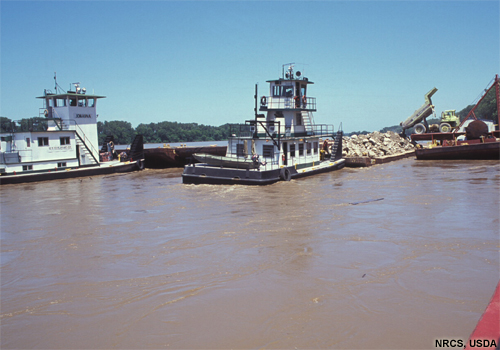
Description:
Barge on river.
File Name:
dBarge_1.jpg
Credits:
NRCS, USDA
Copyright Terms:
COMET Standard Terms
of Use
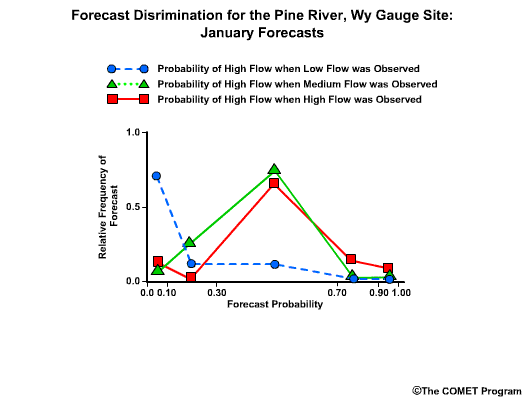
Description:
Example of forecast discrimination for Pine River, WY in January
File Name:
discrim_PineRiver_Jan.gif
Credits:
COMET
Copyright Terms:
COMET Standard Terms
of Use
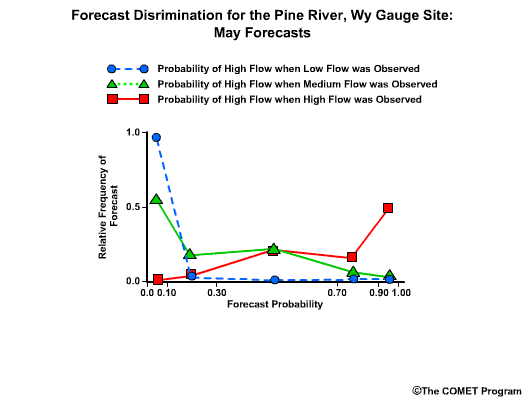
Description:
Example of forecast discrimination for Pine River, WY in May
File Name:
discrim_PineRiver_May.gif
Credits:
COMET
Copyright Terms:
COMET Standard Terms
of Use
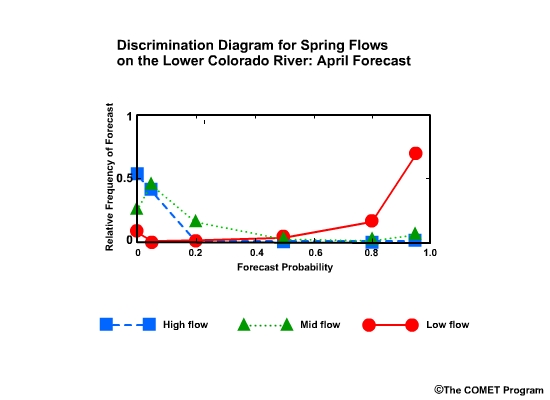
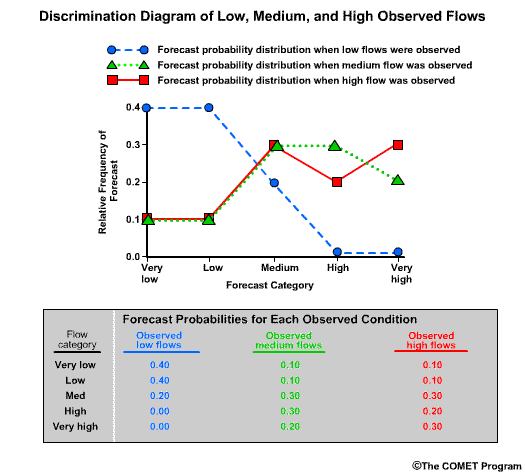
Description:
Discrimination diagram conditioned on low flows for the lower Colorado River; forecast issued in April for Spring runoff season
File Name:
discrimination_coloRiver_apr.jpg
Credits:
COMET
Copyright Terms:
COMET Standard Terms
of Use
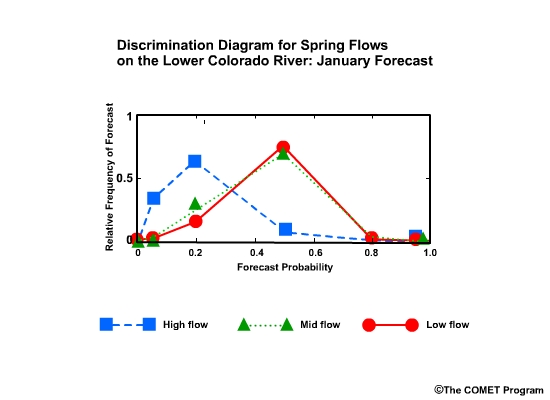
Description:
Discrimination diagram conditioned on low flows for the lower Colorado River; forecast issued in January for Spring runoff season
File Name:
discrimination_coloRiver_jan.jpg
Credits:
COMET
Copyright Terms:
COMET Standard Terms
of Use
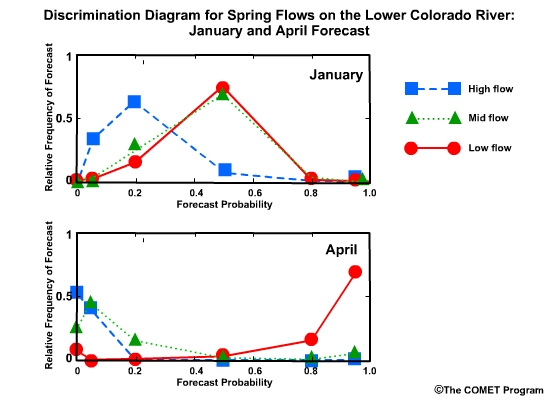
Description:
Discrimination diagrams conditioned on low flows for the lower Colorado River; forecast issued in January and April for Spring runoff season
File Name:
discrimination_coloRiver_JanApr.jpg
Credits:
COMET
Copyright Terms:
COMET Standard Terms
of Use
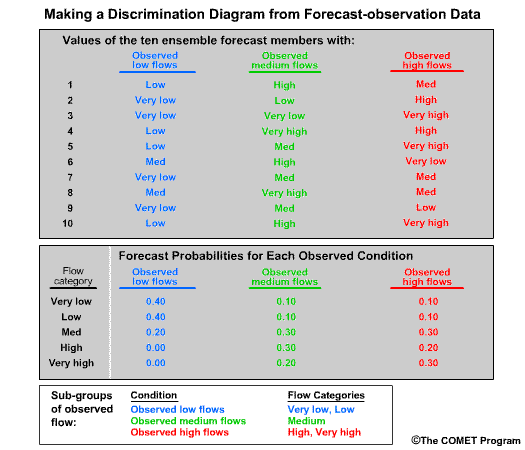
Description:
Example of how data for s discrimination diagram is derived from forecast-observations pairs.
File Name:
discrimination_diag1.gif
Credits:
COMET
Copyright Terms:
COMET Standard Terms
of Use
Description:
Building a discrimination diagram from a dataset of high-flow forecasts
File Name:
discrimination_diag2.gif
Credits:
COMET
Copyright Terms:
COMET Standard Terms
of Use
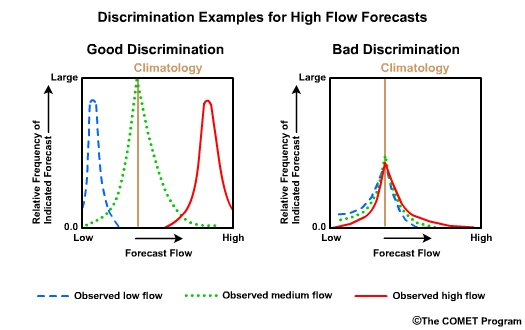
Description:
Example of discrimination diagrams showing both good verification and poor verification
File Name:
discrimination_good_bad.jpg
Credits:
COMET
Copyright Terms:
COMET Standard Terms
of Use
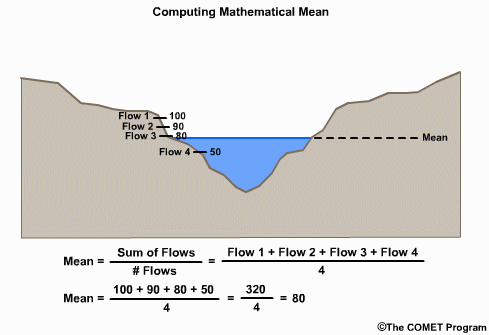
Description:
how the mean value is determined from a set of forecast-observation pairs
File Name:
dist_mean_still.gif
Credits:
COMET
Copyright Terms:
COMET Standard Terms
of Use
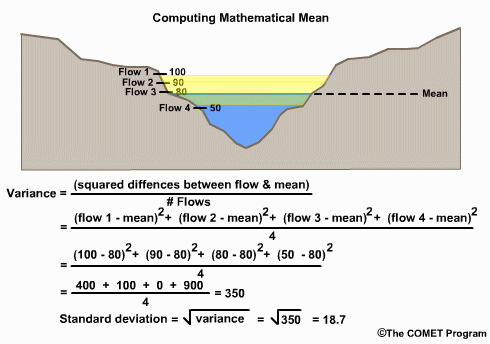
Description:
how the variance and standard deviation values are determined from a set of forecast-observation pairs
File Name:
dist_variance_still.gif
Credits:
COMET
Copyright Terms:
COMET Standard Terms
of Use
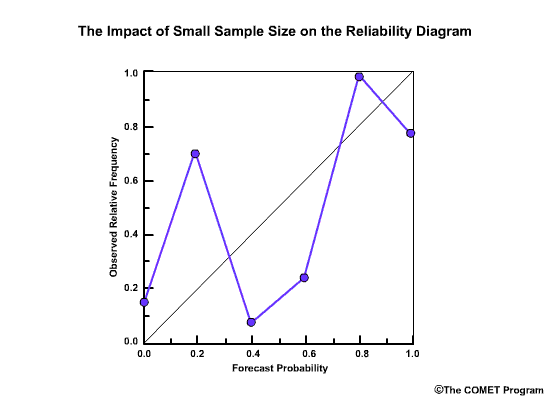
Description:
example of erratic plot on a reliability diagram due to small sample size
File Name:
erratic_reliability.gif
Credits:
COMET
Copyright Terms:
COMET Standard Terms
of Use
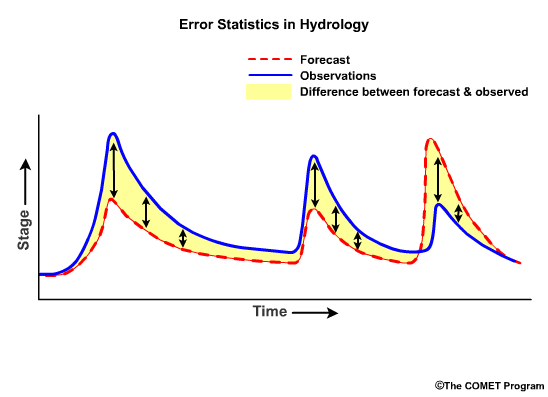
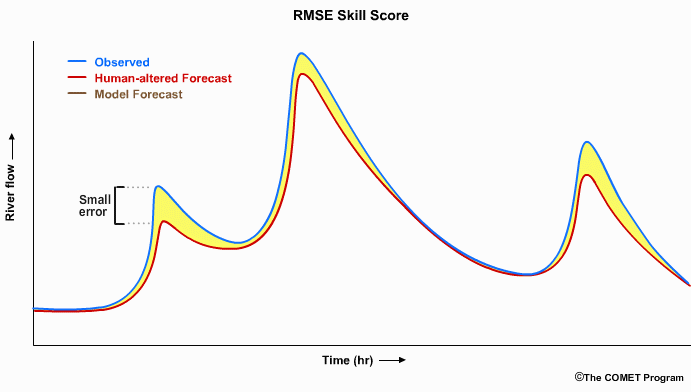
Description:
Times series simulated forecast and observed hydrograph showing how mean absolute error and root mean square error are derived.
File Name:
error_graph.gif
Credits:
COMET
Copyright Terms:
COMET Standard Terms
of Use
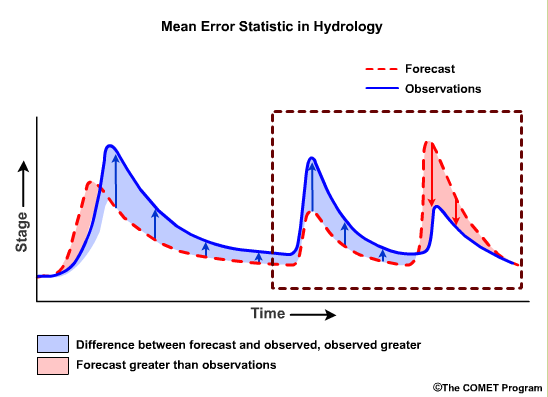
Description:
Times series of simulated forecast and observed hydrograph showing how mean error is derived.
File Name:
error_graph_me.gif
Credits:
COMET
Copyright Terms:
COMET Standard Terms
of Use
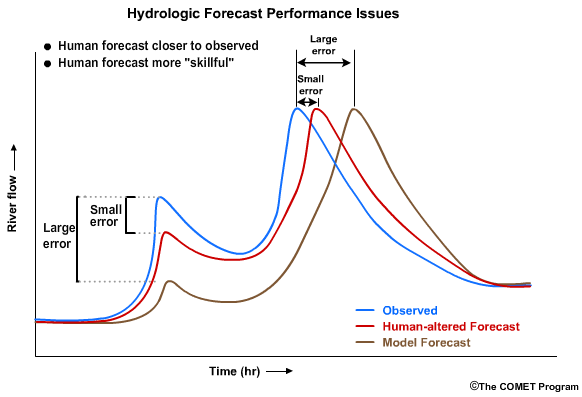
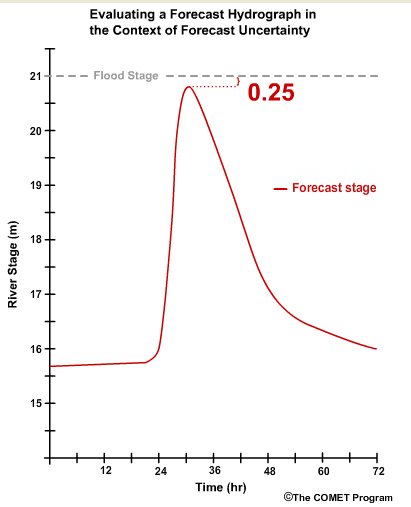
Description:
Simplified hydrograph showing what a forecaster may look for to assess how good a forecast is.
File Name:
Fcst_performance_fcstr.gif
Credits:
COMET
Copyright Terms:
COMET Standard Terms
of Use
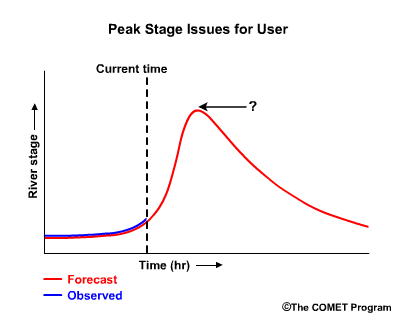
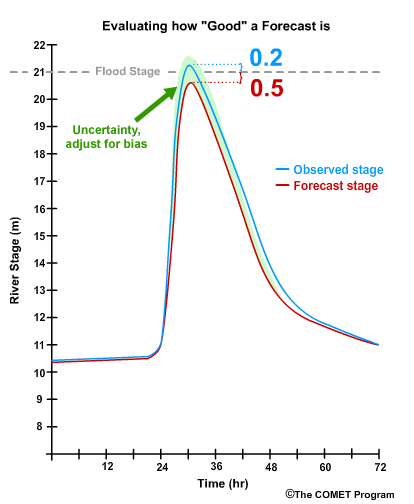
Description:
Simplified hydrograph showing what a user may look for to assess how good a forecast is.
File Name:
Fcst_performance_user_1.gif
Credits:
COMET
Copyright Terms:
COMET Standard Terms
of Use
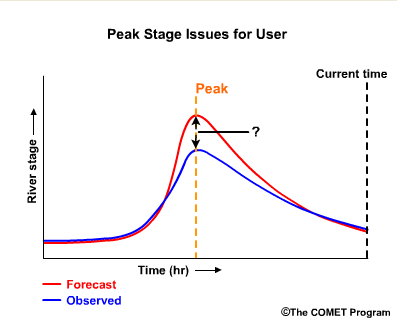
Description:
Simplified hydrograph showing what a user may look for to assess how good a forecast is.
File Name:
Fcst_performance_user_2.gif
Credits:
COMET
Copyright Terms:
COMET Standard Terms
of Use
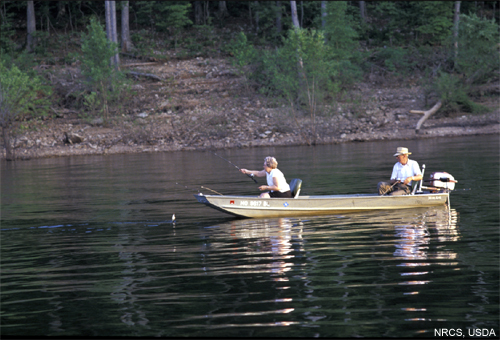
Description:
Couple fishing in a boat on a river.
File Name:
fishing_boat_couple.jpg
Credits:
NRCS, USDA
Copyright Terms:
COMET Standard Terms
of Use
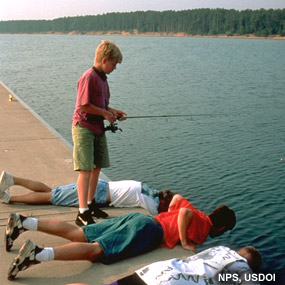
Description:
Boys fishing off a dock.
File Name:
fishing_boys.jpg
Credits:
NPS, USDOI
Copyright Terms:
COMET Standard Terms
of Use
Description:
high and low flow thresholds on a long-term hydrograph
File Name:
flow_condition.jpg
Credits:
COMET
Copyright Terms:
COMET Standard Terms
of Use
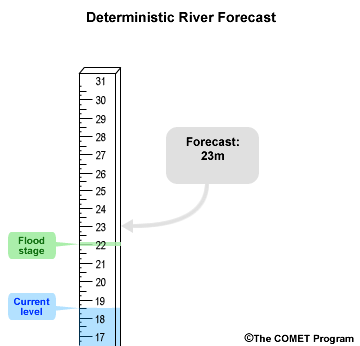
Description:
Illustration of what a deterministic river forecast is.
File Name:
Forecast_type1.gif
Credits:
COMET
Copyright Terms:
COMET Standard Terms
of Use
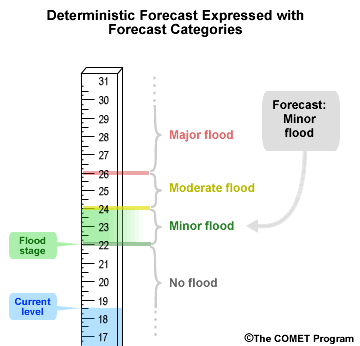
Description:
Illustration of what a categorical river forecast is.
File Name:
Forecast_type2.gif
Credits:
COMET
Copyright Terms:
COMET Standard Terms
of Use
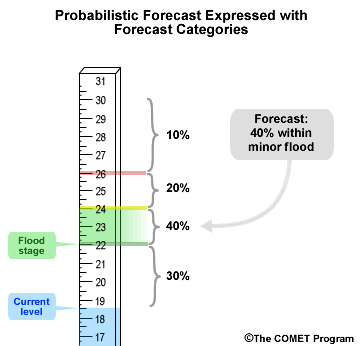
Description:
Illustration of what a probabilistic river forecast is.
File Name:
Forecast_type3.gif
Credits:
COMET
Copyright Terms:
COMET Standard Terms
of Use
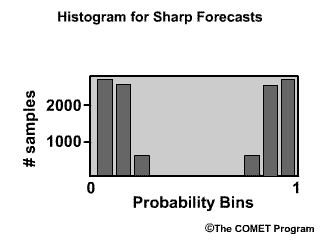
Description:
example of histogram showing potentially good forecast sharpness
File Name:
good_sharpness.gif
Credits:
COMET
Copyright Terms:
COMET Standard Terms
of Use

Description:
Illustration of how multiple source of information are needed to evaluate an item, like a house.
File Name:
House_info_1.gif
Credits:
COMET
Copyright Terms:
COMET Standard Terms
of Use
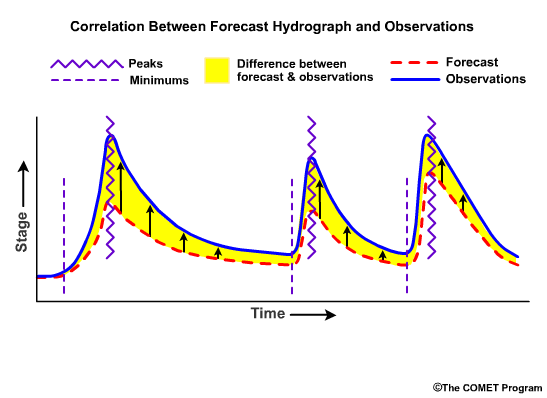
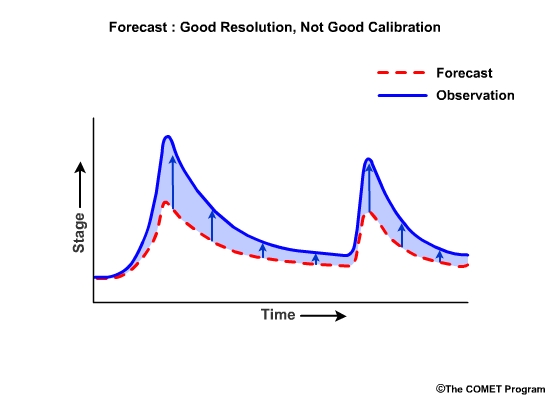
Description:
Hydrograph time series showing a situation where the forecasts have errors because they are biased, but the correlation between observations and forecasts is very good.
File Name:
hydrograph_correlation.gif
Credits:
COMET
Copyright Terms:
COMET Standard Terms
of Use
Description:
Hypothetical case of a river flood and how different users may view forecast performance.
File Name:
hydrograph1_1.gif
Credits:
COMET
Copyright Terms:
COMET Standard Terms
of Use
Description:
Hypothetical case of a river flood and how a user might incorporate verification information
File Name:
hydrograph2.gif
Credits:
COMET
Copyright Terms:
COMET Standard Terms
of Use
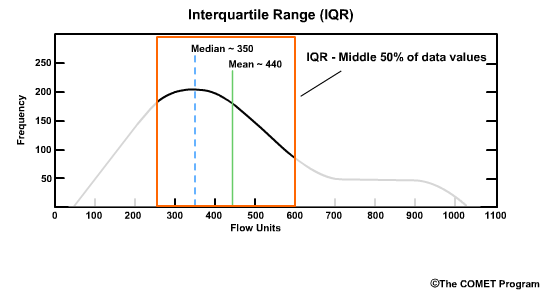
Description:
This shows the Interquartile Range (IQR) that goes along with the Probability Density Function for our river.
File Name:
IQR_river.gif
Credits:
COMET
Copyright Terms:
COMET Standard Terms
of Use
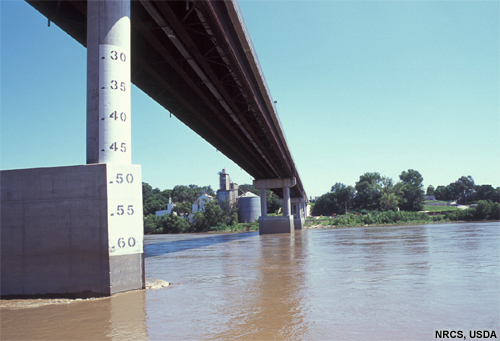
Description:
Bridge with gauge marks.
File Name:
Mo_River_bridge_1.jpg
Credits:
NRCS, USDA
Copyright Terms:
COMET Standard Terms
of Use
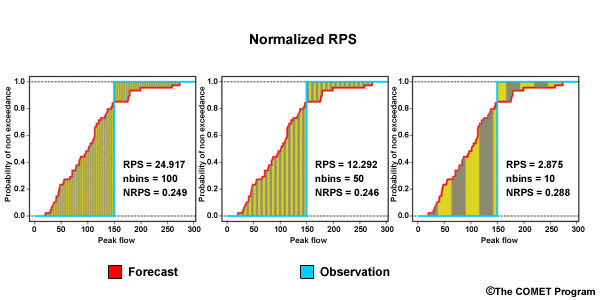
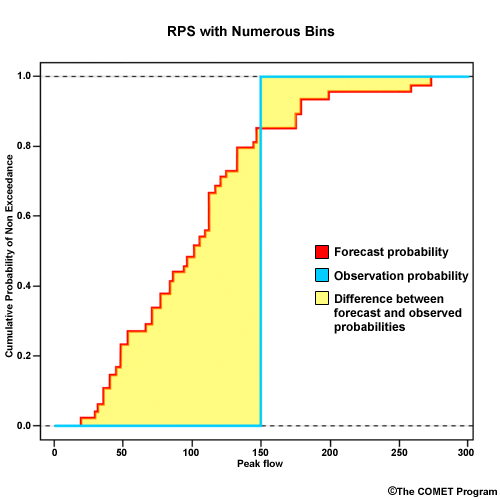
Description:
Normalized RPS example using the smaple plot with three different bin numbers.
File Name:
NPRS.jpg
Credits:
COMET
Copyright Terms:
COMET Standard Terms
of Use
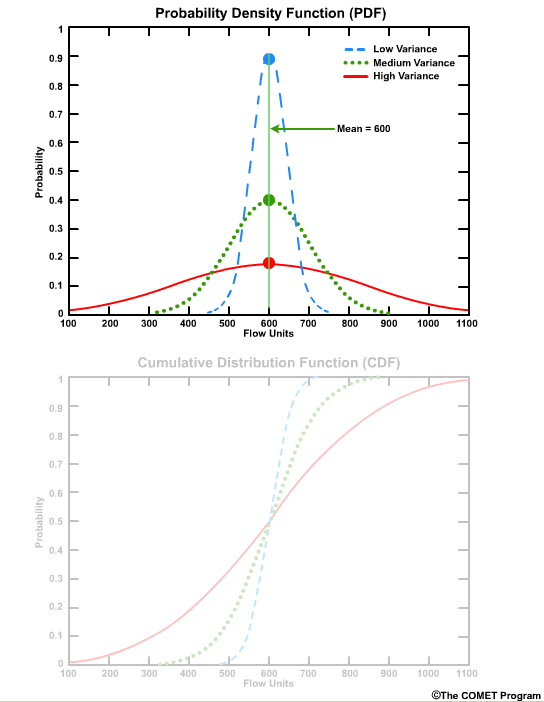
Description:
This shows the Probability Density Function (PDF) and Cumulative Distribution Function (CDF) for data that are normally distributed.
File Name:
pdf_cdf_norm_1.gif
Credits:
COMET
Copyright Terms:
COMET Standard Terms
of Use

Description:
This shows the Probability Density Function (PDF) with a corresponding Cumulative Distribution Function (CDF) for a river.
File Name:
pdf_cdf_river.gif
Credits:
COMET
Copyright Terms:
COMET Standard Terms
of Use
Description:
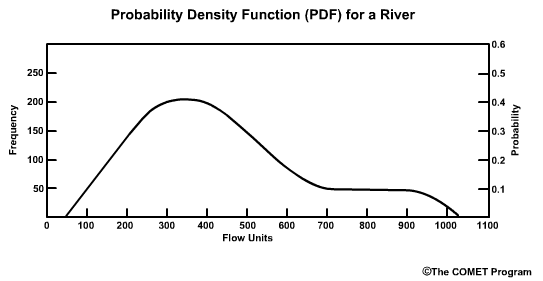
This shows the Probability Density Function (PDF) for a river.
File Name:
pdf_river_1.gif
Credits:
COMET
Copyright Terms:
COMET Standard Terms
of Use
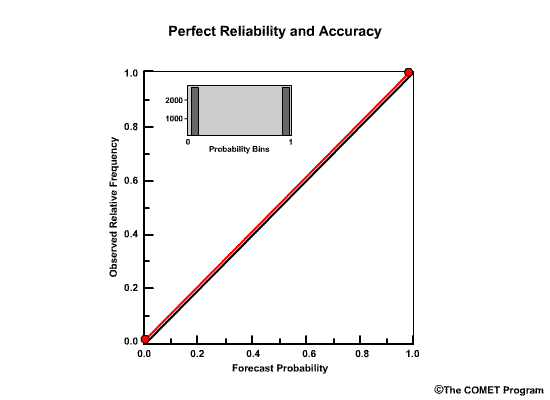
Description:
example of reliability diagram for perfect reliability and accuracy
File Name:
perfect_reliability.gif
Credits:
COMET
Copyright Terms:
COMET Standard Terms
of Use
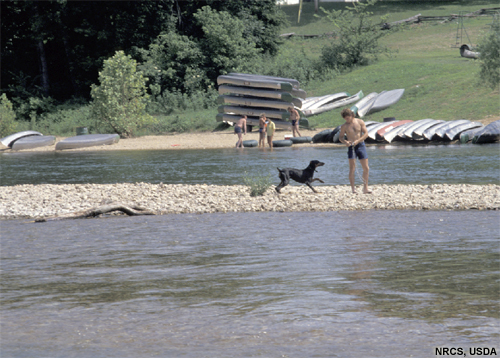
Description:
Man on sandbar in river with dog.
File Name:
person_river_sandbar.jpg
Credits:
NRCS, USDA
Copyright Terms:
COMET Standard Terms
of Use
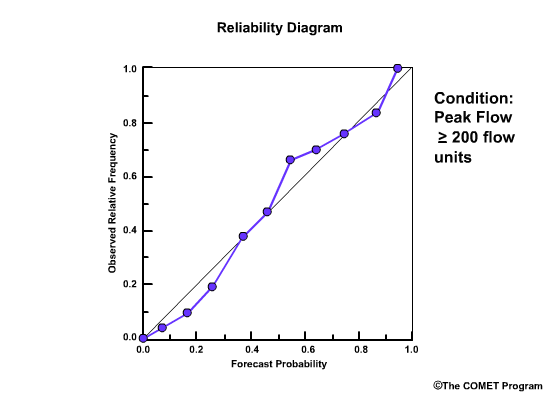
Description:
Example of a reliability diagram used in forecast verification
File Name:
reliability_diag_1.gif
Credits:
COMET
Copyright Terms:
COMET Standard Terms
of Use
Description:
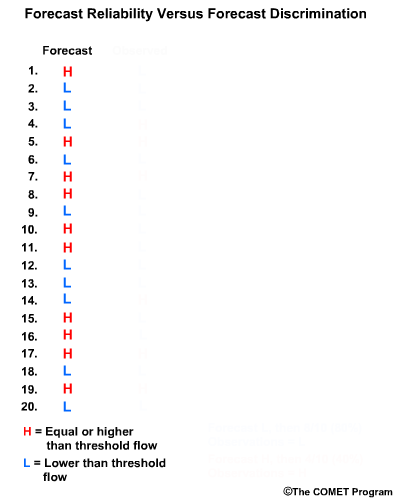
illustration of the difference between computing forecast reliability and forecast discrimination.
File Name:
reliability_discrimination_1.gif
Credits:
COMET
Copyright Terms:
COMET Standard Terms
of Use
Description:
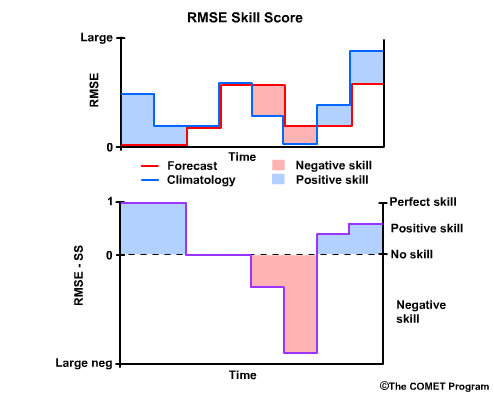
Illustration of how RMSE skill score is derived from a forecast and a reference RMSE.
File Name:
RMSESS.gif
Credits:
COMET
Copyright Terms:
COMET Standard Terms
of Use
Description:
Illustration of how RMSE Skill Score is derived.
File Name:
RMSESS_graph.gif
Credits:
COMET
Copyright Terms:
COMET Standard Terms
of Use
Description:
Example of how biased forecasts may show good forecast resolution.
File Name:
ROC_bias.jpg
Credits:
COMET
Copyright Terms:
COMET Standard Terms
of Use
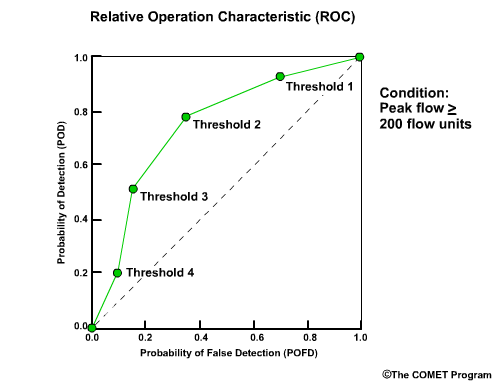
Description:
Components of the Relative Operating Characteristic Display (ROC) used in verification.
File Name:
ROC_display_1.gif
Credits:
COMET
Copyright Terms:
COMET Standard Terms
of Use
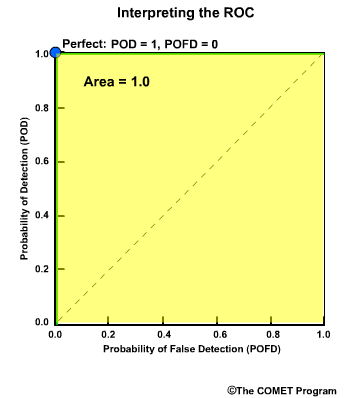
Description:
How to interpret a ROC display used for forecast verification
File Name:
ROC_interpretation_1.gif
Credits:
COMET
Copyright Terms:
COMET Standard Terms
of Use
Description:
Example of ROC for quiz
File Name:
ROC_question.jpg
Credits:
COMET
Copyright Terms:
COMET Standard Terms
of Use
Description:
Pie chart depiction the multi-categorical river stage forecast bins used in the verification score known as ranked probability score (RPS)
File Name:
RPS_piechart.gif
Credits:
COMET
Copyright Terms:
COMET Standard Terms
of Use
Description:
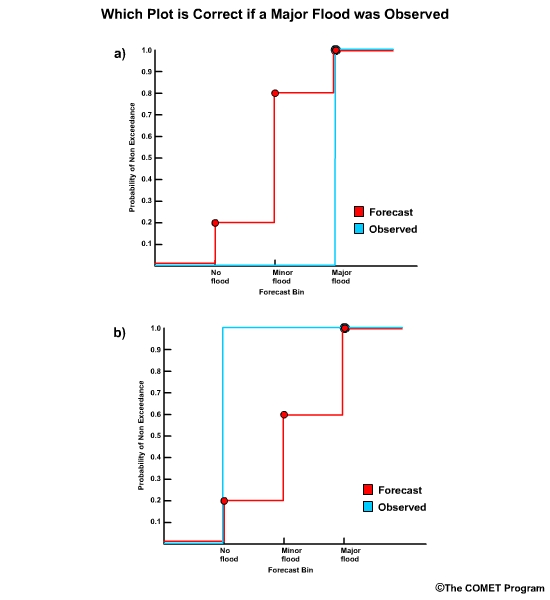
Display for quiz question of two Ranked Probability Statistic (RPS) plots for our example forecast with an observed major flood. Panel a) is the correct choice.
File Name:
RPS_plot_major.jpg
Credits:
COMET
Copyright Terms:
COMET Standard Terms
of Use
Description:
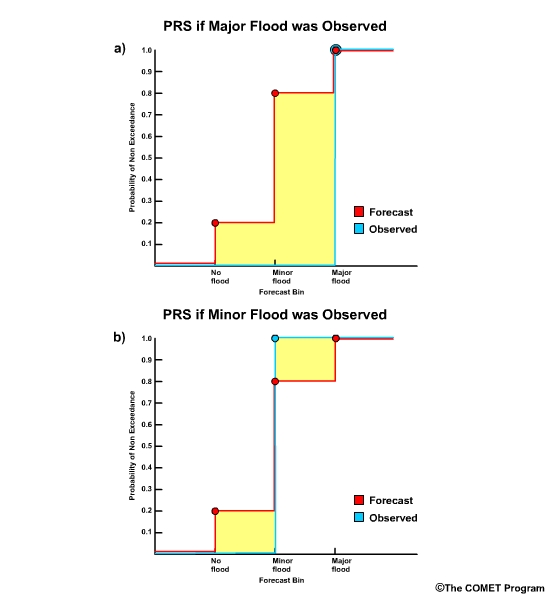
Display of Ranked Probability Statistic (RPS) for our example forecast with error area shaded for either an observed major flood or an observed minor flood.
File Name:
RPS_plot_major-minor_shaded.jpg
Credits:
COMET
Copyright Terms:
COMET Standard Terms
of Use
Description:
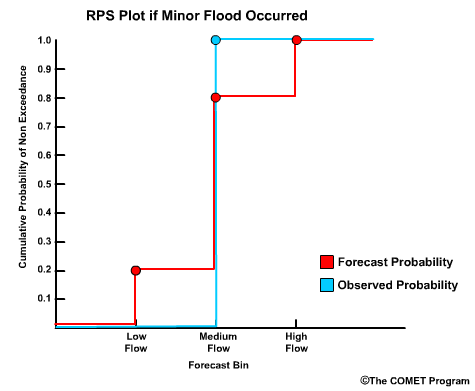
Display of Ranked Probability Statistic (RPS) for our example forecast with an observed minor flood.
File Name:
RPS_plot_minor.gif
Credits:
COMET
Copyright Terms:
COMET Standard Terms
of Use
Description:
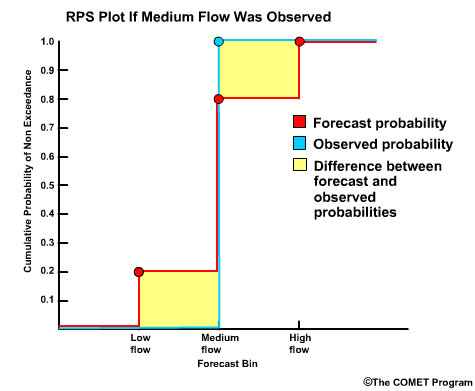
Display of Ranked Probability Statistic (RPS) for our example forecast with an observed minor flood. Error area is shaded.
File Name:
RPS_plot_minor_shaded.gif
Credits:
COMET
Copyright Terms:
COMET Standard Terms
of Use
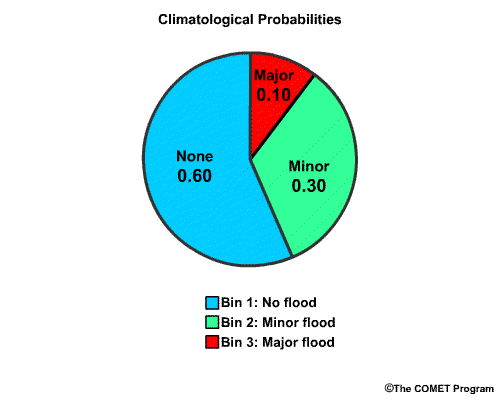
Description:
Climatological probability piechart for flood example
File Name:
RPSc_3bin_piechart.gif
Credits:
COMET
Copyright Terms:
COMET Standard Terms
of Use
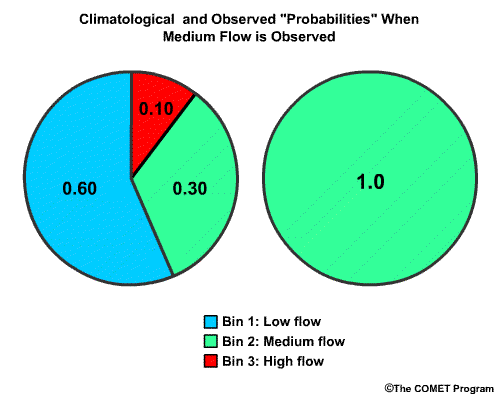
Description:
Climatological and Observed probability piecharts for flood example when a minor flood was observed
File Name:
RPSco_3bin_piechart.gif
Credits:
COMET
Copyright Terms:
COMET Standard Terms
of Use

Description:
Forecast probability pie chart for flood example
File Name:
RPSf_3bin_piechart.gif
Credits:
COMET
Copyright Terms:
COMET Standard Terms
of Use
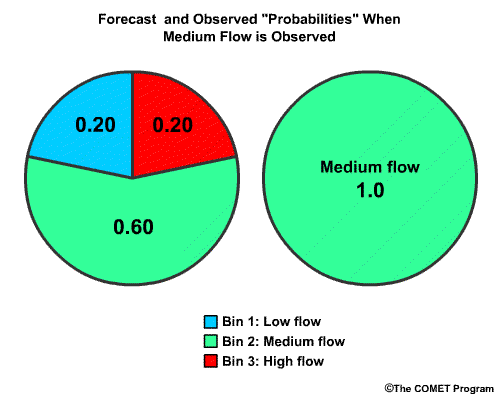
Description:
Forecast and Observed probability piecharts for flood example when a minor flood was observed
File Name:
RPSfo_3bin_piechart.gif
Credits:
COMET
Copyright Terms:
COMET Standard Terms
of Use
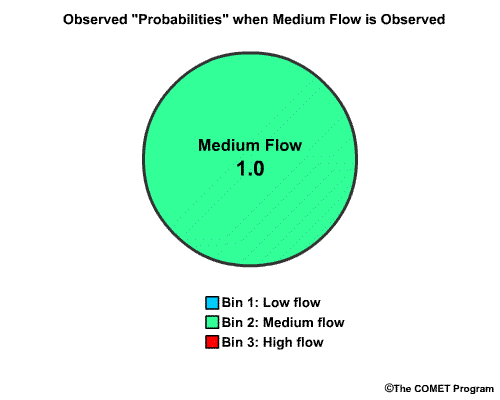
Description:
Observed probability piechart for flood example when a minor flood was observed
File Name:
RPSo_3bin_piechart.gif
Credits:
COMET
Copyright Terms:
COMET Standard Terms
of Use
Description:
RPS display example.
File Name:
sample_RPS.gif
Credits:
COMET
Copyright Terms:
COMET Standard Terms
of Use
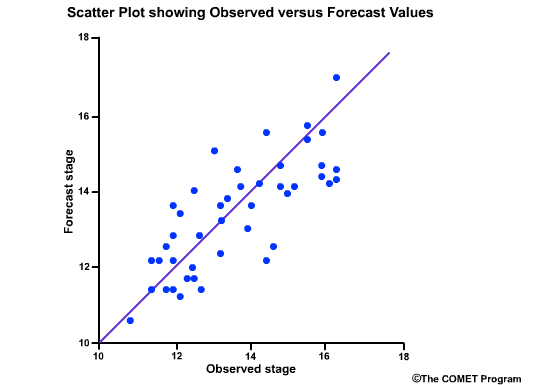
Description:
Sample scatterplot of observed versus forecast river stage.
File Name:
sample_scatterplot.gif
Credits:
COMET
Copyright Terms:
COMET Standard Terms
of Use
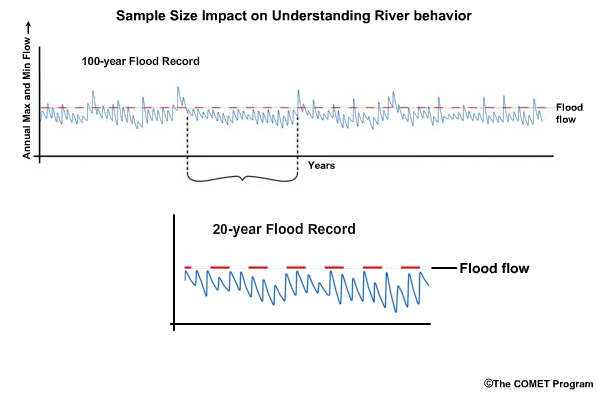
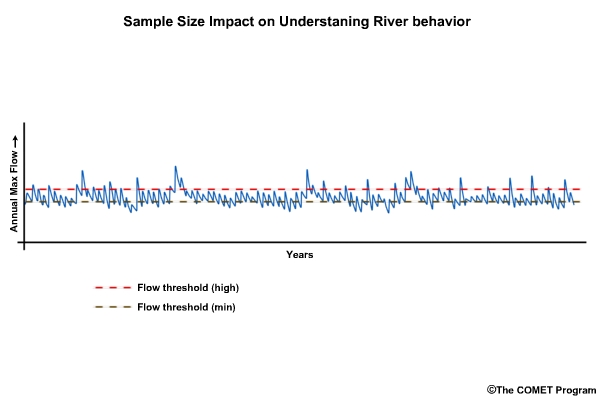
Description:
Hydrograph time series (simulated) that shows how sample size impacts knowledge of river behavior when considering the annual peak flows.
File Name:
samplesize.gif
Credits:
COMET
Copyright Terms:
COMET Standard Terms
of Use
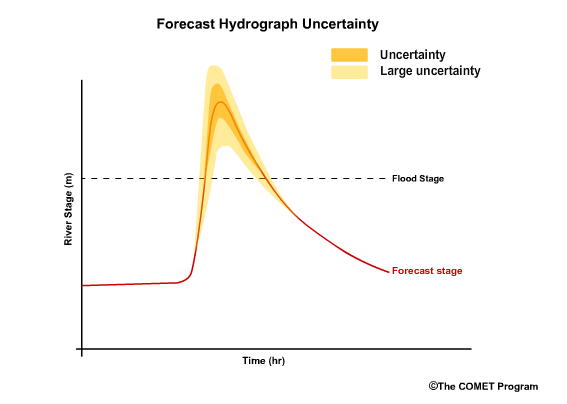
Description:
This shows uncertainty associated with forecast hydrograph
File Name:
samplesize_uncertainty.gif
Credits:
COMET
Copyright Terms:
COMET Standard Terms
of Use
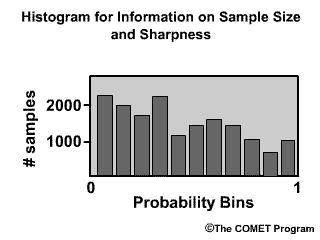
Description:
sample histogram useful with reliability diagram to indicate forecast sharpness
File Name:
sharpness.gif
Credits:
COMET
Copyright Terms:
COMET Standard Terms
of Use
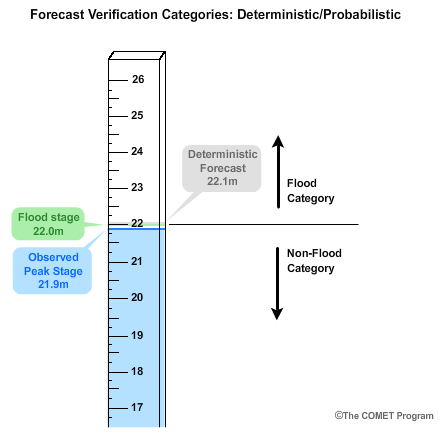
Description:
Graphical depiction of how forecast verification categories are set up for both deterministic and probabilistic hydrologic forecasts.
File Name:
stage_gauge_1.gif
Credits:
COMET
Copyright Terms:
COMET Standard Terms
of Use
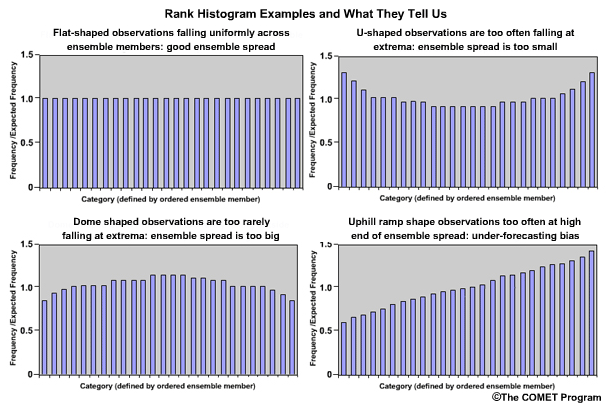
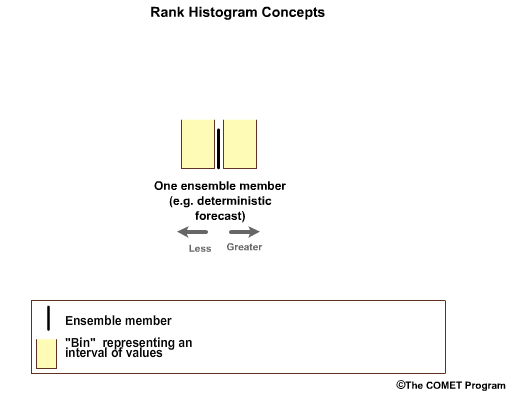
Description:
Examples of talagrand diagrams and what they tell us about the ensemble spread
File Name:
talagrand_diagrams_1.gif
Credits:
COMET
Copyright Terms:
COMET Standard Terms
of Use
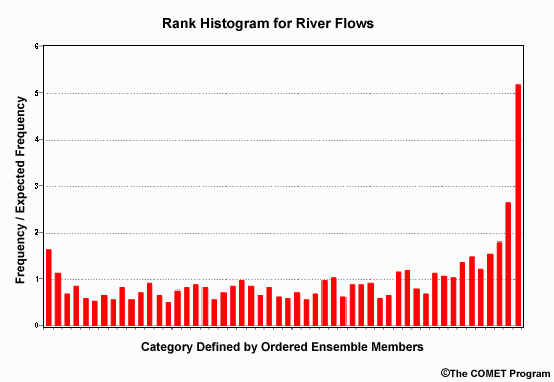
Description:
Talagrand Diagram for River flows showing a situation where the ensemble spread in the forecasts is too small.
File Name:
talagrand_example.gif
Credits:
COMET
Copyright Terms:
COMET Standard Terms
of Use
Description:
Shows what a talgrand diagram should show for ideal ensemble forecasts.
File Name:
talagrand_principles_1.gif
Credits:
COMET
Copyright Terms:
COMET Standard Terms
of Use
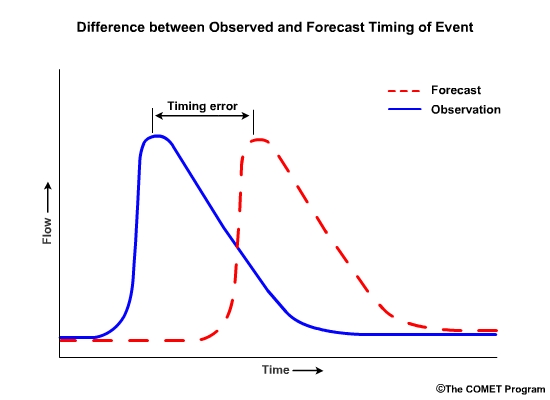
Description:
Graphic depicting a timing error between observed and forecast hydrographs
File Name:
timing_verif.jpg
Credits:
COMET
Copyright Terms:
COMET Standard Terms
of Use