1.0 Introduction
View the video for a quick introduction to the National Water Model (NWM).
The remainder of this lesson will be text-based.
This lesson will explore short- and medium-range guidance, using the historic flood event associated with the remnants of Hurricane Harvey in August 2017.
You will see both official NWM products as of summer 2017 as well as prototype products that are still being refined and evaluated. That will be followed with an overview of the NWM and its goals.
2.0 Medium Range NWM Guidance: 25-31 August 2017
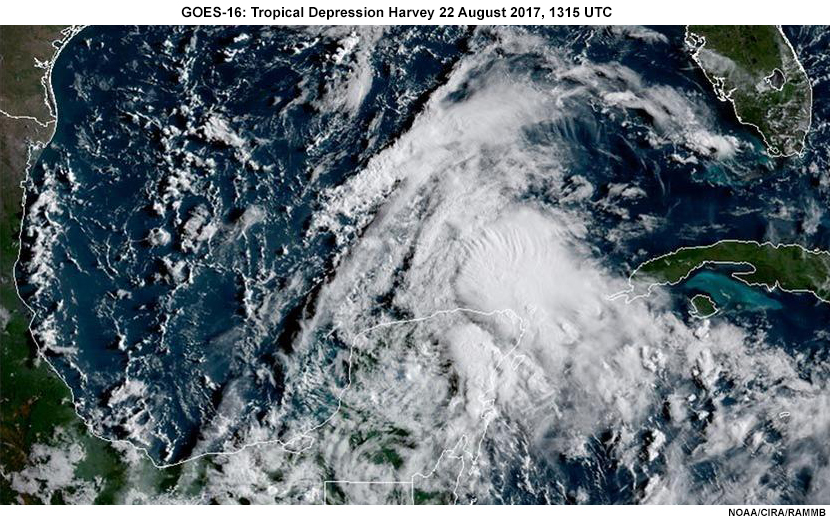
It’s the 22nd of August 2017 and concern is growing over the potential for extreme rainfall and subsequent flooding beginning about 4 days from now for parts of the Texas Gulf Coast associated with Tropical Storm Harvey. Forecasters and local officials know that preparation should begin now to be ready for the possibility of road closures and evacuations due to flooding , especially in some of the densely populated urban areas. The situation is further complicated by the potential for coastal flooding depending on the future development and movement of tropical depression Harvey.
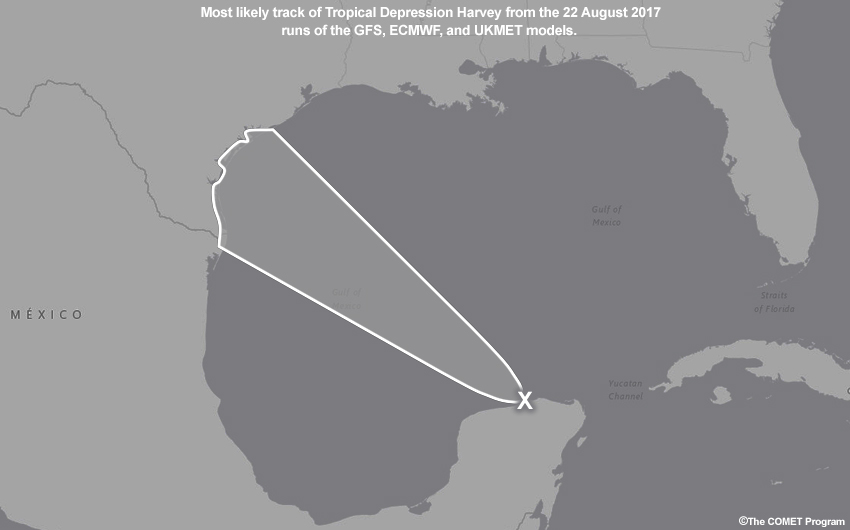
The storm moved into the Gulf of Mexico from Mexico’s Yucatan peninsula. The primary medium-range numerical models used by forecasters (the GFS, the ECMWF, and the UKMET) all strengthen Harvey to a tropical storm or even a minimal hurricane before landfall somewhere between the mouth of the Rio Grande and the central Gulf Coast of Texas around the 25th of August.
Modeled guidance suggests slow, erratic movement of post-landfall Harvey which could keep tropical rainfall over portions of southeastern Texas for an extended period.
2.0 Medium Range NWM Guidance: 25-31 August 2017 » 2.1 Medium-range QPF
Question
Let’s see what you already know about precipitation input. Which of the following are used for Quantitative Precipitation Forecast (QPF) input to the National Water Model?
The correct answers are a, d.
In the current implementation of the National Water Model as of early 2018, the medium range QPF input (downscaled to 1 km spatial resolution) is from the GFS and extends out to 10 days. For the short range (0-18 hours) the HRRR is part of a blend that provides QPF input.
Let’s take a look at the QPF that was being used by the NWM on the morning of 22 August 2017.
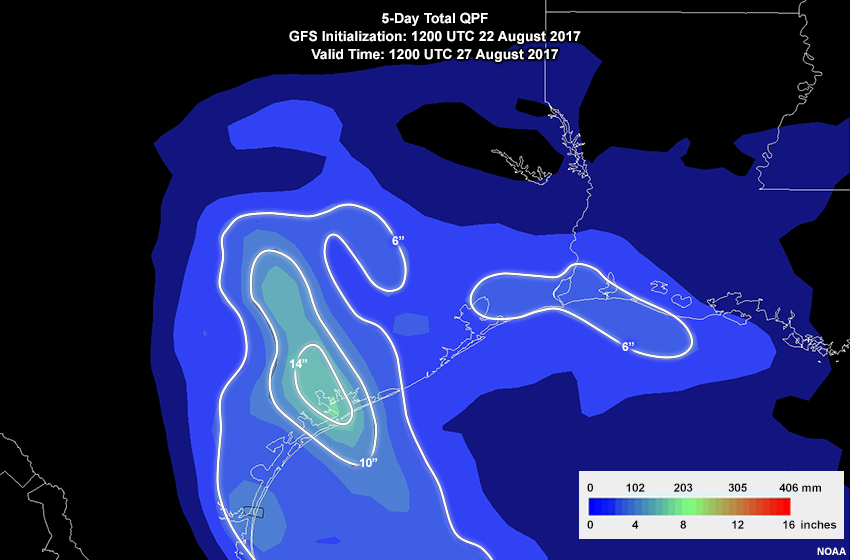
Here is a 5-day total QPF valid 1200 UTC on August 27th. Note the forecast rainfall near the projected storm path exceeds 10 inches (250 mm).There are also areas of greater than 6 inches (150 mm) that are well to the east from the path.
Question
Based on the the 5-day QPF from the GFS, where are the primary and secondary areas of concern for significant flooding?
Use the red pen for your primary concern area, and the yellow pen for the secondary concern area, if any.
| Tool: | Tool Size: | Color: |
|---|---|---|
|
|
Answer: The GFS QPF that went into the NWM on 22 August had a primary area of large accumulation near the storm center that should catch your attention. Another area mainly near and east of Galveston Bay was beginning to receive large amounts in the latter part of this 5-day period and you may have highlighted that as a secondary areas.
It is also quite possible that to account for the uncertainty in the forecast models you highlighted a large region. In reality, local officials and forecasters throughout the mid and upper Gulf Coast of Texas were very concerned about the potential for major flooding at this time.
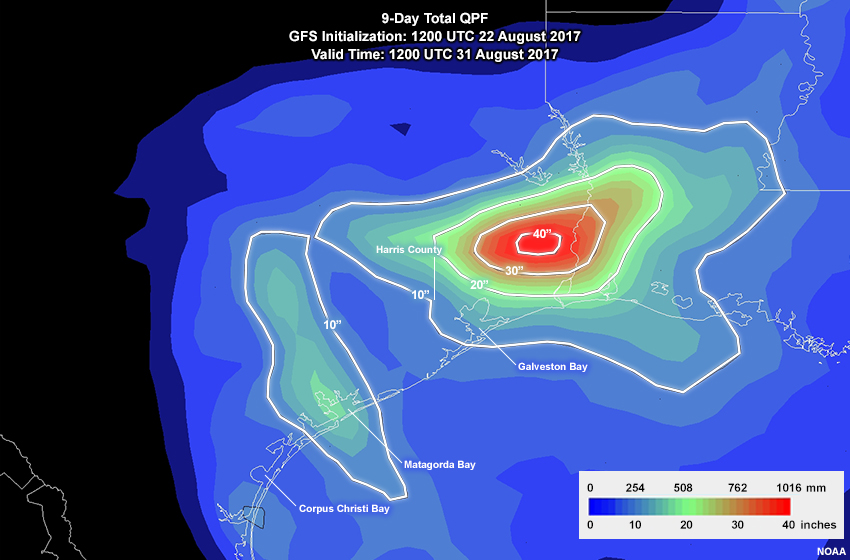
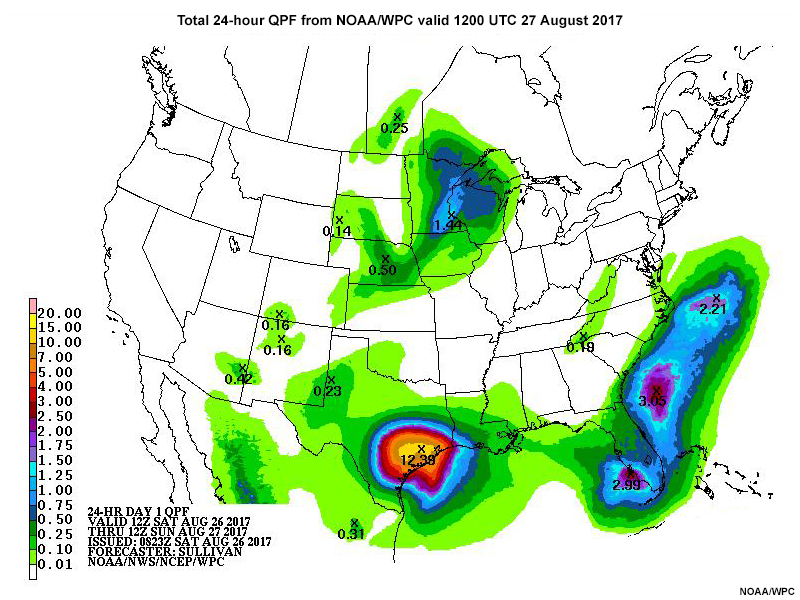
The 9-day cumulative QPF from the same GFS run shows some exceptional amounts of QPF through 1200 UTC August 31st. Along the path of the landfalling storm the QPF is for 10-17 inches (254-430 mm) of rain, with 20-40 inches (508-1,016 mm) over far southeastern Texas and southwestern Louisiana. Note the relative min in extreme rainfall between Matagorda Bay and Galveston Bay.
Question
Given the distribution shown in the QPF, what can you say to local officials in coastal Texas and southwestern Louisiana?
The correct answer is b.
Although the QPF would suggest relatively less severe conditions in coastal Texas between Matagorda Bay and Galveston Bay (including Houston), there is uncertainty about the movement and evolution of the storm. This is a 9-day forecast which is good for regional situational awareness, but probably not sufficient for details pinpointing the most severe rains and resulting runoff.
2.0 Medium Range NWM Guidance: 25-31 August 2017 » 2.2 Official medium-range NWM products
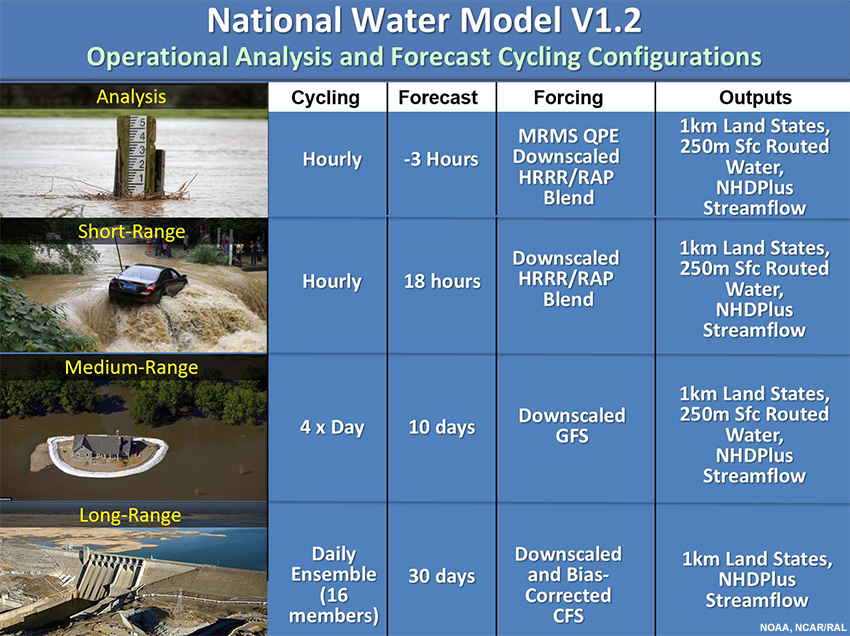
The official NWM medium range guidance products are generated 4 times a day and extend out to 10 days at a 3-hour temporal resolution. They have a spatial resolution of 1 km for land and meteorological forcing, and 250 m for runoff. The 2.7 million stream reaches and catchments within the NWM domain are from the NHDPlus stream network. These vary in size, with an average of 0.5-1.0 km per reach, and 3 km2 for a catchment area.
The following animations from the 22 August 2017 National Water Model provide 10 day guidance through 1200 UTC on 1 September. You can loop or step through each set of images, and toggle between streamflow, streamflow anomaly, and near-surface soil moisture. Then answer the questions in the following subsections.
NWM Medium Range Streamflow Guidance, 22 August - 1 September 2017
NWM Medium Range Streamflow Anomaly Guidance, 22 August - 1 September 2017
NWM Medium Range Soil Moisture, 22 August - 1 September 2017
2.0 Medium Range NWM Guidance: 25-31 August 2017 » 2.2 Official medium-range NWM products » 2.2.1 Medium range streamflow guidance
Question
Step through the streamflow forecasts (22 August 1-September 2017). Which statement(s) best reflect the data?
The correct answers are a, c, d.
Streamflow values increase around 26-27 August in the Houston-Galveston area. Because these are absolute values there is no indication from this product alone whether a higher flow is nearing or exceeding bankfull. High flows stand out, but flood flows are not very obvious. One would need other information to quantify the risk at this point.
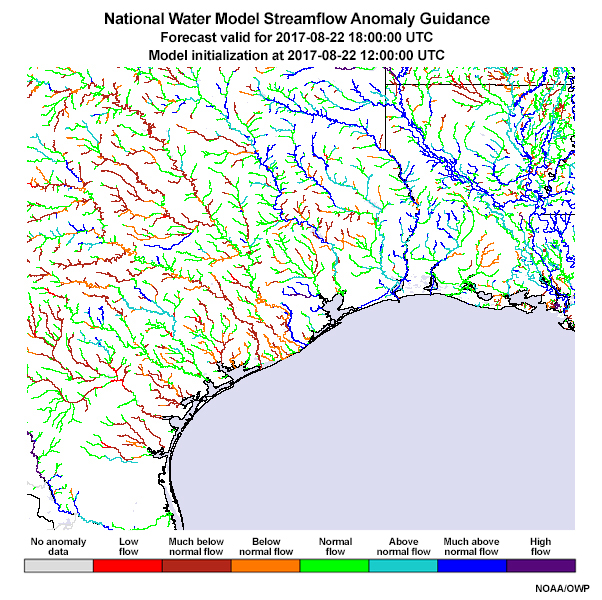
2.0 Medium Range NWM Guidance: 25-31 August 2017 » 2.2 Official medium-range NWM products » 2.2.2 Medium range streamflow anomaly guidance
The streamflow anomaly product provides additional information by helping us visualize the modeled flow relative to long-term climatology. As you play this 22 August through 1 September animation, you can see the changes within the channels.
Question
On this still image from 1200 UTC 27 August use the pen to identify the region with the greatest increase in flow anomaly since 22 August.
| Tool: | Tool Size: | Color: |
|---|---|---|
|
|
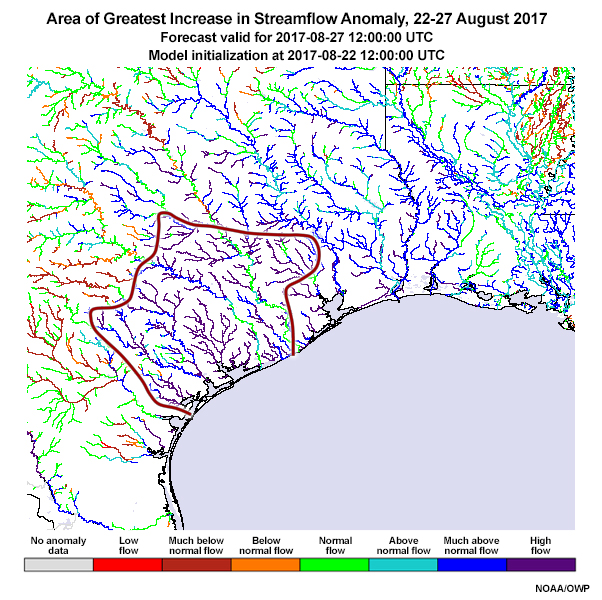
A large area of coastal Texas saw a rapid change from below or much below average to high flow in the period 25-27 August. Even in the Galveston Bay area many reaches are now at high flow. The product shows the areas with high anomaly but does not show any specific quantitative guidance about how much over bankfull these streams may see. There are products being developed that will address that information.
2.0 Medium Range NWM Guidance: 25-31 August 2017 » 2.2 Official medium-range NWM products » 2.2.3 Medium range near-surface (top 40 cm) soil moisture
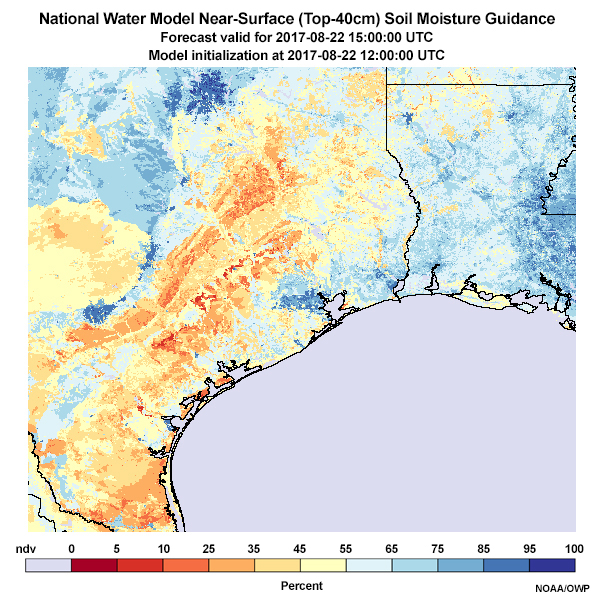
This is an animation of NWM near surface (top 40 cm) soil moisture, expressed as percent saturation, for the period 22 August through 1 September.
Question
What can you say about the NWM near-surface soil moisture medium range guidance for the period of 22 August to 1 September 2017?
The correct answers are b, c.
The NWM near-surface soil moisture is consistent with the NWM streamflow anomaly guidance in that it shows rapid changes in the 25-27 August period. The increased soil saturation indicated by this product would reduce infiltration capacity and thus increase the potential for rapid surface runoff.
2.0 Medium Range NWM Guidance: 25-31 August 2017 » 2.2 Official medium-range NWM products » 2.2.4 Medium range simulated hydrograph
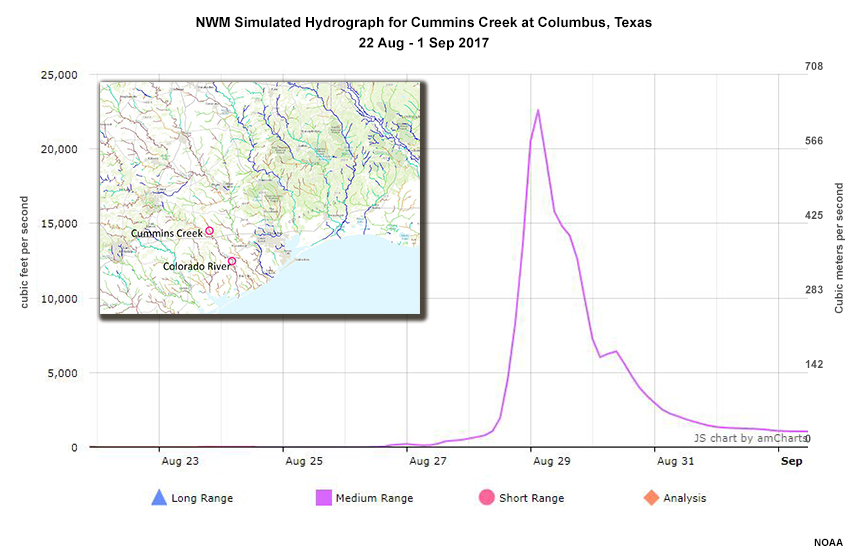
Medium Range Simulated Hydrograph, Cummins Creek at Columbus, TX
Medium Range Simulated Hydrograph, Colorado River at Wharton, TX
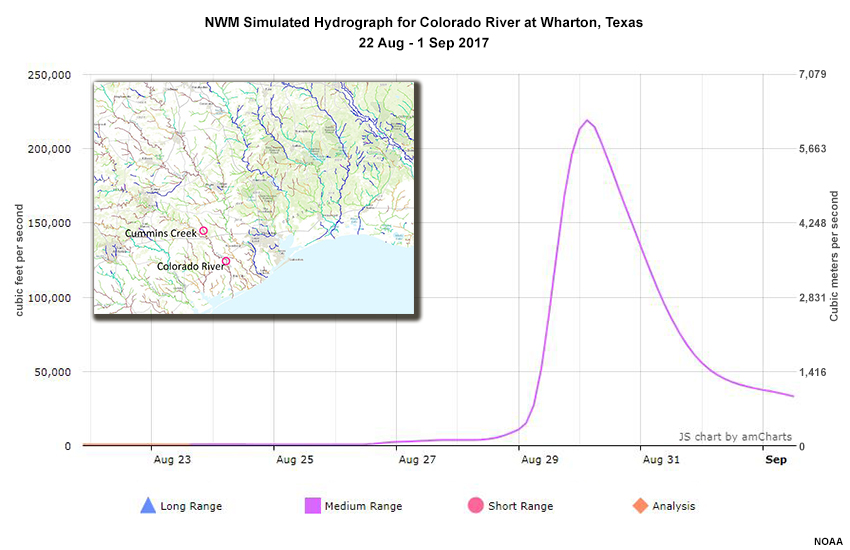
Official medium range products from the NWM also include simulated hydrographs. Cummins Creek at Columbus is a tributary to the larger volume Colorado River. Based on the 23 August 2017 run of the NWM, you can see rapid rises on both. The smaller Cummins Creek peaks about 24 hours sooner. With the storm still a few days from landfall, these hydrographs, like the QPF they are dependent on, have some uncertainty in the timing and magnitude. At this time local officials and forecasters were increasingly confident that at least part of the region would likely to see very major rises on the waterways.
2.0 Medium Range NWM Guidance: 25-31 August 2017 » 2.3 Evolving medium range NWM products (unofficial)
In the previous section we examined and interpreted some official products from the NWM. In this section we will examine some unofficial products as of early 2018. The products we will show are very similar to experimental products that were produced for use during both the Hurricane Harvey event and during a summer 2017 Flash Flood and Intense Rain (FFaIR) field exercise. The ones included in this training have a good chance of becoming official products.
Here is a list of the unofficial evolving products. Like the official medium range products, they are forecast with the GFS QPF out to 10 days.
|
NWM Medium Range Products (not official) |
|---|
|
You may notice the term “high flow” used in some of the medium and short range guidance. The definition of “high flow” is still evolving as model developers work to determine the best way to quantify this important category across seasons, geographic regions, and varying stream characteristics. If you are interested in more detail, please see appendix AAppendix A.
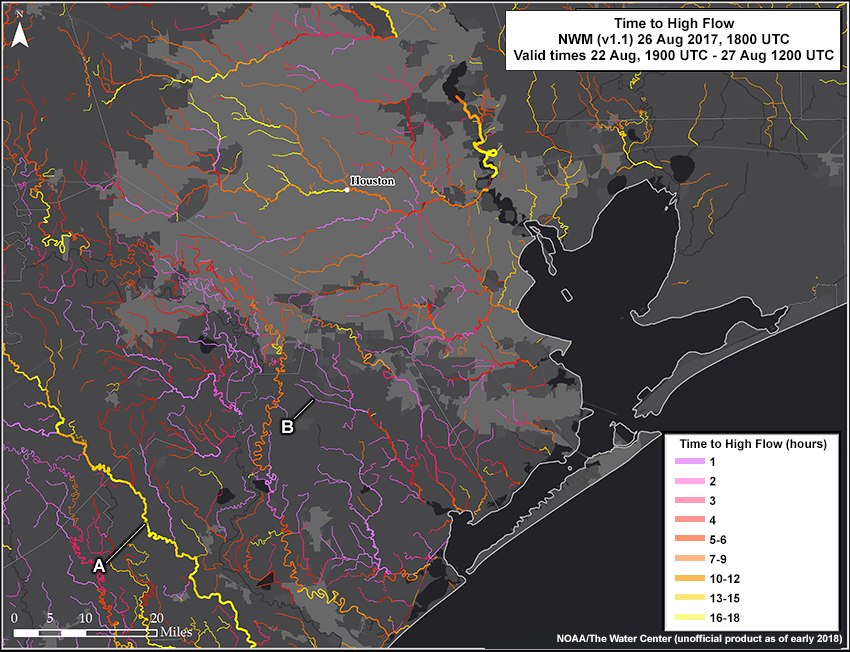
2.0 Medium Range NWM Guidance: 25-31 August 2017 » 2.3 Evolving medium range NWM products (unofficial) » 2.3.1 Time to high flow
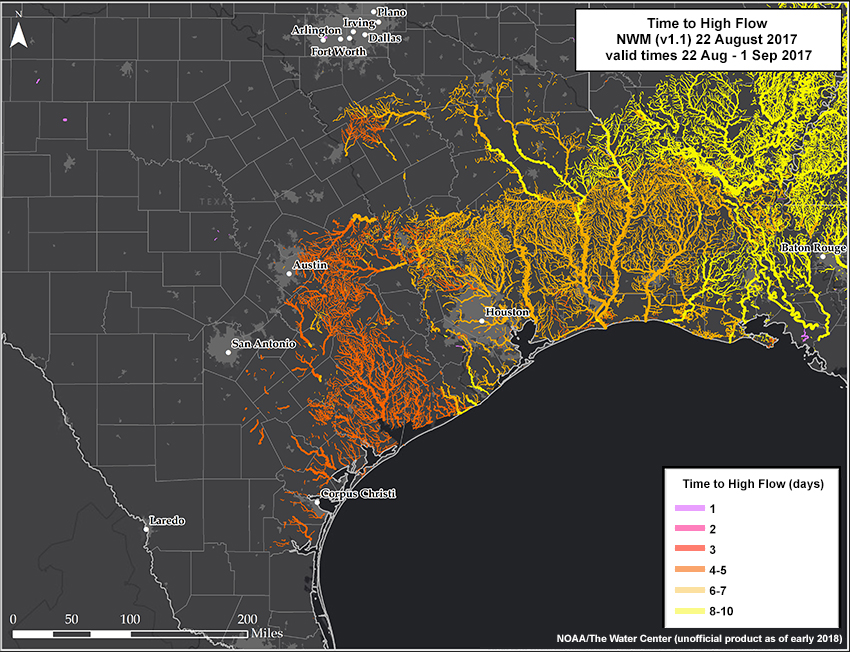
The time to high flow graphic shows the expected timing of stream reaches expected to exceed a high flow threshold. The color coding depicts the lead time for the onset of high flow.
You can see that the NWM guidance over the 10-day period suggests that the areas closest to the first expected landfall expect high-flow impacts first (dark orange). Later as the heavy rains associated with the storm circulation spread slowly northeastward the high-flow impacts also spread northeastward (yellow).
Question
Why does the area near and to the west of Houston have a relatively small number of reaches that show high flow?
The correct answer is a.
There are fewer reaches that exceed high flow during this 10-day period. Remember, this is an area with a relative minimum on the GFS QPF forcing. With respect to answer c, the NWM provides guidance for ungauged as well as gauged stream channels.
2.0 Medium Range NWM Guidance: 25-31 August 2017 » 2.3 Evolving medium range NWM products (unofficial) » 2.3.2 Peak flow
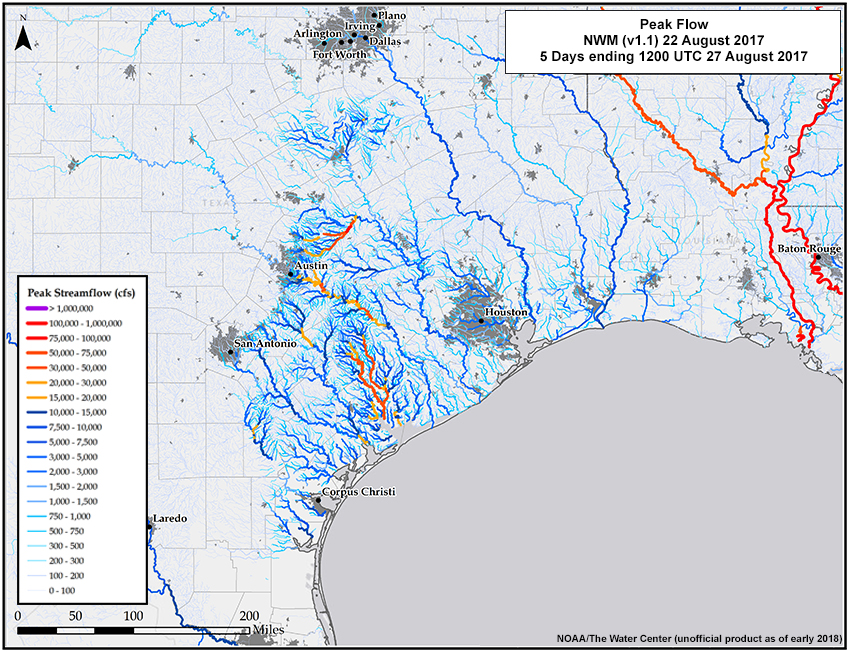
This product shows the expected peak flow over the 5-day period ending at 1200 UTC 27 August 2017. The orange and red colors in Texas are where streamflow is increasing steadily as of the forecast valid time. The red color of the Mississippi River depicts the typically high volume of that channel which is not changing much at this valid time.
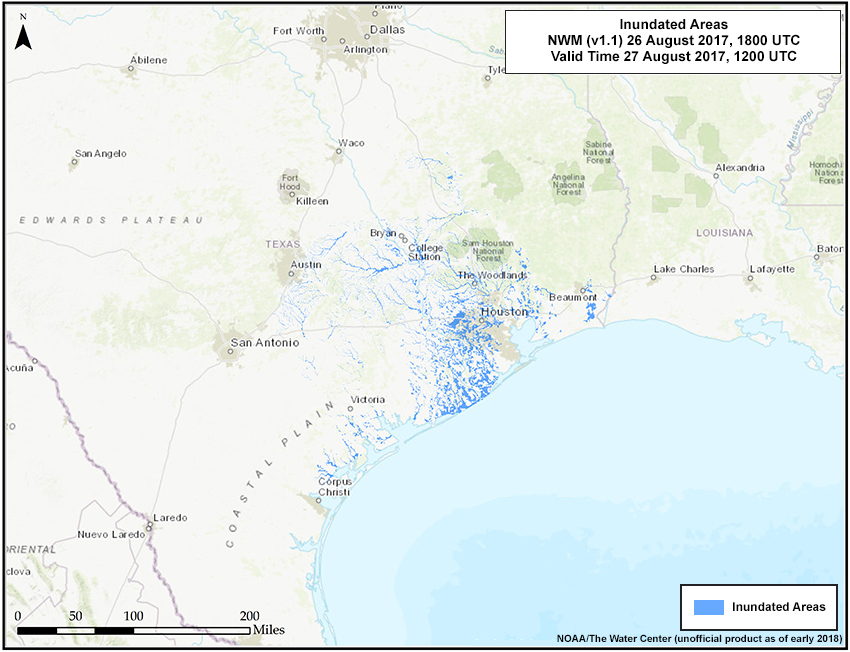
2.0 Medium Range NWM Guidance: 25-31 August 2017 » 2.3 Evolving medium range NWM products (unofficial) » 2.3.3 Inundated areas
NWM Medium Range Inundation Areas
NWM Medium Range Inundation Areas, zoomed
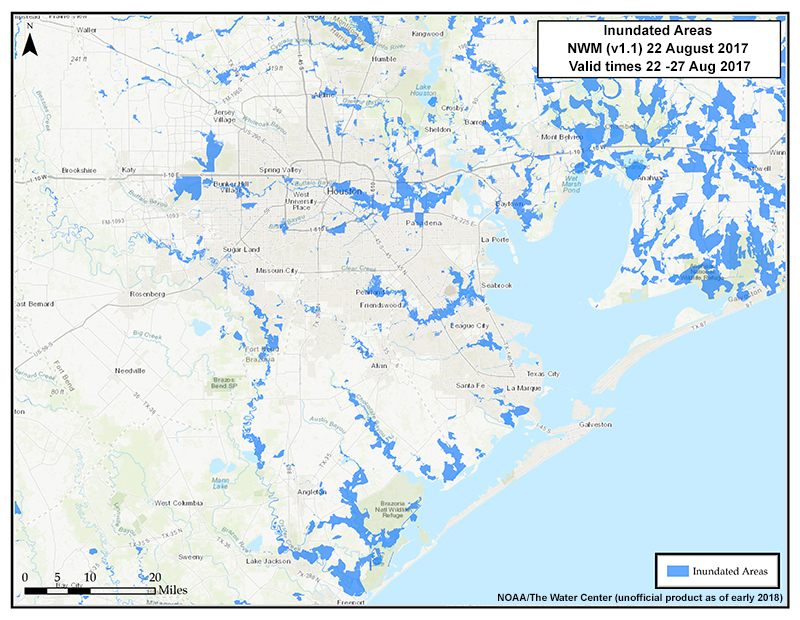
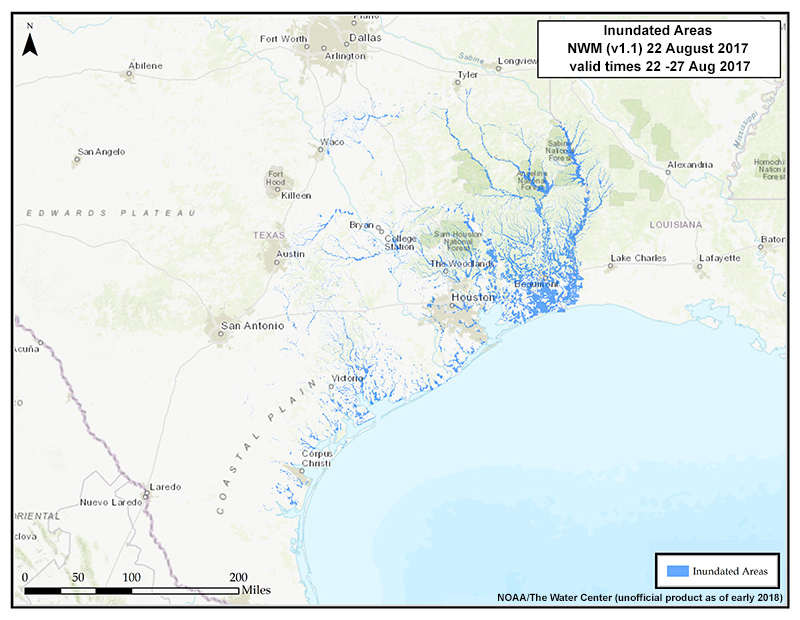
Streamflow guidance from the NWM is used to generate information for expected inundation extent. The inundation extent is generated using the Height Above the Nearest Drainage (HAND) method. The inundation depicted with this method is fluvial in nature. That means that inundation is the result of overbank flows from streams and rivers.
Question
If the inundation extent is mainly showing areas where a stream, river, or bayou is causing overbank inundation, what other types of inundation might be missing?
The correct answer is d.
The HAND method is not suited to represent inundation due to overland flow, ponded water, or coastal flooding from storm surge. Users should be aware of areas subject to such inundations, such as low lying coastal environments and urbanized basins.
2.0 Medium Range NWM Guidance: 25-31 August 2017 » 2.4 Trend in Hurricane Harvey forecast track
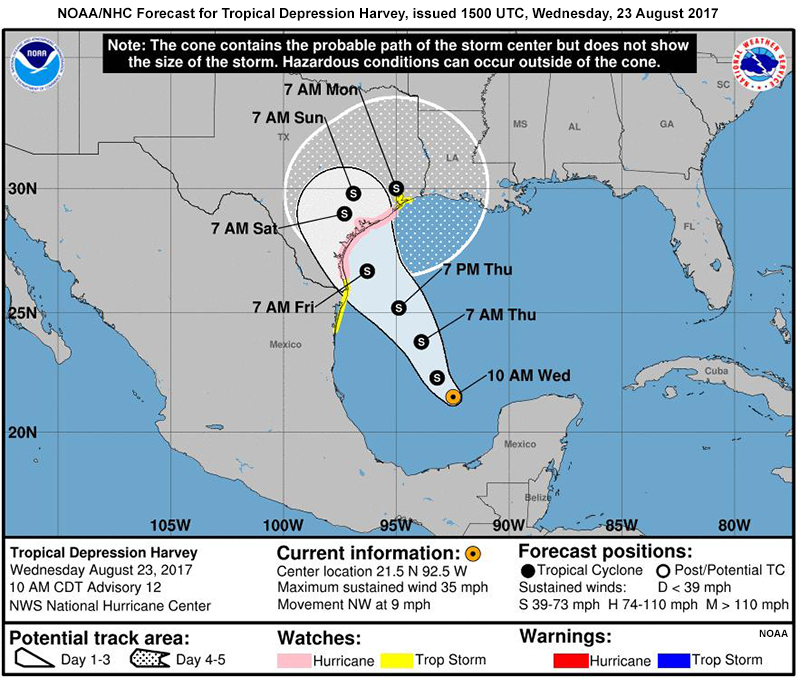
23 August 2017 NOAA National Hurricane Center forecast
25 August 2017 NOAA National Hurricane Center forecast
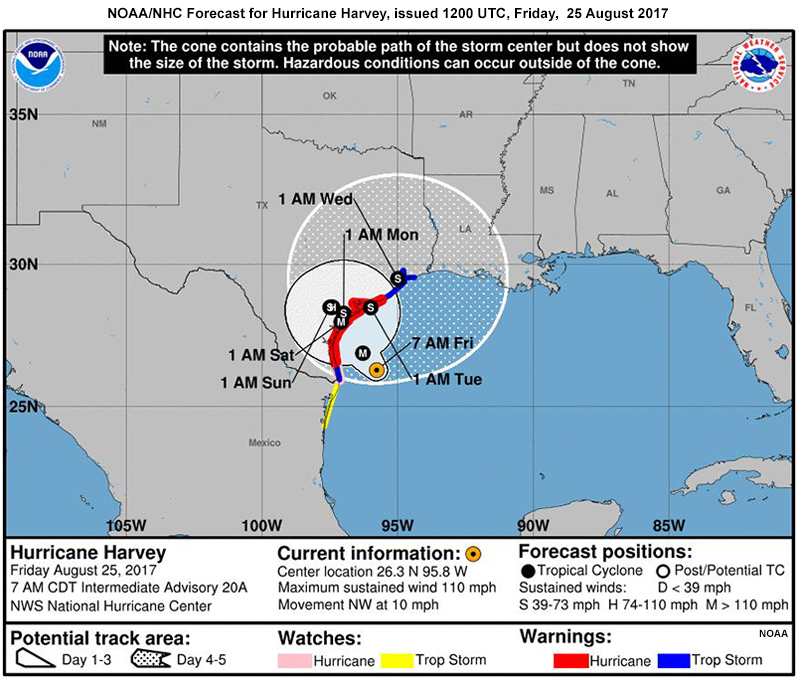
Click the tabs to compare the National Hurricane Center forecasts issued on the mornings of 23 and 25 August. By the 23rd it was becoming more probable that Harvey would strengthen to a hurricane before making landfall in the vicinity of Corpus Christi. It’s post-landfall path would slow and possibly shift up the coast. On the morning of August 25th Harvey was a strengthening hurricane expected to make landfall as a major hurricane.
Question
What do the nearly circular shapes of the potential track areas suggest?
The correct answers are a, b.
The nearly circular 1-3 and 4-5 day potential tracks illustrate the expectation for slow and erratic movement. Its movement combined with its large powerful circulation would create a long period of shoreward moisture advection over a large area.
3.0 Short Range Rainfall and NWM Guidance: 26-28 August 2017
3.0 Short Range Rainfall and NWM Guidance: 26-28 August 2017 » 3.1 Short Term QPF
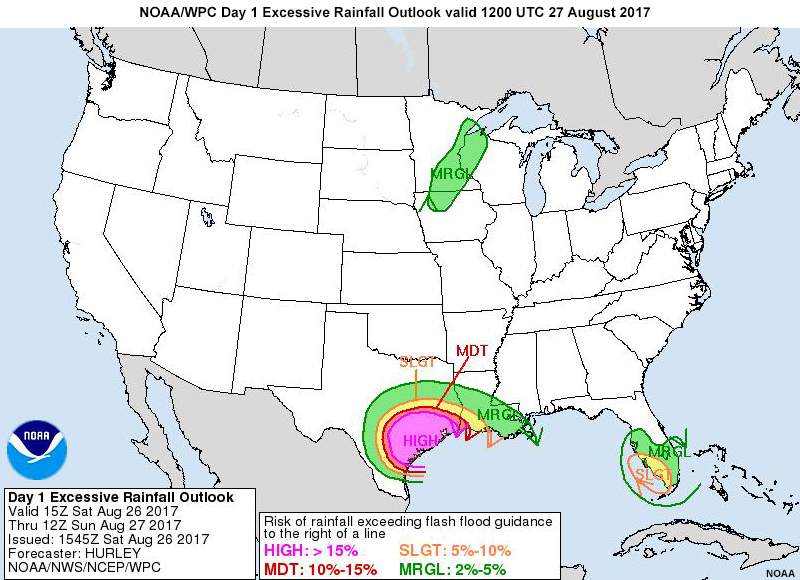
It is now Saturday morning, 26 August, and Hurricane Harvey is inland, nearly stationary, and at tropical storm strength. Intense rainfall has been occurring near the center of circulation and in rain bands mainly east of the circulation. In Harris and Galveston counties officials are acting on the developing hydrologic situation. 1-3 inches of rain (25-75 mm), and some localized areas of 6 inches (150 mm), have already occurred, mainly in the most recent 24 hours. The NOAA WPC Day 1 QPF and the Excessive Rainfall Outlook show more intense rainfall is expected with a high risk of exceeding flash flood guidance over the next 24 hours across a large part of southeastern Texas, including Harris and Galveston counties.
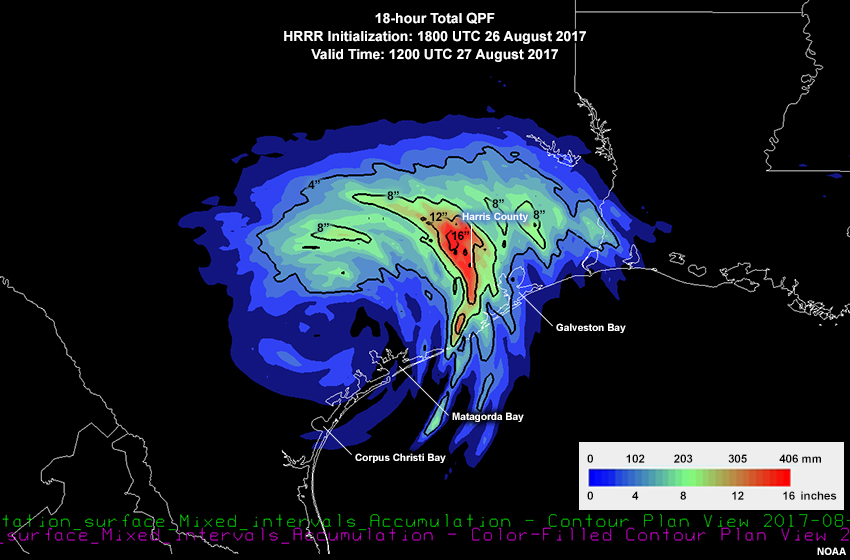
Here is the 18-hour total QPF from the HRRR model initialized at 1800 UTC and valid at 1200 UTC Sunday, 27 August.
Question
Why should this HRRR QPF be of interest to NWM forecasters and forecast users?
The correct answers are a, d.
The NWM uses a blend of HRRR and RAP QPF (RAP in areas outside the HRRR domain) in its short term (0-18h) guidance. In this case the operational forecast indicates 4-16 inches (100-400 mm) over the next 18 hours in an area that received heavy rain in the most recent 24 hours.
3.0 Short Range Rainfall and NWM Guidance: 26-28 August 2017 » 3.2 Official Short Range NWM Products, 26-27 August 2017
The official NWM short range guidance products extend from 1-18 hours. As with the medium range, the QPF is downscaled to 1 km for the NWM. Unlike the medium range, the temporal resolution is 1 hour, and the native resolution of the HRRR is greater than that of the GFS.
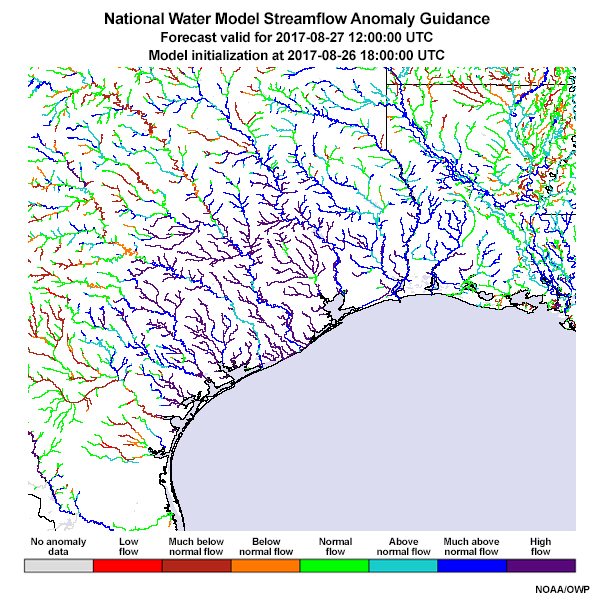
3.0 Short Range Rainfall and NWM Guidance: 26-28 August 2017 » 3.2 Official Short Range NWM Products, 26-27 August 2017 » 3.2.1 Streamflow vs Streamflow Anomaly
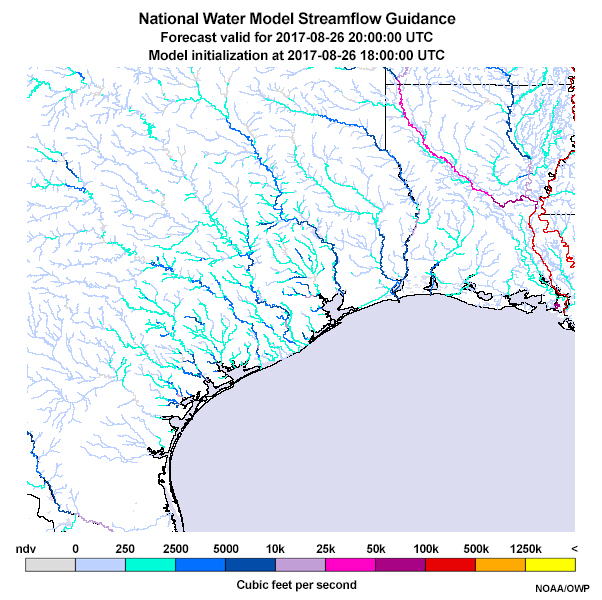
Short Range Streamflow
Short Range Streamflow Anomaly
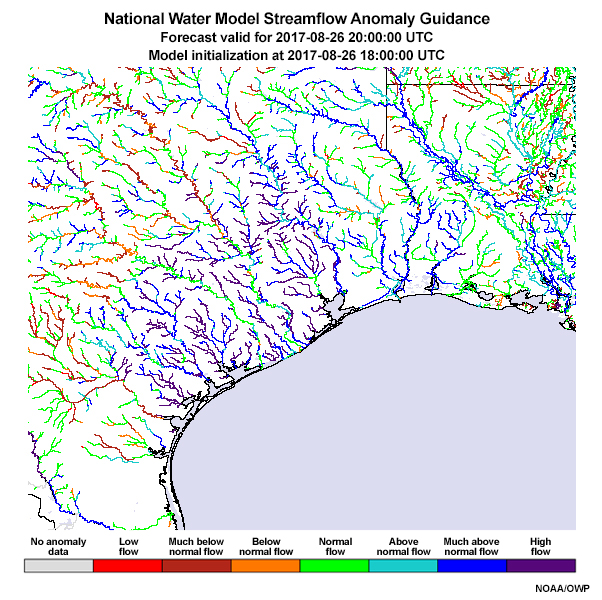
Review the streamflow and streamflow anomaly guidance from the NWM for the 17-hour period of 1900 UTC 26 August through 1200 UTC 27 August. Note the changes over the period for both products.
Question
Given the current thresholds used and the visual presentation of the Streamflow and Streamflow Anomaly products, which was better at showing a rate of change toward more water during the 18-hour period ending at 1200 UTC 27 August?
The correct answer is a.

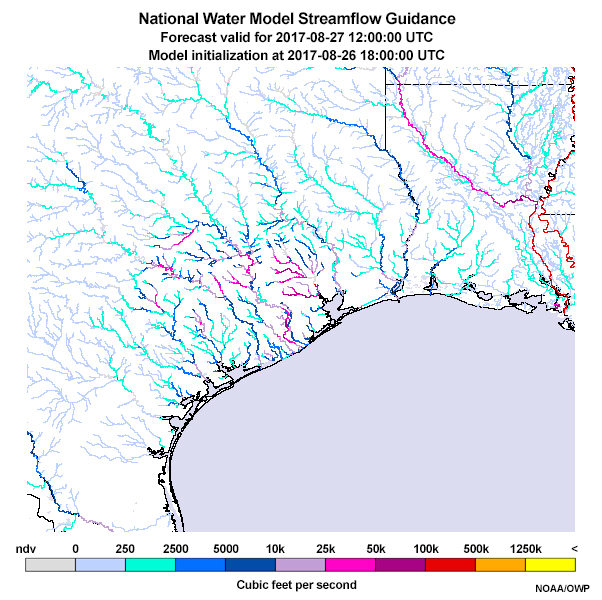
The streamflow product was more effective at showing the trend toward higher flows along the central and upper Gulf Coast of Texas, especially after 0600 UTC. Because many streams were already experiencing high flow at the start of this period, the streamflow anomaly product was not as useful in this time period given the current thresholds.
Question
Where is the area of greatest concern of a developing flood?
Use the yellow pen to indicate the channel with the greatest streamflow. Use the orange pen to indicate any area of increasing high flows.
| Tool: | Tool Size: | Color: |
|---|---|---|
|
|
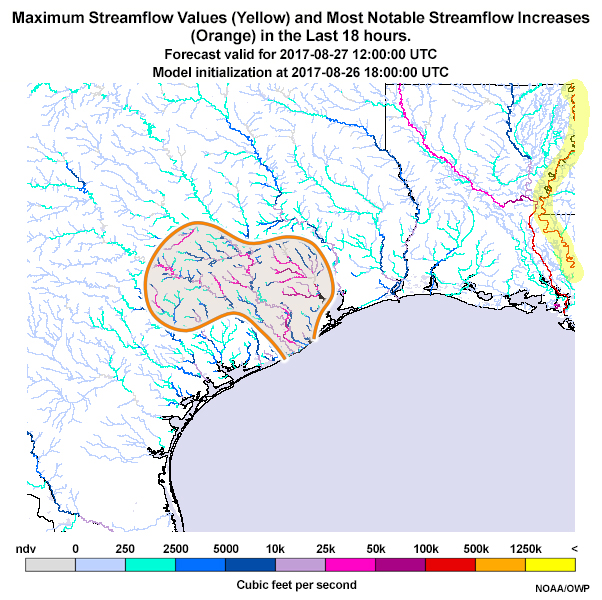
The Mississippi River on the far right side of this image has the highest flow (highlighted yellow). However, the Mississippi is normally a large-volume channel compared to other channels in this image, and in the time period for this forecast its streamflow and streamflow anomaly categories remained unchanged.
The orange-highlighted area is where the streamflow values increased most notably over the 18-hour forecast.
Question
Suggest additional information or product processing to use with the Streamflow Anomaly product that might make it more useful in this particular case.
The correct answers are b, d.
Answers b and d are the most correct. The streamflow anomaly product can be very useful for the analysis, short range, and medium range guidance because it provides a measure of the modeled flow relative to the long-term streamflow climatology. Its utility is limited in cases like the one shown because the high flow category is reached at all time steps even when the flow is increasing.
Among the possible solutions are increasing the number of streamflow anomaly categories, especially on the high end of the spectrum, or use with other complementary products. As the NWM product suite evolves there may be products such as the percent over bankfull.
3.0 Short Range Rainfall and NWM Guidance: 26-28 August 2017 » 3.3 Evolving Short Range NWM products (unofficial)
|
Products (not official) |
|---|
|
As with the medium range, a number of new short range products are being considered that will allow the NWM to provide accurate, timely, and actionable guidance across a range of situations. The products shown here are not official, but show promise in the testing and evaluation. Time to High Flow and Inundated Areas were also shown for the medium range, but the short range guidance is done with a finer time step and with HRRR QPF as one of the forcings.
3.0 Short Range Rainfall and NWM Guidance: 26-28 August 2017 » 3.3 Evolving Short Range NWM products (unofficial) » 3.3.1 Time to high flow
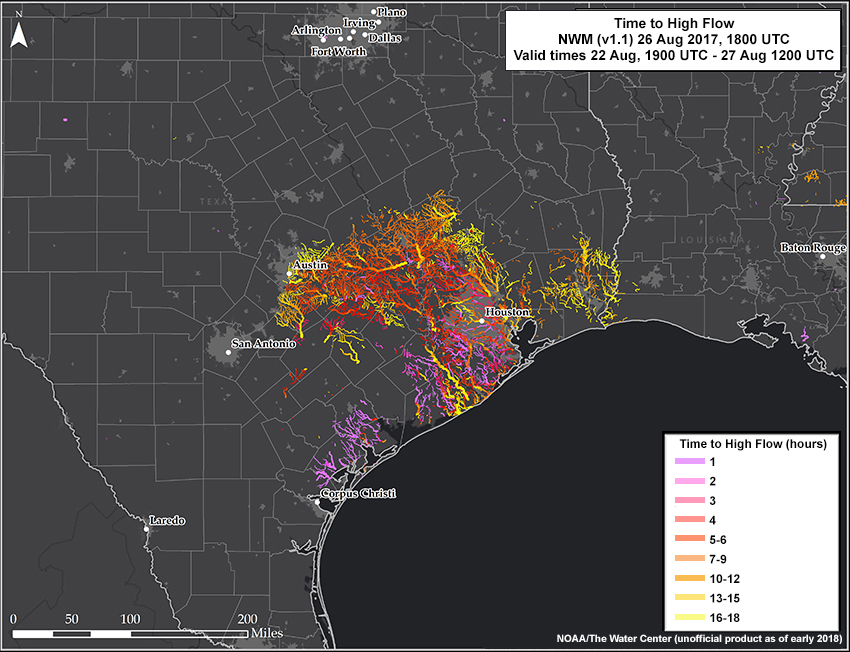
The Time to High Flow product shows the expected timing of high flow over an 18-hour period based on the NWM model using the hourly HRRR QPF (the 18-hour total was shown earlier). The purple colors are stream reaches expected to exceed high flow in less than two hours, while the yellows show reaches that may take 16-18 hours for high flow.
Here we have the Time to High Flow zoomed in an centered on Harris, Galveston, Brazoria, and Fort Bend counties. Information like this can help officials identify high-impact areas in a rapidly developing widespread event.
3.0 Short Range Rainfall and NWM Guidance: 26-28 August 2017 » 3.3 Evolving Short Range NWM products (unofficial) » 3.3.2 Inundated Areas
The short term inundated areas product depicts the maximum extent of inundation. It is derived using streamflow data from the NWM for the 18-hour period ending at 1200 UTC 27 August. Remember that the method used, the Height Above Nearest Drainage (HAND), represents inundation due to overbank flow from stream, but is not designed to capture overland flow and ponded water.
Short range inundation guidance valid 1200 UTC 27 August 2017
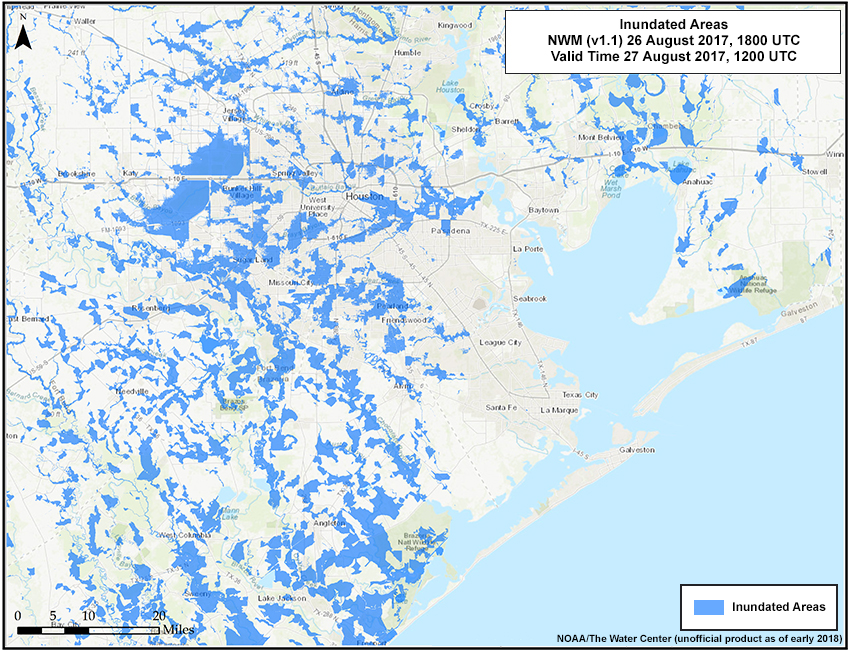
Medium range inundation guidance valid 1200 UTC 27 August 2017
Now let’s zoom in on the area around Galveston Bay and look at two different model run times for the inundation areas, both valid on 1200 UTC on 27 August. The first is based off streamflow using the short-term HRRR QPF, and the second is based off the 5-day GFS QPF that we looked at earlier. You can see changes between the two, but a general tendency for greater inundation west of Galveston Bay associated with the more intense short-term QPF.
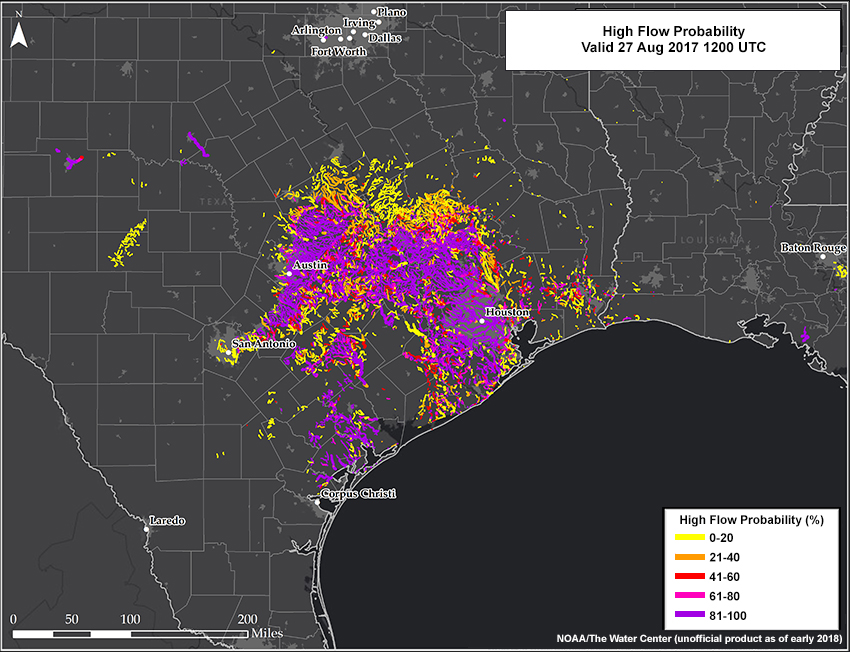
3.0 Short Range Rainfall and NWM Guidance: 26-28 August 2017 » 3.3 Evolving Short Range NWM products (unofficial) » 3.3.3 High Flow Probability
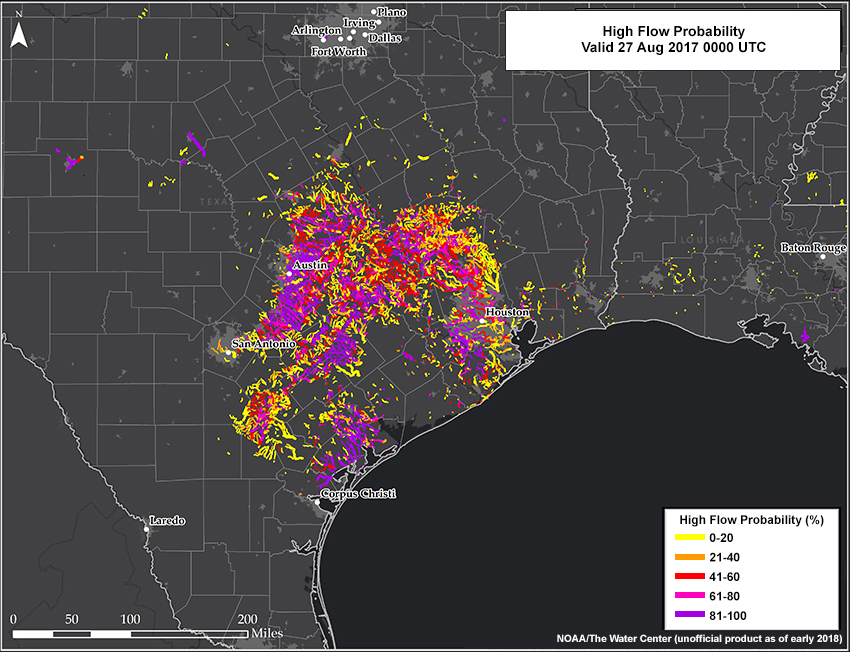
The short-term High Flow Probability shows the probability of exceeding a high flow threshold. The image slider shows this product for valid times of 0000 UTC and 1200 UTC on 27 August. This product is based on a time-lagged ensemble. Therefore the guidance is based on QPF for the current and several past runs of the HRRR model.
3.0 Short Range Rainfall and NWM Guidance: 26-28 August 2017 » 3.4 Analyses
Analyses from the NWM offers the same official products, spatial resolution, and hourly time steps as the short-range guidance. Analyses cover the period from 3 hours before the current time to the current time and use input from the Multi Radar Multi Sensor (MRMS) Quantitative Precipitation Estimation (QPE) along with information from the HRRR and the RAP models. The analysis assimilates about 7000 observations from the United States Geological Survey (USGS).
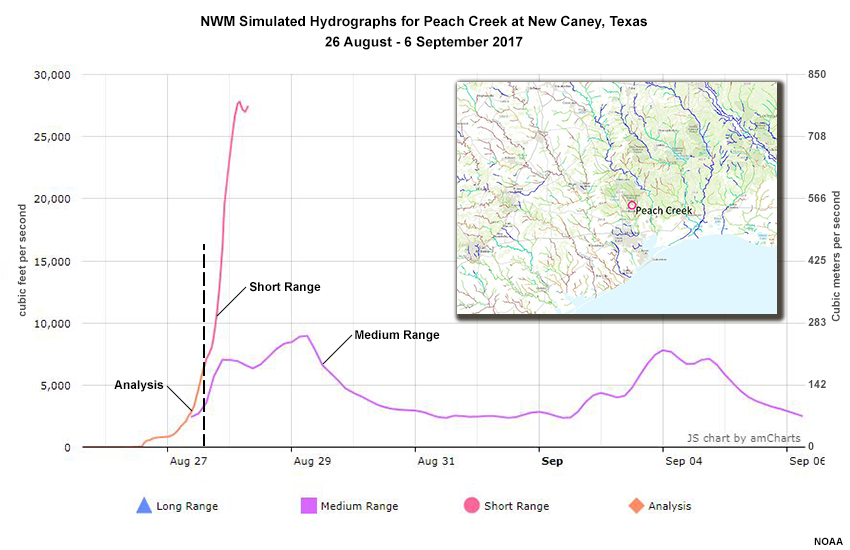
Here is an example of a simulated hydrograph that shows the analysis, short, and medium range periods for Peach Creek near New Caney (in the northern part of the Houston area). The analysis (the orange trace) show a rapid increase in flow through the morning of 27 August. The pink trace shows the continuation of the rise by the short range forecast. The peak discharge ended up being over 21,000 cfs (>590 cms) very early on 28 August, similar to the short range forecast.
Question
Why is the purple trace (medium range) less dramatic than the short range trace on the Peach Creek hydrograph?
The correct answer is a.
There could be several reasons for the differences between short and medium range, but answer a, differences in QPF forcing, is likely a very influential one. The medium range uses QPF from the GFS and the short range uses HRRR QPF.
4.0 Development, Implementation, Evolution
4.0 Development, Implementation, Evolution » 4.1 NWM as of early 2018
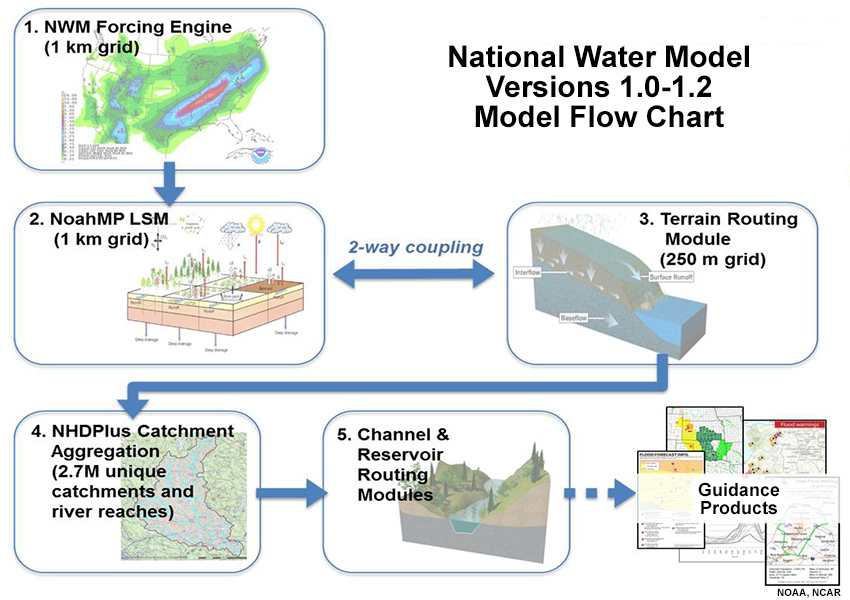
Now that you have seen output during an historic hydrologic event, you may wonder how the NWM came about and who continues to work on its evolution. The NWM (and the models within it) is run operationally by the National Oceanic and Atmospheric Administration (NOAA) using a supercomputer in order to provide hydrologic guidance in a time frame that can support decision making. It is based on the Weather Research and Forecasting hydrologic model (WRF-hydro) developed at the National Center for Atmospheric Research (NCAR). Continued community development and enhancement is a collaborative effort with NOAA, NCAR, the Consortium of Universities for the Advancement of Hydrologic Sciences, Inc. (CUAHSI), the National Science Foundation (NSF), and other partners in academia and federal agencies.
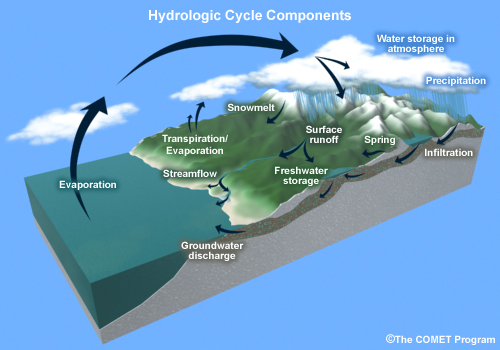
The NWM simulates all of the important processes in the water cycle and uses existing and emerging high-resolution datasets that describe the complex set of surface and subsurface hydrologic processes. In this way the NWM represents complex interrelated processes that drive snowmelt, infiltration, runoff, and evaporation, and how these processes can vary greatly over short distances and time steps.
4.0 Development, Implementation, Evolution » 4.2 Evolution beyond AHPS
Decision support activity related to water issues will benefit from the NWM due to the greatly increased number of locations that receive water-related guidance, including ungauged basins.
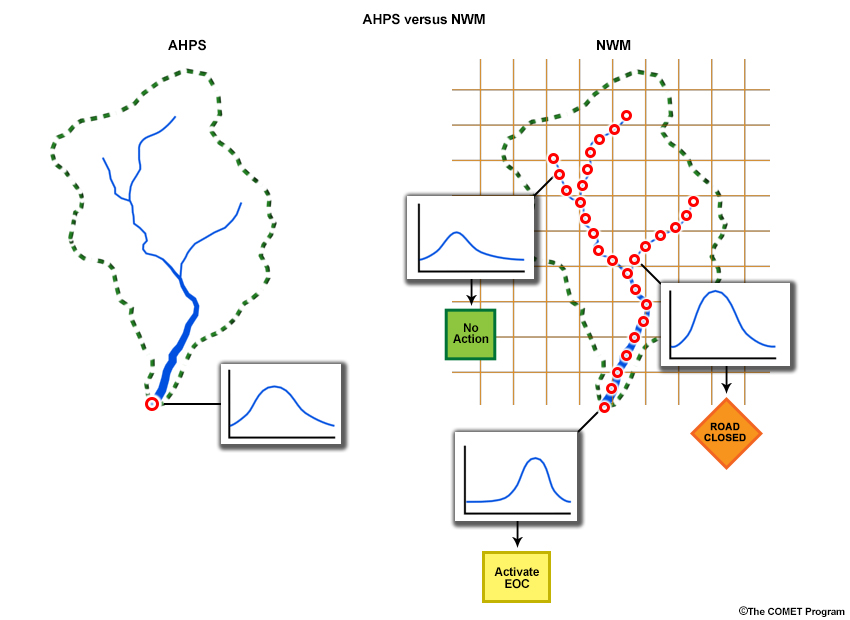
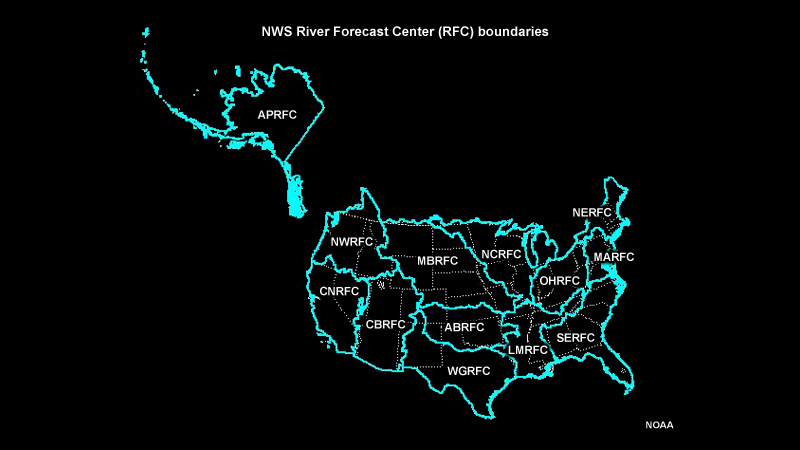
NWS River Forecast Centers (RFCs) have roughly 4000 forecast locations currently available from the Advanced Hydrologic Prediction Service (AHPS). These are typically associated with hydrologic forecasts at the outlet of lumped basins. With NWM roughly 2.7 million guidance locations will be available to RFC forecasters assisting with the generation of hydrological guidance within a basin and for small, rapid-response basins. Decision support activity will benefit from the connection of hydrologic guidance to suggested actions such as evacuations, road closures, reservoir draw-downs, and other street level impacts.
|
AHPS |
NWM |
|---|---|
|
~4000 forecast locations |
~2.7 million guidance locations |
|
Forecast river discharge/stage |
Forecast all hydrologic parameters that define the water budget |
|
Large catchments, lumped models |
High resolution, gridded land and routed water NHDPlus Streamflow (reaches and catchments) |
|
Average basin size ~420 mi2 |
Average basin size ~1 mi2 |
|
Impact-based forecasts at selected points |
Predictions linked with detailed local infrastructure data to communicate street level impact |
|
13 River Forecast Centers each developing local versions of model |
NOAA and partners (federal partners and academia) developing a consistent community-based model |
The table summarizes NWM benefits versus those from AHPS.
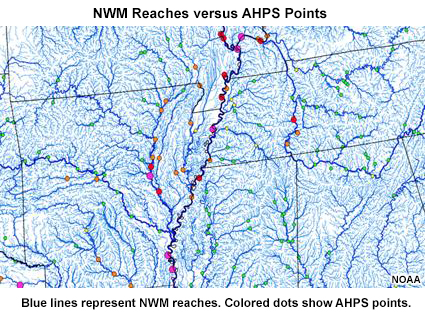
In this image showing part of the lower Mississippi basin you can see the increased amount of guidance locations (blue) versus the AHPS points (shown as dots colored by stage category).
5.0 Summary
Use the drop down menus to fill in the NWM table.
See correct answers in the table.
As of early 2018 the NWM products include streamflow, streamflow anomaly, soil moisture (percent saturation of top 40 cm), and simulated hydrographs for both gauged and ungauged stream reaches. Other variables such as snow water equivalent, surface runoff, and evaporation are being generated by the model as well.
Evolving products that are not part of the official guidance from NWM include Time to High Flow, Inundation Areas, Peak Flow, and Percent over Bankfull. Probabilistic guidance, such as High Flow Probability, is not part of the official suite of NWM products as of early 2018. However, prototypes have been developed and tested.
The National Water Model, run by NOAA’s National Weather Service, is the foundation for nationwide integrated water predictive capabilities. Its goal is to provide a foundation for sustained growth in nationally consistent operational hydrologic forecasting. With it the forecasting and user community can:
- Use one unified model for all scales of hydrologic events across the United States
- Use temporally and spatially continuous guidance about river conditions and hydrologic states
- Simulate all parts of the water cycle
- Generate guidance for 2.7 million locations, including ungauged streams
- Partner with other agencies to support their activity
Within the Community Hydrologic Prediction System (CHPS) used by the RFCs the NWM is expected to be one of a selection of hydrologic models that can be used by NWS River Forecast Centers to provide timely and actionable guidance regarding the nation’s water courses.
You have reached the end of the lesson. Please complete the quiz and share your feedback with us via the user survey.
Appendix A
The term “high flow” was used in several guidance products in this training. As of NWM version 1.1 the definition of high flow is still evolving. We asked some questions to experts at the NOAA National Water Center. Here are the responses as of 9 February 2018.
1. How is “high flow” defined?
We have been using a couple thresholds to define "high flow". Initial method referenced average annual flow as defined by the NHDPlus EROM dataset. We took a deviation from NHDPlus average annual flow and referred to that as "high flow".
Initial "High Flow" threshold: Log (simulated flow at reach) - Log (annual average flow at reach) > 4
This method was primarily used as a proof of concept so we have shifted to using the 1.5-year recurrence flow derived from the NWM v1.0 retrospective dataset (23+ of reanalysis). We are working to validate and refine these "high flow" estimates. As part of NWM development project, looking to derive channel geometries for the whole domain to estimate "bankfull" flows.
2. Is the definition of “high flow” stable, or still evolving?
See above. Definition is still evolving.
3. Is the “high flow” threshold used consistently for the different guidance (Time to High Flow, High Flow Probability, and the high flow category in the Streamflow Anomaly)?
Last week, we were finally able to align both our Time to High Flow and High Flow Probability maps to reference the 1.5 year recurrence flow. For the images you have we used the 1.5 recurrence flow for the Time to High Flow map and the EROM average annual flow for the High Flow Probability.
The anomaly map is a different story because it's not necessarily a "flood" focused map. The anomaly map is conveying whether the simulated flow is high or low for that particular time of year. It's very much possible to see "high flow" on the anomaly map even though the flow is within the channel's banks. To convey a flow anomaly, we used the NHDPlus EROM average monthly flow estimates and took deviations from that to map each anomaly category. All the anomaly images you have use this definition.
This anomaly definition will evolve soon. We're looking into using 7-day average flow percentiles for each calendar day to define the anomaly categories (like the USGS WaterWatch map). We would use the NWM retrospective dataset to derive these percentiles.
References
From NOAA’s Offices of Water Prediction, read more about the NWM and view imagery: http://www.water.noaa.gov/
From NCAR’s Regional Application Program (RAL): https://www.ral.ucar.edu/projects/wrf_hydro
From American Water Resources Association (AWRA): http://www.nxtbook.com/naylor/AWRAS/AWRAS0118/index.php#/10
The following are related to the Height Above Nearest Drainage (HAND) method used in the NWM inundation guidance:
Nobre, A. D., L. A. Cuartas, M. Hodnett, C. D. Rennó, G. Rodrigues, A. Silveira, M. Waterloo and S. Saleska, 2011. Height Above the Nearest Drainage – a hydrologically relevant new terrain model. Journal of Hydrology, 404(1–2): 13-29. DOI: 10.1016/j.jhydrol.2011.03.051
Contributors
COMET Sponsors
MetEd and the COMET® Program are a part of the University Corporation for Atmospheric Research's (UCAR's) Community Programs (UCP) and are sponsored by NOAA's National Weather Service (NWS), with additional funding by:
- Bureau of Meteorology of Australia (BoM)
- Bureau of Reclamation, United States Department of the Interior
- European Organisation for the Exploitation of Meteorological Satellites (EUMETSAT)
- Meteorological Service of Canada (MSC)
- NOAA's National Environmental Satellite, Data and Information Service (NESDIS)
- NOAA's National Geodetic Survey (NGS)
- National Science Foundation (NSF)
- Naval Meteorology and Oceanography Command (NMOC)
- U.S. Army Corps of Engineers (USACE)
To learn more about us, please visit the COMET website.
Project Contributors
Project Oversight
- Matt Kelsch – UCAR/COMET
Project Lead
- Matt Kelsch – UCAR/COMET
Instructional Design
- Alan Bol – UCAR/COMET
Primary Science Advisors
- Brian Cosgrove – NOAA/NWS
- David Gochis – NCAR
Contributing Science Advisors
- Taylor Dixon – NOAA/NWS
- Aubrey Dugger – NCAR
- Chad Kahler – NOAA/NWS
- Scott Lindsey – NOAA/NWS
- Alison Macneil – NOAA/NWS
- Fernando Salas – NOAA/NWS
- Monica Stone – NOAA/NWS
Graphics/Animations
- Steve Deyo – UCAR/COMET
Multimedia Authoring/Interface Design
- Gary Pacheco – UCAR/COMET
Audio/Video Editing/Production
- Gary Pacheco – UCAR/COMET
- David Russi – UCAR/COMET
Audio Narration
- Matt Kelsch – UCAR/COMET
COMET Staff, March 2018
Director's Office
- Dr. Elizabeth Mulvihill Page, Director
- Tim Alberta, Assistant Director Operations and IT
- Paul Kucera, Assistant Director International Programs
Business Administration
- Lorrie Alberta, Administrator
- Auliya McCauley-Hartner, Administrative Assistant
- Tara Torres, Program Coordinator
IT Services
- Bob Bubon, Systems Administrator
- Joshua Hepp, Student Assistant
- Joey Rener, Software Engineer
- Malte Winkler, Software Engineer
Instructional Services
- Dr. Alan Bol, Scientist/Instructional Designer
- Tsvetomir Ross-Lazarov, Instructional Designer
International Programs
- Rosario Alfaro Ocampo, Translator/Meteorologist
- David Russi, Translations Coordinator
- Martin Steinson, Project Manager
Production and Media Services
- Steve Deyo, Graphic and 3D Designer
- Dolores Kiessling, Software Engineer
- Gary Pacheco, Web Designer and Developer
- Sylvia Quesada, Production Assistant
Science Group
- Dr. William Bua, Meteorologist
- Patrick Dills, Meteorologist
- Bryan Guarente, Instructional Designer/Meteorologist
- Matthew Kelsch, Hydrometeorologist
- Erin Regan, Student Assistant
- Andrea Smith, Meteorologist
- Amy Stevermer, Meteorologist
- Vanessa Vincente, Meteorologist