The Quasi-geostrophic (QG) Vorticity Equation represents a method for forecasting mid-latitude synoptic-scale geostrophic vorticity. In the absence of diabatic processes, it implies that geostrophic vorticity can be calculated from the advection of geostrophic vorticity and the change of vertical motion due to convergence. It is a powerful conceptual tool for meteorologists because its terms are straightforward to interpret physically.
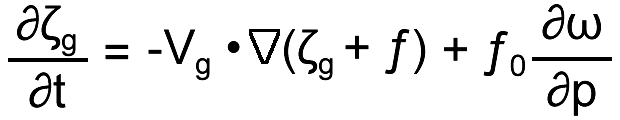
The adiabatic form of the QG Vorticity Equation (QGVE) is presented below:
This QG vorticity equation learning tool is based on a simple, two-level model of the atmosphere in the mid-latitudes and is based on the methods found in T. N. Carlson's "Mid-latitude Weather Systems" on pages 268-275 or in J. Holton's "An Introduction to Dynamic Meteorology" on pages 166-170.
This widget enables the user to visually interpret the mathematical terms in this equation.
The left-hand side (LHS) term is the change in geostrophic vorticity over time.
The first right-hand side (RHS) term represents absolute vorticity advection by the geostrophic wind.
The second RHS term is the stretching of planetary vorticity.
The 1000hPa height distribution is specified and is sinusoidal in x and y. This represents an idealised wave-train of circular High and Low pressure systems, with wavelength 4000km.
The thermal distribution is represented by the 1000-500hPa thickness where the direction of isotherms is assumed to be constant with height. The user can specify either a zonal thickness pattern, or a sinusoidal thickness pattern whose position relative to the 1000hPa pattern can be varied.
The 500hPa height distribution is determined from the 1000hPa height and 1000-500hPa thickness.
The vorticity distribution will change depending upon the offset of the 1000hPa heights and 1000-500hPa thickness fields that is selected by the user.
The impact of the RHS forcing terms can be visualised separately and overlaid to asses their contribution to the vorticity over time.
In this learning tool, we will assume that both the 500hPa height and 1000-500hPa thickness pattern behave like sinusoidal waves. Depending on the phase of the 500hPa height and 1000-500hPa thickness patterns with each other, the vorticity pattern will intensify or weaken. Explore the relationship between 500hPa heights, 1000-500hPa thickness and vorticity.