1.0 Introduction » 1.1 Overview
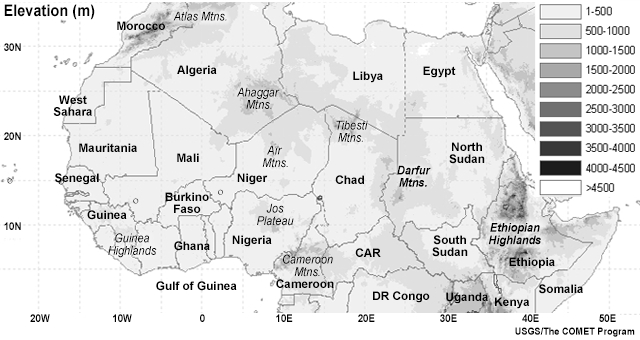
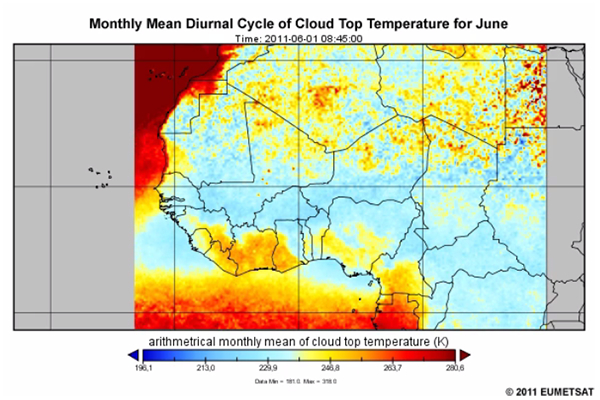
A weather forecaster’s knowledge of climatology is important to the success of a forecast, particularly for the initiation and/or decay of the weather phenomenon. This is particularly true for convective systems over Central and West Africa, where convection has a strong diurnal cycle and usually develops over particular geographic regions, such as high terrain and coastal regions (see map), and during specific time intervals.
Instability indices derived from conventional upper air observations, such as radiosonde profiles, are important to forecasting convection, particularly in the short range. However, the lack of upper-air data over most of Central and West Africa limits the use of these products for forecasting convection. Fortunately, similar information can be obtained from satellite-derived instability indices made from EUMETSAT’s Meteosat satellite series. These products, which are the focus of this lesson, can be used to assess the instability potential for convective development, particularly in the short range (2 to 12 hours).
1.0 Introduction » 1.2 About the Lesson
This lesson is aimed at weather forecasters and meteorology students who work in West and Central Africa or are interested in the area’s weather and/or climatology.
The lesson describes satellite-derived cloud climatology and instability indices that can be integrated with other satellite imagery, synoptic observations, and numerical weather prediction (NWP) products to forecast convection from initiation to decay. These products are particularly important at the start of the rainy season when some of the West Africa Monsoon (WAM) features are not well established.
Despite the existence of various satellite-derived cloud climatologies, forecasters in the region rarely have access to this information. Even when such information is available, there’s little training on how to effectively use the data and products. This lesson addresses this need by introducing the products and showing where they fit in the process of forecasting convection.
After going through the lesson, learners will be able to:
- Use cloud climatology to identify areas and time periods most prone to convective initiation and decay, and the periods of maximum convection over Central and West Africa
- Describe MPEF products used for monitoring convective development
- Describe a process for integrating cloud climatology products and global instability indices with otherdata to monitor and forecast convection throughout its lifecycle
To get the most out of the lesson, learners should be familiar with tropical convective weather systems and their forecast processes, and satellite image interpretation.
A few notes about the climatology products presented in the lesson:
- We use examples of cloud fractional coverage, cloud top temperature, and cloud top height climatology products from particular months of the year. But the full suite of monthly products are available at the end of the lesson, in Section 5
- The climatology products presented in the lesson are based on eight years of data, from 2004 to 2011
2.0 Satellite-Derived Climatological Products
2.0 Satellite-Derived Climatological Products » 2.1 Overview
The EUMETSAT Satellite Application Facility on Climate Monitoring (CM SAF) generates Climate Data Records derived from operational meteorological satellites.
The CM SAF has released a series of data sets on cloud properties known as CLAAS v1.0 (the CM SAF cloud property dataset using SEVIRI). As of 2015, these data sets are based on eight years of SEVIRI measurements, from 2004 to 2011, and cover various cloud parameters.
In this lesson, we will use the monthly mean diurnal cycle of cloud data to identify areas over West and Central Africa that are more prone to convective initiation based on the time of the day and the cycle of the rainy season (beginning, middle, and end).
These cloud climatology products include:
- Cloud Fractional Cover (CFC)
- Cloud Type (CTY)
- Cloud Top Products (CTO) including Cloud Top Temperature (CTT) and Cloud Top Height (CTH), and Cloud Top Pressure (CTP); note that the latter is not covered in the lesson
The time resolution of these MSG-derived cloud products ranges from daily and monthly mean values to the monthly mean diurnal cycle. The latter is obtained by computing the monthly mean for a given MSG time slot for all days. This is then repeated for all time slots per day.
Question
Which climatology product is best suited for studying the diurnal cycle of convective activities?
The correct answer is d.
The monthly mean diurnal cycle gives a good indication about the typical initiation, growth, and decay of convective systems during each time of the day of a given month. That is, it shows the longterm average of the daily cycle or a "typical" daily cycle of a given months.
The monthly mean diurnal cycle gives a good indication about the typical initiation, growth, and decay of convective systems during each day of a given month. By examining the changing pattern of the cloud products, forecasters learn what areas and time slots are prone to convective initiation and the cycles of shallow and deep convection.
On the following pages, we will describe the cloud climatology products in more detail.
2.0 Satellite-Derived Climatological Products » 2.2 Cloud Fractional Cover (CFC)
One of the first steps in finding areas of convection is to identify cloudy areas. Forecasters can identify cloudy regions using the Cloud Fractional Cover or CFC.

The CFC is defined as the fraction of cloudy pixels per sub-region compared to the total number of analyzed pixels in that sub-region. For the SEVIRI instrument on the MSG satellites, the CFC is computed as the cloudy fraction of all pixels within a 15x15 km grid square. Fractional cloud cover is expressed in percent.
Question 1
According to this definition, the CFC product cannot be used to estimate the amount of specific cloud types, such as low, medium or high clouds.
The correct answer is a.
The CFC is an estimation of the amount of all clouds occupying a portion of the given area, irrespective of cloud type.
Question 2
How do you expect the CFC to compare over the ocean vs. land, particularly in the tropics? The CFC is slightly _____ over the ocean compared to the continent.
The correct answer is a.
Although cloud detection is easier over the ocean, CFC may be overestimated by as much as 10% over ocean surfaces. Over tropical Africa, SEVIRI CFC is about 30% lower than the human (SYNOP) observations. However, the underestimation is less pronounced during the rainy season although it can still reach remarkable values.
2.0 Satellite-Derived Climatological Products » 2.3 Cloud Type (CTY)
You can gain more information about the presence and/or life cycle of convection by identifying the cloud types using the Cloud Type (CTY) product.
This product separates cloud scenes seen by the satellite into five components: low clouds, middle-level clouds, high opaque clouds, high semitransparent clouds, and fractional clouds.
Infrared brightness temperatures are used to vertically separate thick clouds. Ice clouds are identified using reflectance at near infrared channels, such as IR 1.6 and 3.9 μm. Thin clouds are identified using transmission differences revealed by measurements in infrared channels (IR 3.9, 8.7, 11.8, and 12.0 μm). Fractional clouds describes cloud-contaminated (partly cloudy) pixels where the cloud altitude cannot be uniquely defined.
Question
Which do you think can affect the ability to separate different cloud types from geostationary satellite data?
The correct answers are a, b, d.
Validation studies show that the ability to separate cloud types and surface types varies with seasons, illumination conditions, and the satellite viewing geometry. The main limitation is the lack of visible measurements at night, which makes it, for example, impossible to detect snow cover on the ground. Very low ground temperatures can also cause problems. This generally means that CTY results are more reliable during warmer seasons and daylight.
When using CTY products, be aware that:
- Very thin cirrus may be classified as fractional clouds
- Very low clouds may be classified as medium clouds in the case of strong thermal inversions
- Low clouds surmounted by thin cirrus may be classified as medium clouds
2.0 Satellite-Derived Climatological Products » 2.4 Cloud Top Products (CTO)
The life cycle of convection can be discovered by analyzing changes in the vertical extent of a particular cloud type. For example, an ordinary thunderstorm lifecycle has shallow cumulus growing to towering cumulus, then ice-topped cumulonimbus, and finally cirrus anvil and decay.
The cloud top information (CTO) is expressed in three ways that provide the same information about the altitude of the clouds detected, just in different units.
- Cloud Top Pressure (CTP) is in hectopascal
- The geometrical Cloud Top Height (CTH) is in meters
- The Cloud Top Temperature (CTT) is in Kelvin
Note that the observed IR brightness temperature is used to determine cloud top temperature from which cloud top pressure and cloud top height are inferred using an atmospheric profile that relates temperature to pressure and height. The atmospheric profile is based on numerical model analysis, specifically the ERA-Interim analyses.
The CTO product is derived using two algorithms, one for opaque and one for fractional and semitransparent clouds. The CTT, CTH, and CTP are retrieved by first classifying the cloudy pixels into three classes depending on cloud type or its opacity: first, very low, low or medium thick as well as middle level clouds; second, high opaque clouds; and third, high semi-transparent clouds.
The CTO products help us understand the properties of convection, although they have some limitations. Since they are determined using the reference profiles available from the ERA-Interim dataset, the quality of the CTO product depends to some extent on the quality of the reference vertical profiles of temperature and moisture taken from NWP model analyses. Treating situations with temperature inversions is especially troublesome since it implies that there are several solutions to the problem of matching measured cloud top temperatures to vertical reference profiles.
Other major limitations of the CTO include the following:
- Optically very thin clouds may not be detected at all
- Clouds interpreted as being opaque are, in reality, often diffuse or multi-layered in their upper portions; this often leads to an underestimation of the true cloud top of up to 2000 m
- Cloud top pressure is erroneous if clouds were assigned a wrong type; this can result, for example, in an underestimation of cloud top height/pressure for semi-transparent clouds classified as low/medium, or an overestimation of cloud top height/pressure for low/medium clouds classified as semi-transparent
2.0 Satellite-Derived Climatological Products » 2.5 Seasonal Cycle of Convection: Monthly Mean Cloud Products
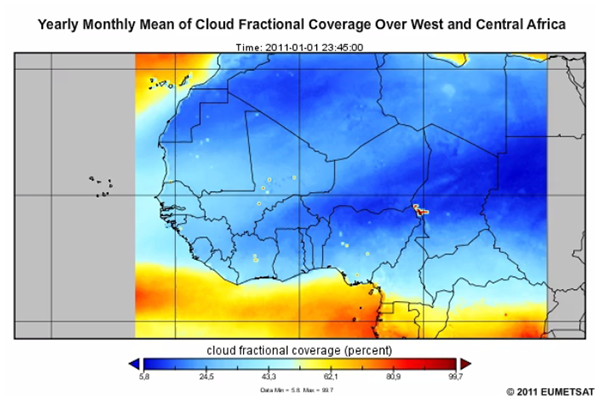
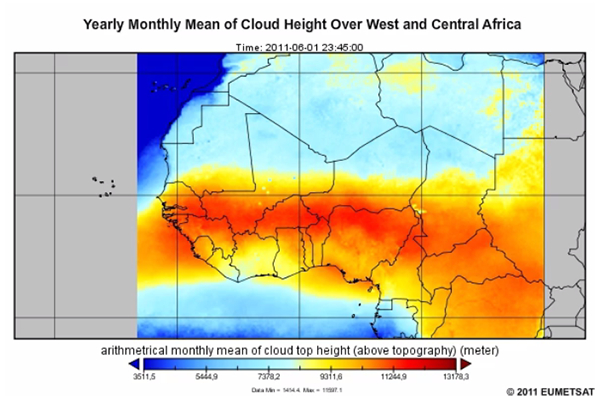
The movement of convection through the year can be tracked using the monthly mean cloud products. These products show the zones where convection is expected to be in a given month.
Review the topographic map and the two yearly monthly mean cloud products animations, then answer the question below.
Question
Which of the following statements are true?
The correct answers are a, b, c.
Maximum cloud cover occurs during August, the peak of the rainy season over the Sahel and most parts of Central Africa when convection is most frequent and intense. The highest cloud cover over the Sahel (50% or greater) is observed in August.
Mountain ranges, such as Fouta-Djalon, Jos Plateau, Mont Cameroun, and Adamawa Mountains, Central Africa Republic (CAR) and Democratic Republic of Congo (DRC), have maximum cloud cover (70% or more) in August.
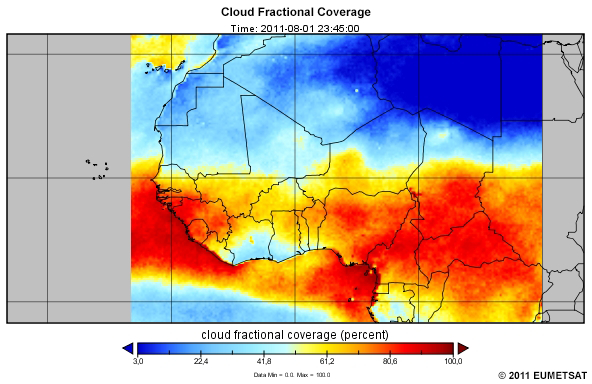
The Cloud Fractional Coverage (CFC) and Cloud Height (CTH) animations clearly show the northward advance and southward retreat of the convective cloud band associated with the movement of the ITCZ.
The ITCZ reaches its southernmost position in December and January, when cloud cover and the vertical extension of the clouds over the area are at their minimum.
Note the secondary minimum cloud cover and cloud heights over Equatorial Central Africa in July.
The period from July to August is the little dry season over the Gulf of Guinea. Convection is inhibited because of the extension of the influence of the St. Helena High over the area, with stratiform clouds causing overcast skies.
2.0 Satellite-Derived Climatological Products » 2.6 Monthly Mean Diurnal Cycle Cloud Products
Knowledge of the mean diurnal cycle of convection is a powerful aid to forecasting convection on a given day. The monthly mean diurnal cycle (MMDC) cloud products give forecasters a mental model of where and when convection typically initiates, matures, and decays.
In this section, we will focus on the mean diurnal cycle in August since it was identified earlier from the seasonal cycle products as the month with the maximum cloud cover and most intense convection. Note that the diurnal cycle or 24-hour day is subdivided into eight categories: early morning, late morning, midday, early afternoon, late afternoon, early night, midnight, and late night.
You can use the same approach to study the diurnal cycle of convection for other months using the animations provided in Section 5 of the lesson.
Note that all of the climatology products and animations in the lesson are based on eight years of data, from 2004 to 2011.
2.0 Satellite-Derived Climatological Products » 2.6 Monthly Mean Diurnal Cycle Cloud Products » 2.6.1 CFC Monthly Mean Diurnal Cycle
Question
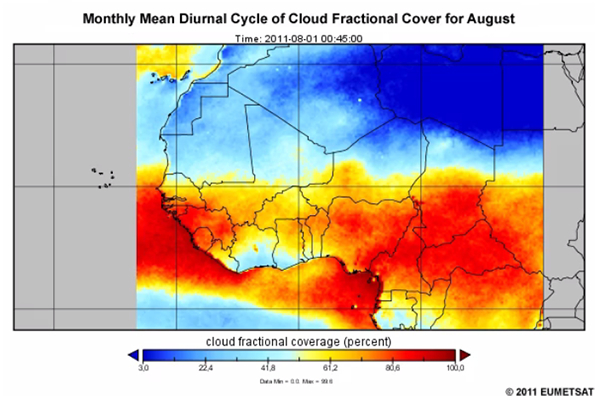
View the animation of the Monthly Mean Diurnal Cycle of the Cloud Fractional Coverage (CFC) for August. Then decide which statement is true.
The correct answer is d.
The animation shows that the time of the maximum cloud cover varies from area to area.
2.0 Satellite-Derived Climatological Products » 2.6 Monthly Mean Diurnal Cycle Cloud Products » 2.6.2 MMDC Summary for August
The table summarizes the period of maximum cloud cover per area during August. Remember that the times and areas vary by month. Note that the double x’s are periods with the absolute maximum cloud cover.
Area |
Time of maximum cloud cover in West and Central Africa by area |
|||||||
Early Morning |
Late Morning |
Midday |
Early Afternoon |
Late Afternoon |
Early Night |
Midnight |
Late Night |
|
Gulf of Guinea |
xx |
x |
||||||
Central Africa |
x |
x |
xx |
x |
||||
Sahel |
x |
x |
xx |
|||||
Sahara Fringes |
x |
xx |
x |
|||||
The Cloud Fractional Coverage (CFC) shows a strong diurnal cycle and the importance of the high terrain in triggering cloud formation in the early afternoon hours. That’s indicated by the high CFC over the Air Mountains, Fouta Jalon, Jos Plateau, Mount Cameroun, Adamawa Mountains, Central Africa Republic, and Democratic Republic of Congo.
The highest oceanic CFCs are in the pre-dawn/early morning hours in two areas:
- Offshore from Cameroon, where the sharply curved coastline enhances moisture convergence
- Southwest of Guinea, where westerly winds are converging and bringing low-level moisture to the area
2.0 Satellite-Derived Climatological Products » 2.6 Monthly Mean Diurnal Cycle Cloud Products » 2.6.3 MMDC for August in the Sahel
For the Sahel, notice the westward expansion in Cloud Fractional Coverage (CFC) maxima that initiate near the high terrain. This indicates that convection is growing and propagating westward.

As noted earlier, the CFC does not provide information about cloud type and the vertical extent of clouds. For example, from the CFC alone, 1900 UTC stands out as a minimum in total cloud cover. Does that mean that convection is less intense or decaying during the late afternoon? Does the CFC maximum over the coast of Guinea in the late morning indicate that intense convection is happening at that time?
Also recall that CFC can significantly underestimate cloud fraction over tropical Africa. Therefore, you need more information to gain a more complete picture of the cycle of convection.
2.0 Satellite-Derived Climatological Products » 2.6 Monthly Mean Diurnal Cycle Cloud Products » 2.6.4 Monthly Mean Diurnal Cycle of Cloud Height (CTH)
The diurnal evolution of cloud height (CTH) helps to distinguish shallow and deep convection. It also helps to determine the stages of convection: growing, mature, and decaying. For example, mature organized convective systems have higher cloud tops than convection in the early stages of the system lifecycle.
View the animation of the Monthly Mean Diurnal Cycle (MMDC) of cloud height (CTH) for August, then answer then answer the question below.
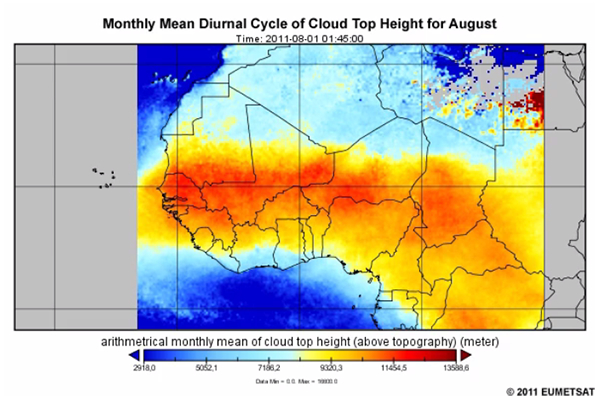
Question
According to the diurnal cycle of the CTH, when are clouds with great vertical extent prevalent in August?
The correct answers are d, e.
While the lowest cloud heights are observed during the morning hours, the cloud top heights increase progressively from the early afternoon and reach their maximum values (12,000m or greater) in the late afternoon.
Unlike the CFC, which shows a broad minimum in the late afternoon, the CTH shows large areas of convective clouds with great vertical extent. These high CTH values persist during the early night before starting to decrease around midnight. As we saw with the CFC product, areas of high CTH shift towards the west after initiating near the high terrain, indicating the presence of propagating convective systems.
Note that the Gulf of Guinea is invaded by low- and medium-level clouds whose tops hardly exceed 6,000m. Again, the relatively low cloud top height over the Gulf of Guinea in August is a mark of the little dry season, when convection is strongly inhibited over the area because of high pressure and cold upwelling. While the monthly mean product showed the prevalence of low clouds (fog/low stratus), the diurnal cycle product is much more useful since it shows what time of day to expect these low clouds, which can limit visibility.
2.0 Satellite-Derived Climatological Products » 2.6 Monthly Mean Diurnal Cycle Cloud Products » 2.6.5 MMDC Product Summary
Question
Which statement best summarizes the Monthly Mean Diurnal Cycle products?
The correct answer is a.
The cloud products show a strong diurnal cycle in the development of convection in Central and West Africa.
Orography plays a dominant role in the diurnal cycle of convection as indicated by the early and deep cloud development over high terrain compared with surrounding areas.
Diurnal cloud climatologies show that areas of deep convection grow and decay while propagating westward over West and Central Africa.
During the peak of the rainy season, deep convection is generally inhibited along the Gulf of Guinea coast. The early morning peak in cloud fraction peak is due to low, shallow clouds. Deeper clouds are found along the Cameroon coast due to convergence enhanced by the coastal curvature.
Convective activity is generally more widespread over Central Africa compared with the western part of the continent.
2.0 Satellite-Derived Climatological Products » 2.6 Monthly Mean Diurnal Cycle Cloud Products » 2.6.6 Annual CTH
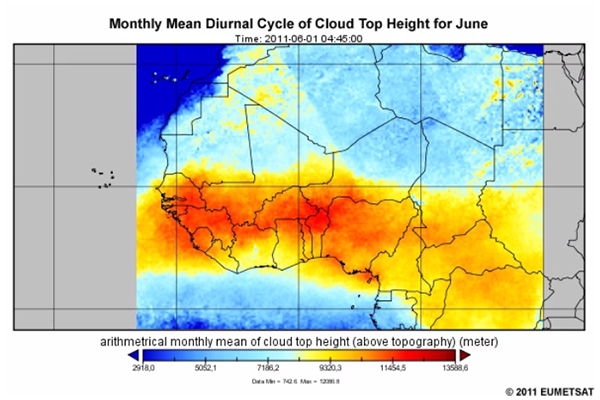
View the cloud height (CTH) animation for the other months of the year, observing the monthly variations in the diurnal cycle of convective activities.
2.0 Satellite-Derived Climatological Products » 2.6 Monthly Mean Diurnal Cycle Cloud Products » 2.6.7 Diurnal Cycle of Convection for June
Now we’ll look at the diurnal cycle of several cloud climatology products for June, a pre-monsoon period in the Sahel. View the animations, integrating the information to determine the time of convective initiation and maximum convection for three areas: the Gulf of Guinea, Central Africa, and the Sahel. Then answer the questions below.
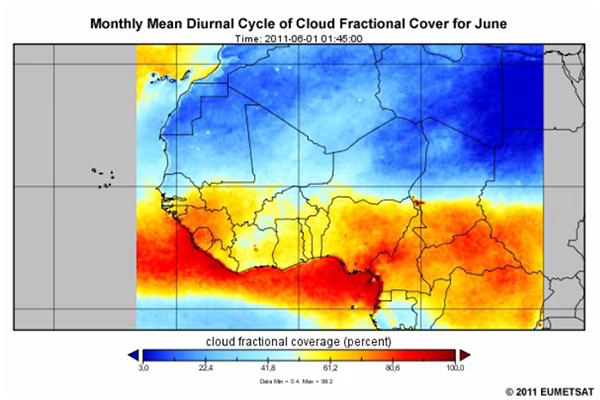
Complete the statement
Use the selection boxes to choose the answers that best complete each statement. Use these definitions for the time periods: Late morning: 1000 to 1200; midday: 1200 to 1400; early afternoon: 1400 to 1600; late afternoon: 1600 to 1800; early night: 1800 to 2000; midnight: 2000 to 2400; and late night: 0000 to 0400.
The table summarizes the answers.
Area |
Time of convective initiation |
Time of maximum convection |
||||||
Late Morning |
Midday |
Early Afternoon |
Late Afternoon |
Late Afternoon |
Early Night |
Midnight |
Late Night |
|
Gulf of Guinea |
X (1645) |
X (1845-1945) |
||||||
Central Africa |
X (1445) |
X (1745) |
||||||
Sahel |
X (1545) |
X (1845) |
||||||
3.0 MPEF Global Instability Indices
3.0 MPEF Global Instability Indices » 3.1 Introduction
Instability indices are calculated from atmospheric profiles of temperature and humidity, and provide information about the static stability of the atmosphere. Instability indices are usually derived from radiosonde data. However, with recent advances in satellite meteorology, use of satellite-derived indices for routine operational forecasting is increasing. The table compares indices calculated from satellite and radiosondes.
|
|
Satellite-derived GII |
Stability Indices from Radiosonde |
High temporal resolution (every 15 min) applicable for nowcasting of severe convection |
Every 12 or 24 hours |
Only available in cloud free zones |
Independent of sky conditions |
Averaged over small horizontal area (~10km) |
Single-point measurements |
Available for full satellite image |
Few sites in Africa, spread far apart |
Empirical (dependent on model first-guess temperature and humidity) |
Calculated from in situ measurements |
The Meteorological Products Extraction Facility (MPEF) generates a suite of stability indices known as the Global Instability Indices. These consist of the Lifted Index (LI), K Index (KI), Maximum Buoyancy, and KO index, all of which describe the potential for convective initiation and growth. Note that the GII also includes the Total Precipitable Water content (TPW). While TPW is not an instability index per say, it indicates the potential for convective precipitation.
The physical retrieval of MSG GII uses six IR channels (IR 8.7, 10.8, 12.0, 6.2, 7.3, and 13.4 µm) together with the first guess or short-term forecast fields provided by the European Centre for Medium Range Weather Forecasts (ECMWF) on a one degree latitude/longitude grid. They are interpolated in space and time to fit the time and location of the actual satellite observation. Using the NWP first guess in the GII introduces uncertainties, even though in many cases the first guess matches the observations.
3.0 MPEF Global Instability Indices » 3.1 Questions About the GII Products
Question 1
Assume that you are going to use the instability indices to forecast convective initiation. With which time lag should they be used?
The correct answers are c, d.
Instability indices may be used to assess the potential for convective development and cloud growth from a few hours to about 9 to 12 hours before they start depending on the time of the day. That’s especially true where convection has a strong diurnal cycle, such as in tropical Africa. Beyond this period, the characteristics of the air mass can change, making the atmosphere more stable.
Question 2
Do you think that the satellite-derived instability indices can be used the same way as the radiosonde-derived indices?
The correct answer is a.
The instability indices retrieved from satellite data use the same principle as those obtained from radiosondes. However, the algorithms used to derive the temperature and humidity profiles necessary for computing these indices may not, under certain atmospheric conditions, perform as well as expected. Keep this in mind when using these products.
3.0 MPEF Global Instability Indices » 3.2 Three Instability Indices from Satellite Data
Now we will look at three of the instability indices derived from satellite data: the Lifted Index (LI), K Index (KI), and the total precipitable water (TPW). Note that indices that signal an unstable atmosphere do not necessarily mean that thunderstorms will develop. You must still make a good synoptic analysis and then use these indices to refine your forecast.
Lifted Index Content
K Index Content
TPW Content
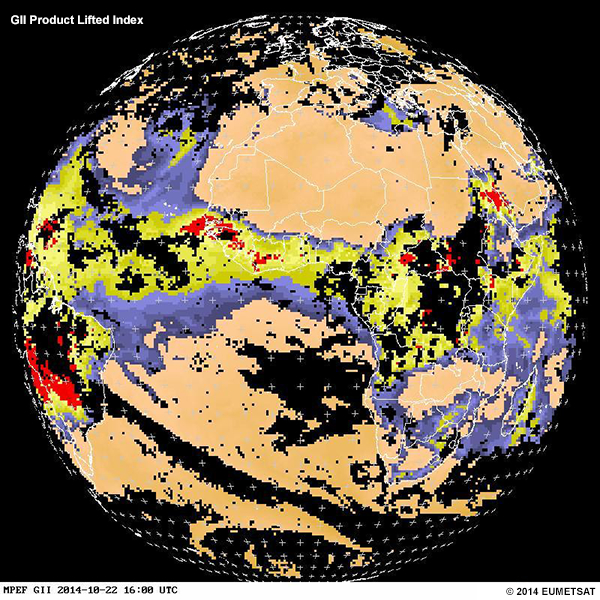
3.0 MPEF Global Instability Indices » 3.2 Three Instability Indices from Satellite Data » 3.2.1 Lifted Index (LI)
The Lifted Index (LI) is used to measure the instability of air parcels in the low troposphere. LI is the temperature difference between an air parcel lifted adiabatically from the surface to 500'): LI = Tenvionment at 500 hPa – Tair parcel at 500 hPa
Question
According to this definition, the atmosphere will be unstable if the Lifted Index is:
The correct answer is c.
A positive value of LI indicates that the air parcel is cooler and therefore denser than the air of the surrounding environment, and it sinks.
In contrast, a negative LI indicates an air parcel temperature greater than that of the environment. It is less dense, which results in the air parcel rising in the surrounding environmental air.
Therefore, a negative LI is indicative of an unstable atmosphere whereas positive values represent a stable atmosphere. An LI of 0 indicates a neutral atmosphere.
The lower the values of LI, the more unstable the atmosphere.
LI values are generally scaled as follows:
- LI > 6: Very stable atmospheric conditions; no thunderstorm development (convective inhibition)
- 1 < LI < 6: Stable atmosphere; thunderstorms development is unlikely except
- -2 < LI < 0: Slightly unstable atmosphere; lifting mechanisms, such as orographic forcing and heating, may lead to thunderstorm development (weak convective potential)
- -6 < LI < -2: Unstable atmosphere; thunderstorms are likely to develop and may be severe with lifting mechanisms (moderate convective potential)
- LI < -6: Very unstable atmospheric conditions; severe thunderstorms are likely to develop, especially under lifting mechanisms; that’s because air rising in these situations is much warmer than its surroundings and can accelerate rapidly and create tall, violent thunderstorms (high potential for convection)
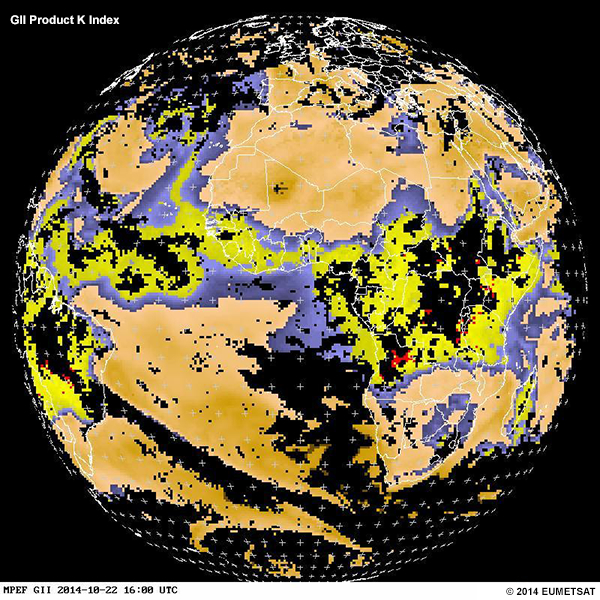
3.0 MPEF Global Instability Indices » 3.2 Three Instability Indices from Satellite Data » 3.2.2 K Index (KI)
The K Index is especially valuable for identifying environments that are conducive to convection and heavy rainfall because it takes into account both humidity and temperature.
The K Index is calculated as: KI = (T850 - T500) + Td850 – (T700 -Td700)
where T is temperature and Td is the dewpoint temperature at the pressure levels listed in hPa. Temperature is in degrees Celsius.
Higher values of KI mean a higher probability of thunderstorm development. A KI lower than 20 indicates zero likelihood of thunderstorms, while a KI of 35 of greater indicates that numerous thunderstorms are likely.
Threshold values for KI vary between cold and warm air masses because the lapse rate between those air masses differs by several degrees.
Note that the KI can change significantly over a short time period due to temperature and moisture advection.
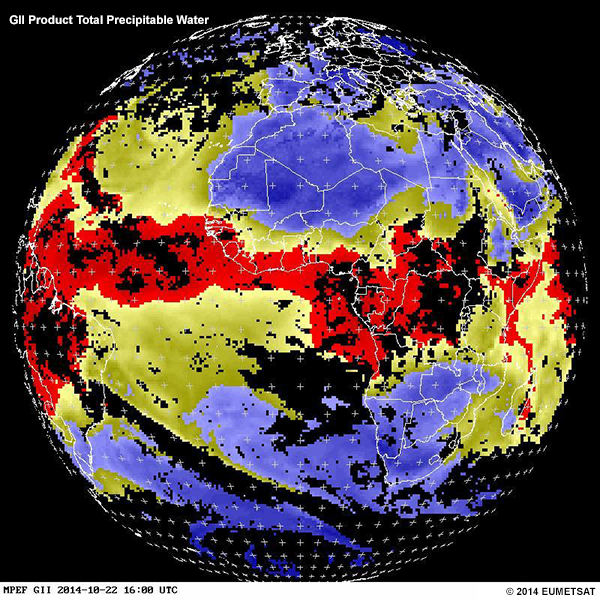
3.0 MPEF Global Instability Indices » 3.2 Three Instability Indices from Satellite Data » 3.2.3 Total Precipitable Water
Total Precipitable Water or TPW is the total water vapor contained in a vertical atmospheric column of unit cross-sectional area. It is commonly expressed as the height (mm) reached if all of the water vapor in that column condensed.
Convection is always as a result of atmospheric instability. However, moist convection can only take place if the atmosphere is humid enough to produce condensation following the upward motion of the air parcel.
Question 1
Why is it important to analyze the TPW together with the instability indices?
The correct answer is d.
The Lifted Index provides information about the vertical stratification of the atmospheric, and contains information about moisture only at the lowest level of calculation. The K index combines information about the vertical stratification of the atmosphere as well as its moisture content. However, a very moist atmosphere in the lower levels overlaid by very dry air in the mid troposphere (around 700 hPa) may significantly reduce the value of KI. Therefore, combining the instability indices with the total precipitable water content of the atmosphere provides information about the vertical stratification of the atmosphere along with more information about its water vapor content, a condition necessary for moist convection.
Question 2
Do you know any threshold value of total precipitable water that’s considered significant for forecasting thunderstorms in West and Central Africa?
The correct answer is e.
As of 2015, there is no consensually accepted threshold value. However, values 40 mm (40 kg/m2) or greater should be considered significant. Note that the extreme values of TPW observed for extreme Arctic and tropical cases are 0 and 80 mm.
4.0 Integrating Climatology Products into the Forecast Process
This final section presents the forecast process for detecting and forecasting convection that was taught in the earlier ASMET lesson, Flooding in West Africa. The process has been enhanced to show when and where to integrate the climatology and global instability products presented in the lesson. A subsequent lesson may demonstrate the application of this process to a case event over West and Central Africa. Forecasting Convective Systems in West Africa
Step 1: Review past and current satellite imagery, synoptic charts, NWP products to assess meteorological conditions.
1. Review satellite imagery for clouds and atmospheric dynamics.
2. Review synoptic observations and numerical weather prediction (NWP) products to check for the presence, position, organization and strength of the key dynamic and thermodynamic features that drive the West African monsoon systems.
2A.Synoptic observations
- Surface observations: Check the position of the intertropical front/disturbance, and the position, organization, and intensity of heat lows
- Low-level winds (600 m, 900 m, 1500 m, and 2100 m): Analyze the depth, northward extension, and organization of monsoon inflow to check for low-level instability (indicated by vortices and convergence lines)
- Mid-level winds (700/500 hPa): Check for easterly waves (mid-level instability), the African easterly jet, and dry air intrusion (low- and high-latitude interactions)
- High-level winds (200 hPa): Check for the tropical easterly jetand extra-tropical troughs (low- and high-latitude interactions)
2B. NWP products
- Mean Sea Level Pressure (MSLP): Check the position of the intertropical front/disturbance and the position, organization, and intensity of heat lows
- Low-level winds (925 and 850 hPa): Analyze the depth, northward extension, and organization of monsoon inflow to check for low-level instability (indicated by vortices and convergence lines)
- Mid-level winds (700 hPa/500hPa): Check for the presence of easterly waves, the African easterly jet, and dry air intrusions
- High-level winds (200 hPa): Check for the tropical easterly jet and extra-tropical troughs
- Relative humidity (850 and 700 hPa): Check humidity availability
- When available, check the following derived products for atmospheric instability: vertical velocity, divergence, and vorticity at 850, 700, and 200 hPa
2C. Check for agreement between the model output and synoptic observations to assess the reliability of the NWP products. Note that moderate to fast propagating convective systems, such as squall lines, typically develop between the African Easterly Jet and the Tropical Easterly Jet.
3. If convection is likely, integrate the global instability indices and satellite-derived climatology products and into your analysis
3A. Global Instability Indices (GII)
- Analyze the Lifted Index (LI) to determine the stability of the lower half of the troposphere. Positive values indicate stability, while negative values indicate instability. The more negative the value, the higher the instability.
- Check the K Index (KI) to confirm the most unstable areas. The higher the KI value, the more unstable the atmosphere.
- Check the TPW to determine areas that are more prone to moist convection. Higher TPW indicate the potential for moist convection under unstable atmospheric conditions.
- See if the unstable areas generally coincide with areas of relative maximum of TPW
3B.Cloud climatology, including the Cloud Fractional Coverage (CFC), Cloud Top Height (CTH), and Cloud Top Temperature products
- Determine if the areas of instability are climatologically favorable for convective development based on the month of the year
- Check the type of clouds that usually develop over the area during the particular month (such as low, medium, or high thick clouds)
- Where conditions are favourable for moist convection, use cloud climatology products to check the timing during which convection is likely to initiate over the area
- Check the persistence of cloud cover over the region and its diurnal evolution. Do the clouds propagate or remain more or less stationary? If they propagate, for how long and how far do they propagate?
Step 2: Assess the impact of atmospheric conditions on future weather. Determine if tropospheric dynamics are favorable for the initiation and/or further development of convective systems based on your analysis.
5.0 Yearly and Monthly Products For West and Central Africa
This page provides access to the yearly monthly mean products presented earlier in the lesson along with all of the monthly mean diurnal cycle products for cloud top height (CTH), cloud top temperature (CTT), and cloud fractional coverage (CFC) over West and Central Africa. The products are based on data collected from 2004 to 2011. We hope that you find them a valuable resource for forecasting or doing research on the weather and climate of West and Central Africa.
Click the links to play the animations. They will open in another window. If you want to save them, right-click on them and download them to your computer.
Yearly Monthly Mean Products
Monthly Mean Diurnal Cycle Products
Cloud Top Height: |
|||||||||||
Cloud Top Temperature: |
|||||||||||
Cloud Fractional Coverage: |
|||||||||||
6.0 References
EUMETSAT Satellite Application Facility on Climate Monitoring and its Product User Manual
Introduction to Meteosat Second Generation GII by Marianne Koenig, EUMETSAT
7-0-0 Contributors
COMET Sponsors
MetEd and the COMET® Program are a part of the University Corporation for Atmospheric Research's (UCAR's) Community Programs (UCP) and are sponsored by NOAA's National Weather Service (NWS), with additional funding by:
- Bureau of Meteorology of Australia (BoM)
- Bureau of Reclamation, United States Department of the Interior
- European Organisation for the Exploitation of Meteorological Satellites (EUMETSAT)
- Meteorological Service of Canada (MSC)
- NOAA's National Environmental Satellite, Data and Information Service (NESDIS)
- NOAA's National Geodetic Survey (NGS)
- Naval Meteorology and Oceanography Command (NMOC)
- U.S. Army Corps of Engineers (USACE)
To learn more about us, please visit the COMET website.
Project Contributors
Program Managers
- Mark Higgins — EUMETSAT
- Bruce Muller — UCAR/COMET
Project Leads
- Vesa Nietosvaara — EUMETSAT
- Marianne Weingroff — UCAR/COMET
Instructional Design
- Marianne Weingroff — UCAR/COMET
Science Advisors
- Hama Hamidou — EAMAC
- Abdoulaye Ouedrago — DMN
- Arlene Laing — COMET
Additional Science Advisors
- Vesa Nietosvaara — EUMETSAT
- Christine Traeger — EUMETSAT
Graphics/Animations
- Steve Deyo — UCAR/COMET
- Marianne Weingroff — UCAR/COMET
Multimedia Authoring/Interface Design
- Gary Pacheco — UCAR/COMET
- Marianne Weingroff — UCAR/COMET
COMET Staff, Fall 2015
Director's Office
- Dr. Rich Jeffries, Director
- Dr. Greg Byrd, Deputy Director
- Lili Francklyn, Business Development Specialist
Business Administration
- Dr. Elizabeth Mulvihill Page, Group Manager
- Lorrie Alberta, Administrator
- Hildy Kane, Administrative Assistant
IT Services
- Tim Alberta, Group Manager
- Bob Bubon, Systems Administrator
- Dolores Kiessling, Software Engineer
- Joey Rener, Student Assistant
- Malte Winkler, Software Engineer
Instructional and Media Services
- Bruce Muller, Group Manager
- Dr. Alan Bol, Scientist/Instructional Designer
- Steve Deyo, Graphic and 3D Designer
- Lon Goldstein, Instructional Designer
- Bryan Guarente, Instructional Designer
- Vickie Johnson, Instructional Designer (Casual)
- Gary Pacheco, Web Designer and Developer
- Sylvia Quesada, Intern
- Sarah Ross-Lazarov, Instructional Designer (Casual)
- Tsvetomir Ross-Lazarov, Instructional Designer
- David Russi, Spanish Translations
- Andrea Smith, Meteorologist/Instructional Designer
- Marianne Weingroff, Instructional Designer
Science Group
- Wendy Schreiber-Abshire, Group Manager
- Paula Brown, Visiting Meteorologist, CIRA/Colorado State University
- Dr. William Bua, Meteorologist
- Dr. Frank Bub, Oceanographer (Casual)
- Lis Cohen, Meteorologist (Casual)
- Patrick Dills, Meteorologist
- Matthew Kelsch, Hydrometeorologist
- Dr. Elizabeth Mulvihill Page, Meteorologist
- Amy Stevermer, Meteorologist
- Vanessa Vincente, Visiting Meteorologist, CIRA/Colorado State University