Introduction
Overview
The rainy season in Sahelian West Africa extends from June to September and is tied to the position of the intertropical front (ITF). During this period, westward propagating squall lines and other mesoscale convective systems often produce significant rainfall. This impacts agriculture, water resources management, and other activities. It can also lead to flooding, which can be severe.
Since flooding in the Sahel region is a nowcasting problem, weather forecasters need to consider all available real-time data from synoptic observation networks, satellites, and radar as well as numerical weather prediction model forecasts. Given the area’s sparse synoptic observations and limited radar coverage, forecasters rely heavily on satellite products and model output. These typically include single channel imagery and RGB composites from Meteosat Second Generation (MSG) satellites, synoptic observations, and model output from world numerical weather prediction (NWP) centers, notably ECMWF, Météo France, NCEP, and the UK-Met Office.
In this module, you'll assume the role of a weather forecaster on duty in Ouagadougou, Burkina Faso on 31 August 2009. Your task is to assess the meteorological conditions in the Sahel region and determine if a mesoscale convective system (MCS) is likely to develop that could lead to heavy rain and flooding. You will follow a forecast process presented in the next section. Basically, it involves checking satellite data from the past 24 hours and the current time, examining synoptic charts and model data for both periods, and then integrating the information into a forecast.
If you are not familiar with West Africa, you can view maps of the area via the West Africa Maps link in the navigational bar on the left.
About the Module
This module is intended for weather forecasters and meteorology students (WMO classes meteorologists and meteorological technicians) as a self-paced learning program and for instructors as a lecture aid in satellite meteorology and weather forecasting classes.
After going through the module, learners should be able to:
- Define the process of forecasting convective storms in West Africa
- Identify the satellite products, synoptic observations, and model outputs that are useful for assessing the potential for heavy rain and the risk of flooding from convective systems
- Identify and define key synoptic and mesoscale features that are related to convective activity in the Sahel region
Before going through the module, you should have completed the ASMET modules, notably the cloud clusters section of ASMET 5. This module is available online at http://oiswww.eumetsat.org/WEBOPS/meteocal/latest/www/resource/asmet5/ and on CD from EUMETSAT (ops@eumetsat.int). For more information on ASMET, see http://meted.ucar.edu/asmet/asmet_site/
Other training modules of interest include COMET’s Basic Hydrologic Sciences: International Edition course at http://meted.ucar.edu/training_course.php?id=24. Of particular relevance is the Flood Forecasting Case Study module at https://www.meted.ucar.edu/training_module.php?id=807.
Key Features and the Forecast Process
Key Features of the West African Monsoon
In this section, we will present a process for forecasting convective systems in West Africa. The conceptual diagram below depicts the key features that contribute to these systems. Review the diagram, then read the definitions of the features below. Note that you can access this information at any point in the module by clicking the Conceptual Diagram link in the green box in the navigation bar.
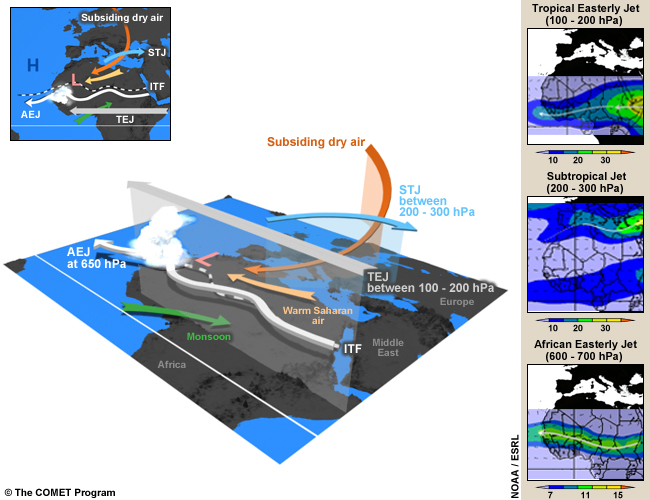
Monsoon: The humid and relatively cool southwest monsoon (green arrow) forms when southeasterly flow from the St. Helena High veers to the right after crossing the equator. The monsoon flow is the main source of moisture for the development of convection over West and part of Central Africa during the rainy season. Note that a monsoon depth of 1000 to 2000m is required for the initiation of deep convection. The monsoon converges with the Saharan dry air around the intertropical front.
Warm Saharan Air: This is the dry, hot wind (the yellow arrow) from the north that crosses the Sahara and converges with the monsoon over West and part of Central Africa. The dry air forms a dome 4 to 5 km high over the Sahara desert, creating the Saharan heat low. The intensity and location of the heat low affects water vapor transport and convection in West Africa. For example, as the low becomes more intense, the pressure gradient increases between the heat low and the cool Atlantic. This leads to enhanced moisture convergence inland (northward) and more favorable conditions for moist convection.
Intertropical Front (ITF): The ITF, also known as the Intertropical Discontinuity, is the separation zone between the dry Saharan air and the monsoon flow over West Africa. It is generally associated with Saharan heat lows. Convective systems do not develop along the convergence line due to the weak thickness of the monsoon layer in the zone and subsidence in the mid-troposphere. Deep convection is found 3 to 5 degrees south of the ITF
Heat Low: A heat low is an area of high surface temperatures and low surface pressures. (Note that the threshold for pressure values varies throughout the day due to the intense diurnal heat cycle.) Heat lows exist throughout the year and occur where insolation is high and evaporation is low. During the summer, the West African heat low is generally positioned over the Sahara and is often referred to as the Saharan heat low. During this period, the heat low is one of the major dynamic elements of the West African monsoon system.
African Easterly Jet (AEJ): The AEJ is a mid-tropospheric easterly wind maximum located between 700 and 600 hPa over Sahelian Africa during the northern hemispheric summer. The AEJ has mean maximum speeds of 10-13 m/s. The jet is the easterly geostrophic flow response to the strong temperature gradient between warm Saharan air layer and cool monsoon air to the south. African easterly waves, which produce severe thunderstorms, have their maximum amplitude close to the level of the AEJ but south of the AEJ.
African Easterly Waves (AEWs): These are the dominant synoptic weather systems of the summertime West African Monsoon. AEWs are associated with convective heating in the Intertropical Convergence Zone (ITCZ) and instabilities in the AEJ. Africa easterly waves commonly have two vorticity maxima, one at the low-levels in the vicinity of the ITF and one at the AEJ level in the rainy zone south of the jet. Easterly waves are often identified by meridional oscillations in the AEJ.
Subtropical Jet (STJ): This jet, sometimes called the subtropical westerly jet, is a strong westerly wind over the Sahara desert between 200 and 300 hPa. When the STJ is strong, it helps reinforce deep convection in the northern branch of the diverging anticyclonic flow at the top of MCSs over West and part of Central Africa during the rainy season. On the equatorial side of the jet, there’s an area of dry stratospheric subsiding air, which maintains strong stability over the Sahara desert in the mid-troposphere.
Subsidence or Dry Air Intrusion: This is a dry, cold air mass, known as a dry air intrusion in West Africa, which originates from the polar jet. It is transported eastward up to around 0 degrees longitude where it starts to subside and feed into the mid-troposphere over West Africa. A dry air intrusion is identified as a cold air trough that sometimes forms over the northern part of the continent and the Sahara desert. The dry, cold air flow accelerates monsoon inflow into West Africa and plays a key role in the development of strong convective systems in the region.
Tropical Easterly Jet (TEJ): The TEJ is a strong easterly wind flow between 200 and 100 hPa that extends from the Tibetan mountains to Africa and generally exits over the Gulf of Guinea. During the rainy season, it helps reinforce deep convection in the southern branch of the diverging anticyclonic flow on top of MCSs over West and part of Central Africa. When the jet is weak, it can inhibit deep convection.
Forecast Process for West Africa
When forecasting convective systems in West Africa, it is useful to check all available data, including satellite images and derived products; synoptic surface charts (such as station observations); upper-air charts (from radiosonde stations); radar (if available); and model output. Since the ASMET modules focus primarily on satellite data, we will examine satellite data in conjunction with standard surface and upper-air charts and model output. Note that you can access this information at any point in the module via the Forecast Process link on the left.
Our process of forecasting convective systems in West Africa includes the following steps:
Step 1: Review past and current satellite imagery, synoptic charts, and NWP products to
assess meteorological conditions.
1. Review satellite imagery for clouds and atmospheric dynamics.
2. Review synoptic observations and numerical weather prediction (NWP) products to check for the presence, position, organization and strength of the key dynamic and thermodynamic features that drive the West African monsoon systems.
A. Synoptic observations:
- Surface observations: Check the position of the intertropical front/disturbance, and the position, organization, and intensity of heat lows
- Low-level winds (600 m, 900 m, 1500 m, and 2100 m): Analyze the depth, northward extension, and organization of monsoon inflow to check for low-level instability (indicated by vortices and convergence lines)
- Mid-level winds (700/500 hPa): Check for easterly waves (mid-level instability), the African easterly jet, and dry air intrusion (low- and high-latitude interactions)
- High-level winds (200 hPa): Check for the tropical easterly jet and extra-tropical troughs (low- and high-latitude interactions)
B. NWP products
- Mean Sea Level Pressure (MSLP): Check the position of the intertropical front/disturbance and the position, organization, and intensity of heat lows
- Low-level winds (925 and 850 hPa): Analyze the depth, northward extension, and organization of monsoon inflow to check for low-level instability (indicated by vortices and convergence lines)
- Mid-level winds (700 hPa/500hPa): Check for the presence of easterly waves, the African easterly jet, and dry air intrusions
- High-level winds (200 hPa): Check for the tropical easterly jet and extra-tropical troughs
- Relative humidity (850 and 700 hPa): Check humidity availability
- When available, check the following derived products for atmospheric instability: vertical velocity, divergence, and vorticity at 850, 700, and 200 hPa
C. Check for agreement between the model output and synoptic observations to assess the reliability of the the NWP products.
Note that moderate to fast propagating convective systems, such as squall lines, typically develop between the AEJ and the TEJ.
Step 2: Assess the impact of atmospheric conditions on future weather. Determine if tropospheric dynamics are favorable for the initiation and/or further development of convective systems based on your analysis.
Now we'll apply the process to the case.
Satellite Imagery
Using Satellite Imagery to Assess the Meteorological Environment
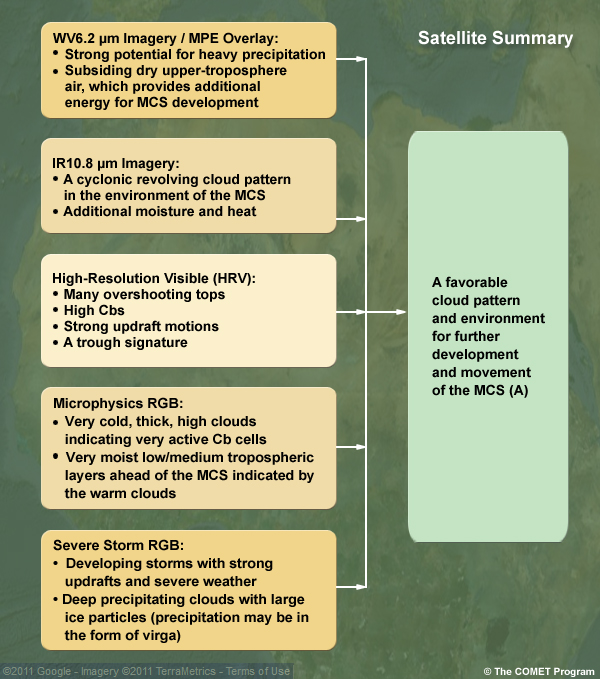
To assess meteorological conditions, particularly the dynamics of clouds systems, it's especially useful to check the following satellite channels and channel combinations: High Resolution Visible (HRV), IR 3.9 µm, WV 6.2 µm, and IR 10.8 µm images, and the severe storm RGB. All of these products are available during daytime. But some are also available at night, making them particularly useful for assessing the full 24-hour period.
The HRV channel provides detailed information about convective systems but is only available during daytime.
In contrast, the IR 3.9 µm channel is available 24 hours a day. But since it has a visible component during daylight, the rules for interpreting the imagery differ for day vs. night.
WV 6.2 µm imagery is also available during the day and at night. When animated, the imagery is especially useful for observing the following:
- Active convective systems
- Dry subsiding air
- Subtropical jets; note that when parallel jets are strong, convective systems located between them are often reinforced
The IR 10.8 µm channel is available during the day and at night and is good at depicting the following, particularly when animated:
- Developing and decaying convective systems
- Diurnal temperature changes on the ground
- Cloud top temperatures
- Cloud dynamics
The severe storm RGB provides useful information about the severity of convective clouds. By displaying detailed structures such as towering and overshooting cloud tops, you can infer the most active parts of Cbs. However, this RGB is only available during daytime.
Finally, the microphysics RGB is available day and night but should only be used at night. At night, very cold cloud tops can be identified by their granular structure (the salt and pepper or speckled pattern). Note that the RGB is made from channels IR 12.0 - IR10.8 µm, IR 10.8 - IR 3.9 µm, and IR 10.8 µm.
Now we'll check these products.
Past 24 Hours: IR 10.8 µm Imagery
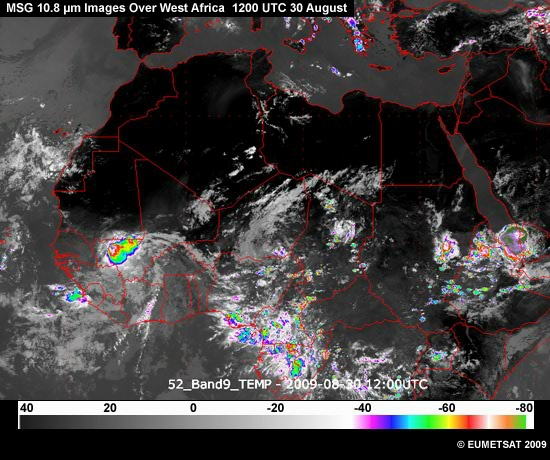
MSG 10.8 micrometer images over West Africa from 12 UTC 30 August to 12 UTC 31 August
Question
This 10.8 µm animation covers the past 24 hours, from 12 UTC 30 August to 12 UTC 31 August. What features are evident? Select the option(s) that apply, then click Done.
The correct answers are a) and b).
The animation shows a well-organized MCS over northeast Nigeria that's moving westward. The revolving cloud pattern in the environment of the MCS maintains monsoon advection from the Southern Hemisphere and therefore supports its continued development. The animation confirms that there's no decaying cloud cluster ahead of the MCS that might have suppressed its development. Note that the IR10.8 µm channel cannot be used to detect subsiding air. It is a window channel and cannot identify air masses.
Past 24 Hours: WV 6.2 µm Imagery Overlaid with the Multisensor Precipitation Estimate
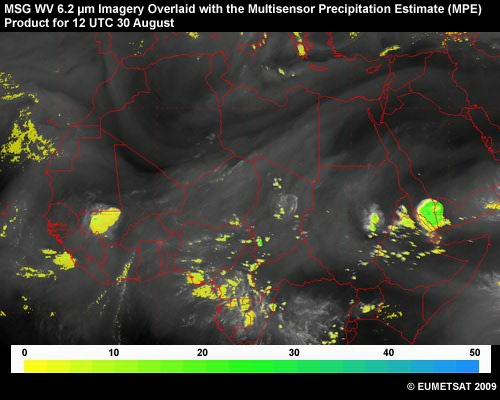
MSG WV 6.2 micrometer image overlaid with a multisensor precipitation estimate product, 12 UTC 30 Aug to 12 UTC 31 Aug; units are mm/hr
Question
This animation of WV 6.2 µm imagery overlaid with the Multisensor Precipitation Estimate (MPE) product covers the same period (12 UTC 30 August to 12 UTC 31 August) in hourly steps. (Note that the units are mm/hr.) There's a strong mesoscale convective system (MCS) that begins in northeast Nigeria and reaches maturity between 03 and 05 UTC over central Nigeria. What other features are evident nearby? Select those that apply, then click Done.
The correct answers are a), b), c) and e).
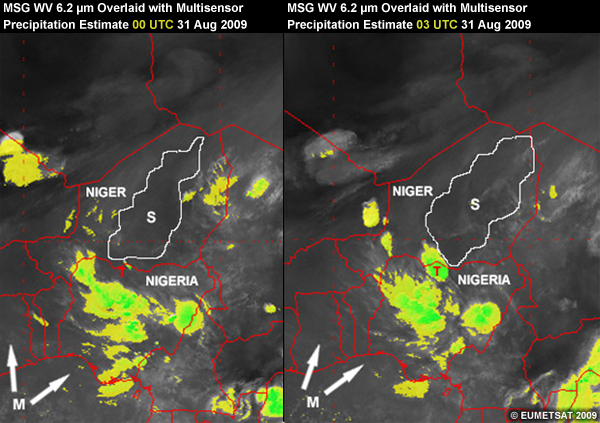
A dark area of subsiding dry air (S) is evident north of the MCS. From 0000 to 0300 UTC on 31 August, this dry air intrusion has supported the development of a severe thunderstorm (T), which joined the northern part of the initial MCS. There's a great deal of moisture in the upper troposphere southwest of the MCS (the arrows from M); this indicates ascending air, which is favorable for sustaining the convective system. There are no decaying cloud clusters ahead of the main MCS that would likely suppress its development.
Return to the animation and notice the following. The smaller MCS that develops in the wake of the strong one dies by 08 UTC. The plume of moisture that goes from southwest to northeast indicates the subtropical jet.
One final note: The bright green/turquoise areas represent more than 20 mm of rainfall per hour.
Past 24 Hours: Microphysics RGB
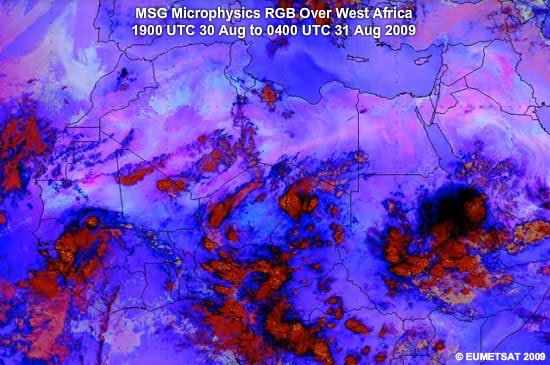
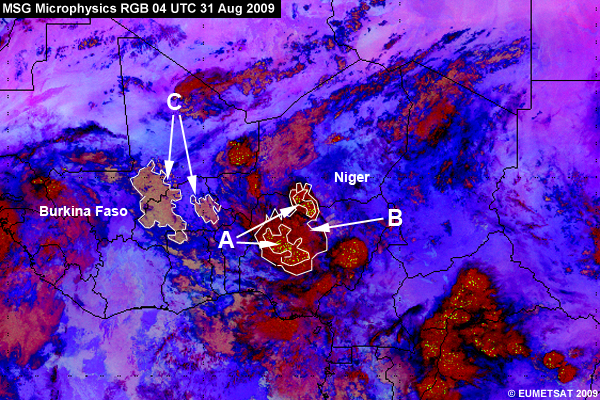
MSG Microphysics RGB images over West Africa from 19 UTC 30 Aug to 04 UTC 31 Aug 2009
This microphysics RGB animation goes from sunset on 30 August to sunrise on 31 August. How would you describe the clouds propagating westward over Nigeria/Niger? Select the option that best describes them from each group, then click Done.
Question
The noise in the image (A) comes from the IR 3.9 µm channel, and indicates very cold (< -50 degree C), thick, high-level clouds. The cold, thick, high clouds appear in a reddish color (B) without any noise, while the very cold, thin, high clouds appear in dark blue to black. The relatively warm clouds, like those propagating over Burkina Faso (C), appear in a more brownish color, indicating a very moist atmosphere in the low/medium troposphere.
Current Time: HRV Imagery
Now we'll look at imagery for the current time and see if the MCS is still very active and if the environment is still favorable for its further development. Specifically, we'll check the HRV and IR 10.8 µm channels. The HRV chart is not available at 12 UTC for the full West Africa region, so we'll look at imagery from 1430 UTC instead.
Question 1
What features are evident in the 1430 UTC HRV image? Use the drawing tools to mark and label features on the image that are related to the MCS, such as cloud bands. When you are finished, click Done.
The image shows a well-defined MCS (A) over Niger-Nigeria. In addition, there's a wave-like cloud band (the cyan line) to the north of the system over Mali, Algeria, and Libya, which might be associated with a medium- to upper-level trough. The trough plays a key role since it helps strengthen monsoon flow over the area by shifting the intertropical front (ITF) further north.
Question 2
Here is a high-resolution HRV image of the MCS. Use the drawing tools to mark the most active parts of the MCS, then click Done.
The towering tops above the anvil cloud deck indicate the most active parts of the MCS. Often these towering tops can be identified by the shadows cast on anvil clouds. Some of the most active areas of this MSC are outlined in black.
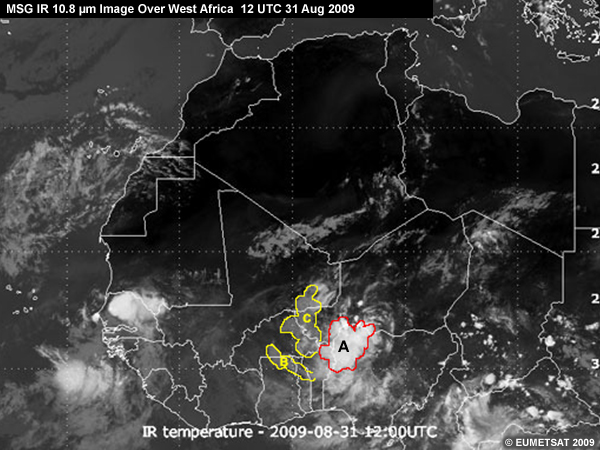
Current Time: IR 10.8 µm Imagery
Question
In this IR 10.8 µm image for 12 UTC, where's the active part of the convective system (A) and the associated medium-level clouds? Use the red drawing tool to outline the active part of the convective system. Use the yellow tool to mark the area(s) with associated medium-level clouds. When you are finished, click Done.
The very bright cloud bands indicate very low temperatures related to very high convective cloud tops. This continuous and persistent cloud pattern within the MCS indicates a very active central convective cluster. The two areas of associated medium-level clouds (grey) are outlined in yellow and indicate slightly warmer temperatures.
Current Time: Severe Storm RGB
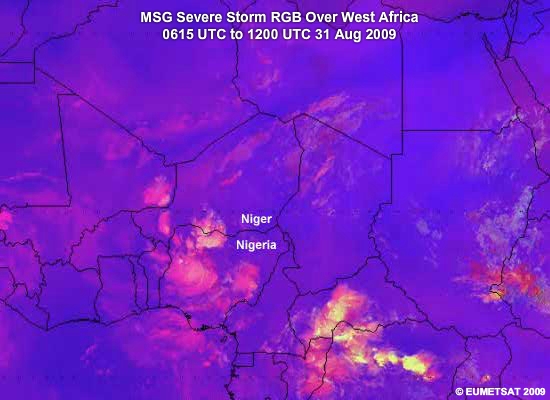
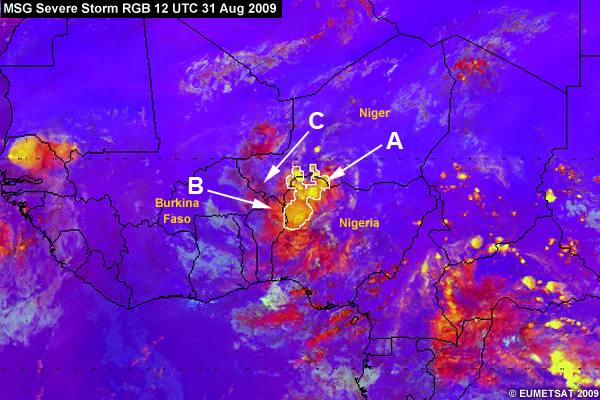
MSG Severe Storm RGB images over West Africa from 0615 UTC to 1200 UTC 31 August 2009
Question
The severe storm RGB, also known as day convection storm RGB, is very useful for identifying severe young developing storms. View the animation, then decide which of the following statements are correct. Click Done when you are finished.
The correct answers are a) and e).
The yellow color (A) indicates developing cumulonimbus clouds with small ice particles associated with very strong updrafts and severe weather. The yellow becomes more and more pronounced, indicating an intensification of the updrafts with time. The reddish color (B) indicates deep precipitating clouds while the brownish color (C) shows thin cirrus clouds with large ice particles.
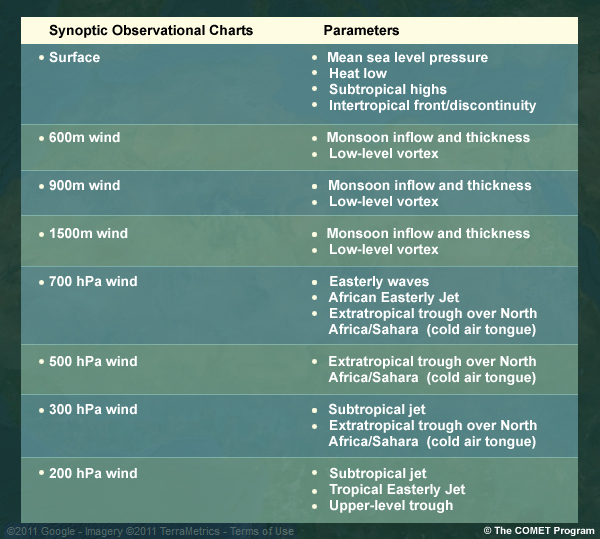
Click to see a table summarizing the features that can be checked on each chart. Note that this table is available via the Synoptic Charts link in the box on the left.
Satellite Summary
Here’s a summary of our findings from the satellite products. Do you agree with all of the points?
Synoptic Observations and Model Data
Synoptic Charts
To check the dynamic and thermodynamic structure of the atmosphere over West Africa, you'll examine synoptic charts and NWP products for the last 24 hours and the current time. Then you’ll compare your findings with those from the satellite imagery and develop a best guess for the next day's weather situation. In particular, you’ll decide how likely the area is to experience heavy rainfall that could possibly lead to flooding.
Here are the features that play an important role in our meteorological situation. (For definitions, remember that you can access the Conceptual Diagram link in the box on the left.) Which charts should be checked to identify and monitor each feature? Select the appropriate chart(s), then click Done.
Question 1
Mean sea level pressure:
The correct answer is a).
You should check surface charts for mean sea level pressure.
Question 2
Intertropical front:
The correct answer is a).
You should check surface charts for the intertropical front.
Question 3
Heat lows:
The correct answer is a).
You should check surface charts for heat lows.
Question 4
Subtropical highs:
The correct answer is a).
You should check surface charts for subtropical highs.
Question 5
Monsoon inflow and thickness:
The correct answer is b).
You should check 600 m, 900 m, and 1500 m charts for monsoon inflow and thickness.
Question 6
Low-level vortex:
The correct answer is b).
You should check 600 m, 900 m, and 1500 m charts for low-level vortices.
Question 7
African easterly waves south of the Africa Easterly Jet (AEJ):
The correct answer is c).
You should check 700-hPa charts for African easterly waves.
Question 8
African easterly jet:
The correct answer is c).
You should check 700-hPa charts for the African easterly jet.
Question 9
Extratropical troughs over North Africa/Sahara:
The correct answers are c) and d).
You should check 700, 500, and 300 hPa charts for extratropical troughs over North Africa/Sahara.
Question 10
Subtropical jet:
The correct answer is d).
You should check 300 and 200 hPa charts for subtropical jets.
Question 11
Tropical easterly jet:
The correct answer is d).
You should check 200 hPa charts for tropical easterly jets.
Click to see a table summarizing the features that can be checked on each chart. Note that this table is available via the Synoptic Charts link in the box on the left.
NWP Model Fields
This table shows the model fields to check for the parameters/features involved with convective cloud development over West Africa. Review the table, then answer the questions below. Note that you can access the table at any point via the Model Charts link in the box on the left.
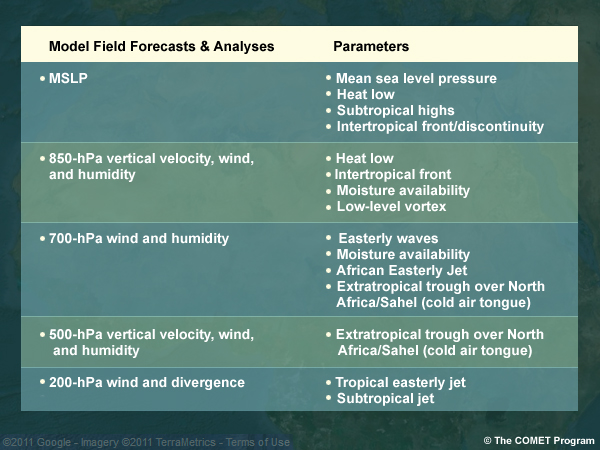
Using the information from the table, select the field(s) that are important to check for the following features.
Question 1
Low-level vortex:
The correct answer is b).
You can check for low-level vortices on 850-hPa wind charts.
Question 2
African easterly jet:
The correct answer is c).
You can check for the African easterly jet on 700-hPa wind and humidity charts.
Question 3
Extratropical trough over North Africa/Sahara (cold air tongue):
The correct answers are c) and d).
You can check for extratropical troughs over North Africa and the Sahara desert on 700-hPa wind and humidity charts and 500-hPa vertical velocity, wind, and humidity charts.
Question 4
Tropical easterly jet:
The correct answer is e).
You can check for troughs tropical easterly jets on 200-hPa wind and divergence charts. Now we'll look at some of the charts and see what they indicate for the past 24 hours and the current time.
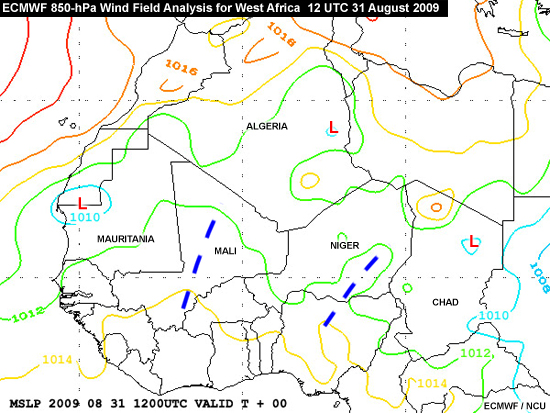
MSLP Synoptic Chart (Current Time)
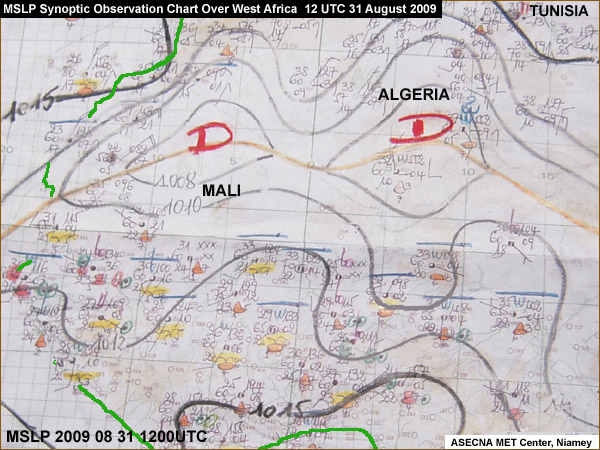
On this MSLP synoptic observation chart for 12 UTC 31 August, the Ds are French for low (depression). The orange line indicates the position of the ITF, which is based on a combination of dew point temperature, pressure, wind, and the presence of low clouds.
Question
Which of the following statements are true? Select the correct option(s), then click Done.
The correct answers are a), b) and d).
Heat lows are evident over Mali and Algeria, with the highest surface temperatures around the intertropical front. This means that the lows are heat lows conducive for convection. The ITF is further north. It is favorable for large monsoon inflow and will bring enough moisture to support the development of the convective systems.
A note about the charts: At the time of this case study, many tropical African meteorological services used manually analysed synoptic charts. As of 2011, computer-plotted or automatic charts are becoming more common in this area.
MSLP Model Fields (Past and Current Time)
Click the tabs for the MSLP charts. Review each chart and answer the question below it.
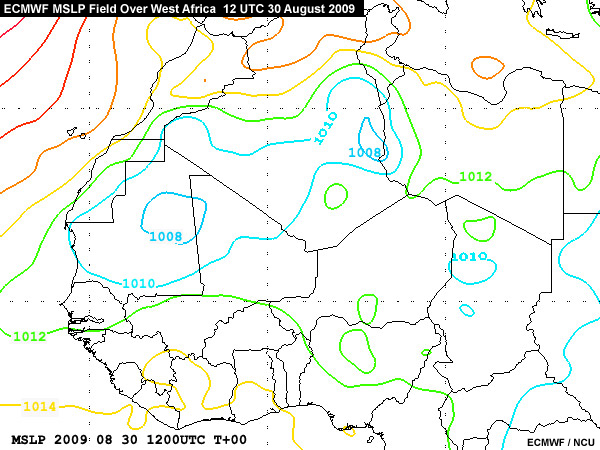
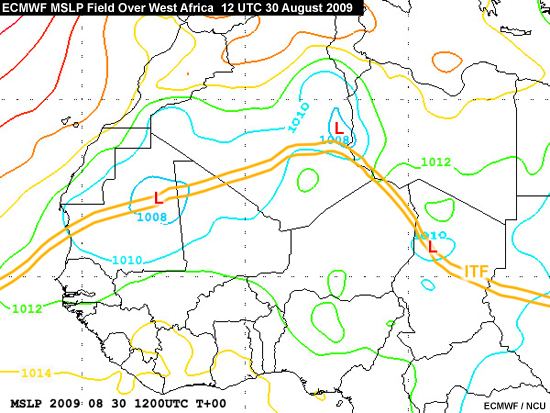
12 UTC 30 Aug 2009
Question 1
Which of the following features are evident on this MSLP chart for 30 August? Select the option(s) that apply, then click Done.
The correct answers are a), b) and c).
The 30 August chart confirms the presence of two heat lows (the Ls on the chart below) over Mauritania and Algeria and a weaker heat low over western Chad. All of these might trigger convection over the Sahel. The chart also confirms the northward position of the ITF. This is favorable for humidity advection and the reinforcement of deep convection over the Sahelian region. Mid-latitude lows are unlikely to occur in summer in this region. Now click the other tab at the top and answer the question.
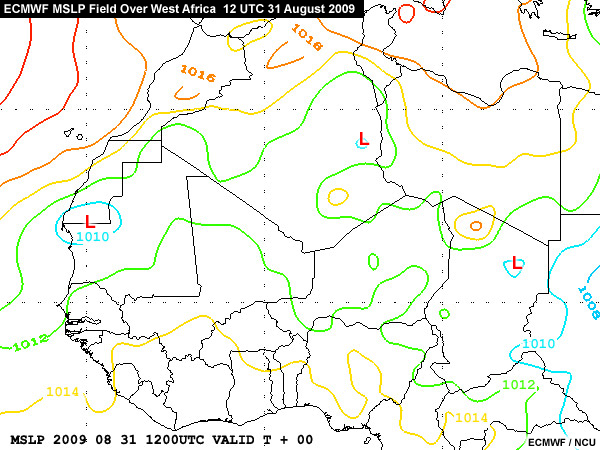
12 UTC 31 Aug 2009
Question 2
Which of the following features are evident on this MSLP chart for the next day, 31 August? Select the option(s) that apply, then click Done.
The correct answers are b) and d).
The reinforcement of the St. Helena ridge over West Africa (the ridge axes marked with the dashed blue lines) confirms favorable conditions for moisture advection over the Sahel. But surface conditions cannot be used alone to forecast deep convection over the area. Dynamics and thermodynamics in the low, mid, and upper troposphere play an important role and also need to be checked. Note that the isobaric deformation from Niger to Ghana indicates a trough, not a ridge.
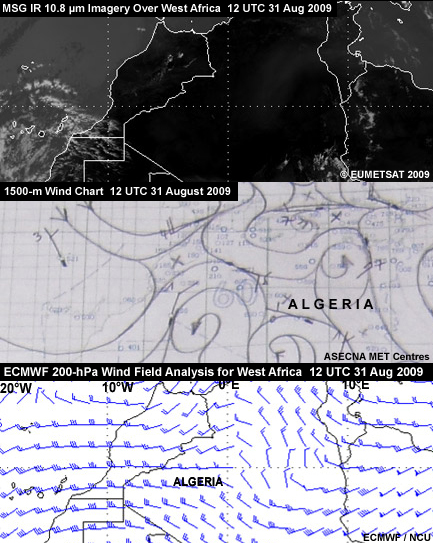
1500-m Wind Charts (Current Time)
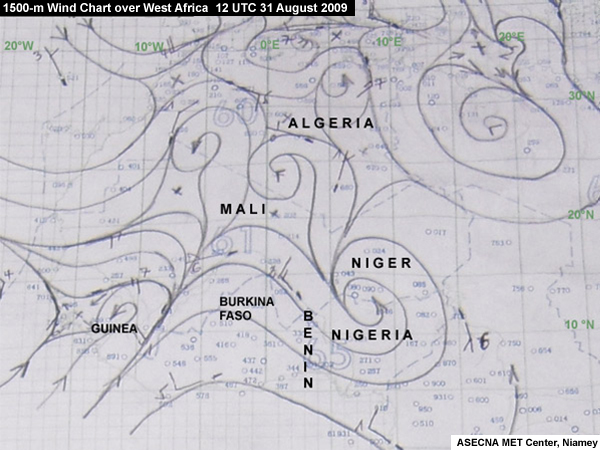
Question
Review the 1500-m wind chart at 12 UTC 31 August. Which of the following statements are true? Select the correct option(s), then click Done.
The correct answer is b).
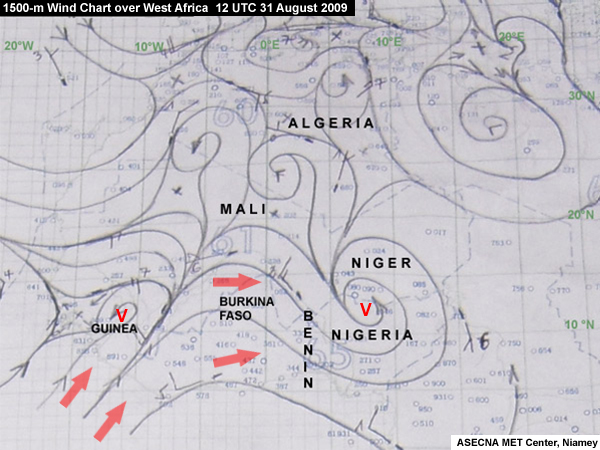
The 1500-m wind chart at 12 UTC 31 August shows deep monsoon flow (the red arrows) over Nigeria, Niger, Burkina Faso, and the southern part of Mali. Convective system (A) seen on the 10.8 µm satellite imagery (below) is located in the area of monsoon inflow, which extends up to 20 degrees N over eastern Mali. Two low-level vortices (the Vs) are evident over Nigeria and Guinea. Note that we cannot deduce the presence of heat lows from this chart.
850-hPa Model Wind Analysis (Current Time)
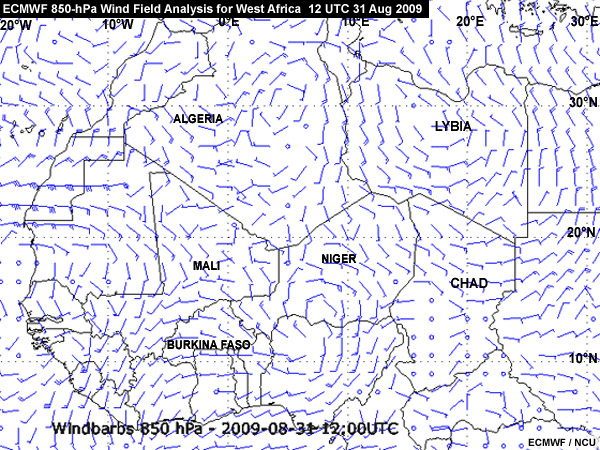
Question
Review the 850-hPa wind field analysis for 12 UTC 31 August, then decide which of the following statements are true. Select the correct option(s), then click Done.
The correct answers are a) and c).
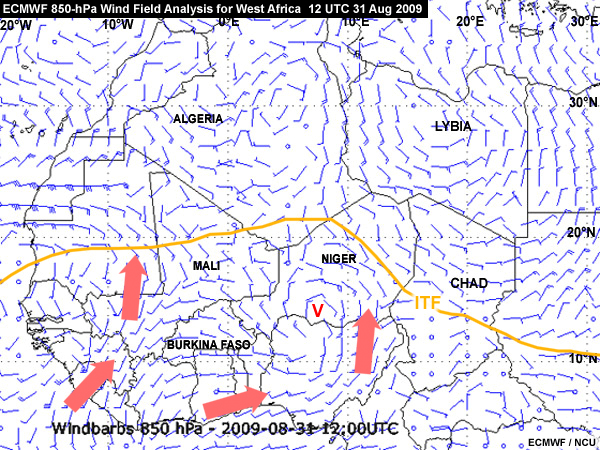
The 850-hPa wind field analysis shows a well-organized deep monsoon inflow (the red arrows) from the Gulf of Guinea into the inland part of West Africa, which feeds the convective system (A) seen on the 10.8 µm satellite imagery (below). The vortex (V) over the Niger-Nigeria border acts like an engine that pumps moist air. This means that there will be enough moisture to maintain the active system through the following hours. No anticyclonic vortex is present over the border between Niger and Nigeria. From this, we can conclude that the features on the 850-hPa forecast model wind field match those on the observed synoptic 1500-m wind chart.
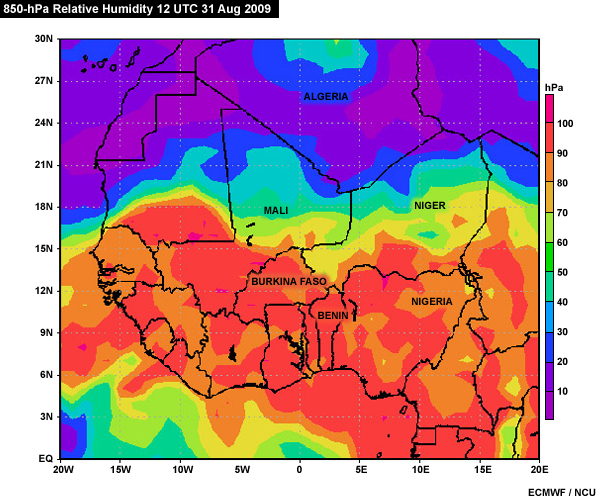
850-hPa Model Relative Humidity Field (Current Time)
The 850-hPa relative humidity field confirms the observations from the 850-hPa wind field chart. A large humid area with values between 80% and 100% extends from the southern coastal areas of West Africa into the central Sahel. This feeds the convective system (A) seen on the 10.8 µm satellite imagery.
850-hPa RH
850-hPa Wind
10.8 µm Satellite Image
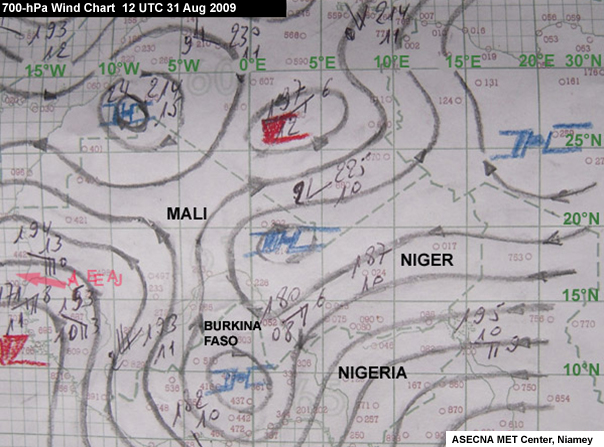
700-hPa Synoptic Wind Chart Analysis (Current Time)
At 12 UTC 31 August 2009, we can assume that there's a wave pattern in the wind flow at 700 hPa over the central and western Sahel. Based on this chart made from radiosonde data, wind speeds within the 10 to 20 degrees N latitude band range from 20 to 30 knots. These are relatively strong winds at this level and are a signature of the presence of the African easterly jet within the latitude band. Note that the radiosonde network is very limited in Africa.
700-hPa NWP Wind Field (Current Time)
The wind field at 700 hPa shows a well-organized easterly wave over the Sahel between 10 and 18 degrees north. The vortex associated with the convective system at 850 hPa is under the wave trough axis and is favorable for maintaining the deep convection that sustains the system. The wind fields also confirm the presence of the African easterly jet in the vicinity of the easterly waves.
Question
Draw the axis of the easterly wave. Then circle the area with wind speeds in excess of 25 kt over Niger and Mali. When you are finished, click Done.
The red dashed line across Central Niger and Nigeria is the trough axis of the easterly wave. The V beneath it indicates the vortex associated with the convective system. The circled area of >25 kt winds indicates the position of the African easterly jet as it passes over Niger and Mali.
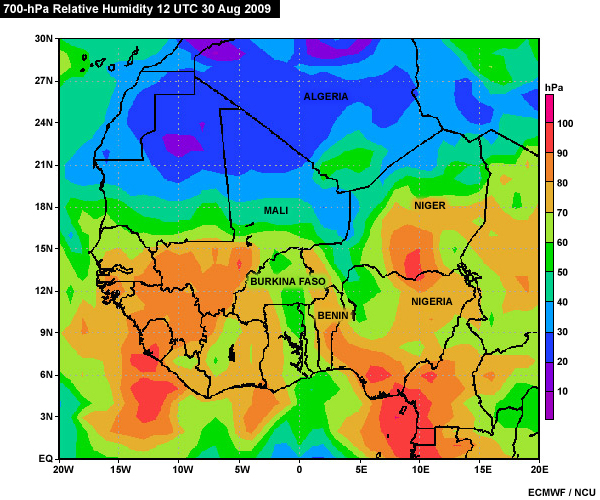
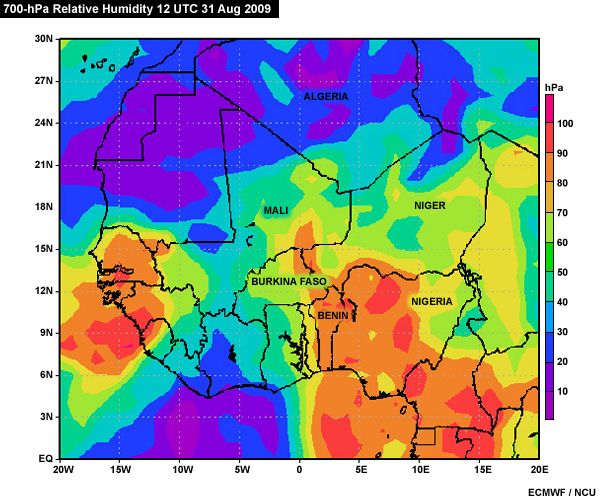
700-hPa Relative Humidity Field (Past and Current Time)
The NWP 700-hPa relative humidity field at 12 UTC on 30 August 2009 shows a moist atmosphere from the Gulf of Guinea up to Niger, with a tongue stretching over Burkina Faso. This feeds the convective system in the area of the easterly wave and is favorable for sustaining the convective system.
Click the 31 August tab to see the next day's chart. Notice the substantial increase in humidity from 30 to 31 August over the central and eastern part of Burkina Faso.
700-hPa RH for 30 Aug
700-hPa RH for 31 Aug
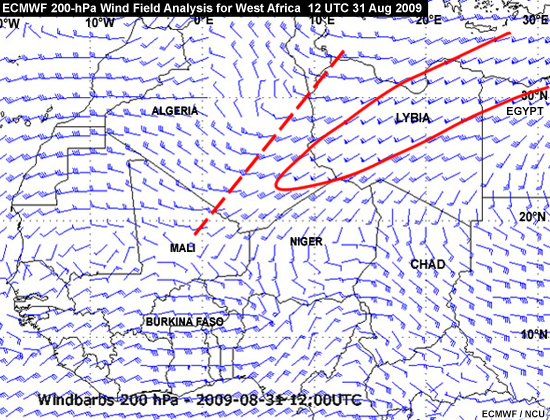
200-hPa Wind Field, Page 1 (Current Time)
Question
This 200-hPa wind field for 12 UTC 31 August shows a well-defined upper-level trough. Use the drawing tools to draw its axis. Then draw the 50-kt isotach over Libya and Egypt. Click Done when you are finished.
There is a deep trough over Algeria and Libya, whose axis is marked with red dashed lines. The trough is associated with cold dry air that could accelerate monsoon inflow over the Sahel. We will discuss the meaning of the 50-kt isotach on the next page.
200-hPa Wind Field, Page 2 (Current Time)
Question
What does the 50-kt isotach indicate? Select the correct option(s), then click Done.
The correct answer is b).
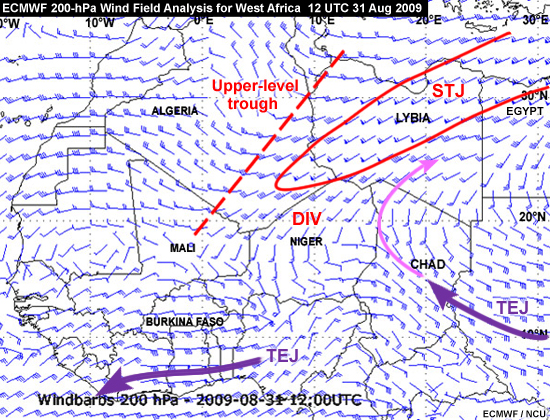
The 50-kt wind isotach indicates a strong subtropical jet (STJ) streak. The jet streak is on the eastern side of an upper-level trough (the red, dashed line) that stretches across Libya and Algeria into northeastern Mali. The upper-level trough originated in the extratropics and amplified while penetrating into tropical West Africa. Upper-level divergence in the southeastern part of the trough, the southern entrance of the STJ, accelerates the jet and enhances upward motion and convection over West Africa. The plume of moisture associated with the trough and jet can be observed in the water vapor images shown earlier. Air also flows from the TEJ northward to the STJ (magenta line). These tropical-extratropical interactions are critical contributors to strong convection and precipitation in West Africa.
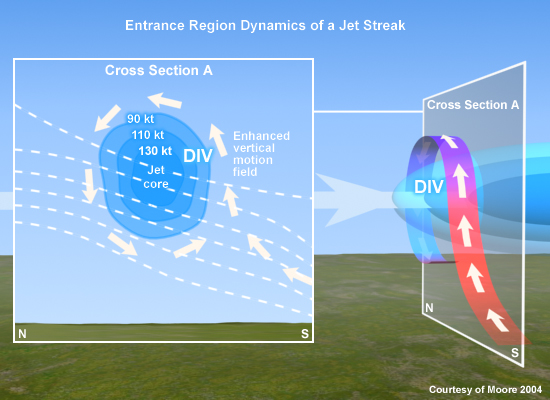
200-hPa Divergence (Current Time)
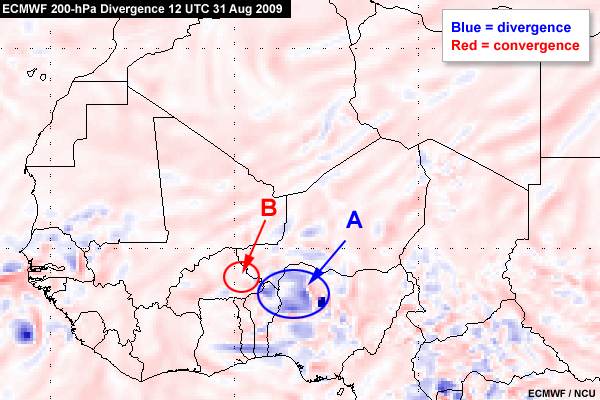
Question
Select the word that completes each statement below, then click Done.
Strong upper-level divergence (A) is associated with strong upward motion and severe convective storms. In contrast, upper-level convergence (B) usually indicates downward motion, which is a sign of decaying convection.
Summary of Synoptic Observations and Model Data
Now it’s time to integrate your findings from the different analyses. For each level, select the features that were evident in the charts. When you’re finished, click Done.
Question 1
Upper troposphere:
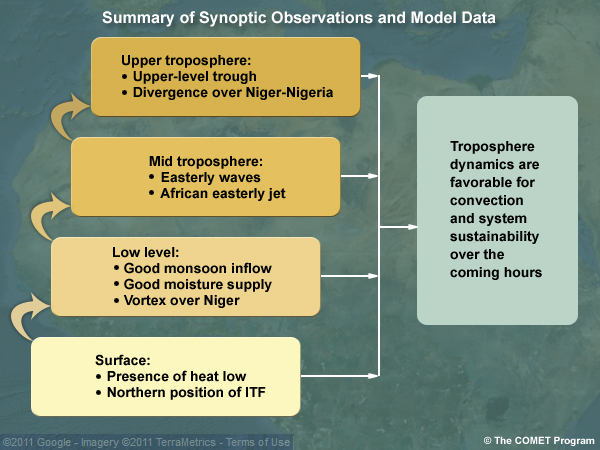
The correct answers are c) and d).
Question 2
Mid troposphere:
The correct answers are a) and b).
Question 3
Low level:
The correct answers are a), b) and d).
Question 4
Surface:
The correct answers are b) and e).
The features found at each level are depicted in the chart.
Making the Forecast
Forecasting for 1 September
Question
Based on the satellite, synoptic, and NWP products, what do you expect to happen in Ouagadougou and the surrounding area on 1 September? Select the word that completes each sentence, then click Done.
The data and products from 1200 UTC 31 August clearly show that the convective system over southwest Niger will persist and in fact strengthen over the following hours, with strong potential for heavy precipitation. This is confirmed by the analysis of the observational synoptic data and NWP output. Nevertheless, it might be quite difficult to tell exactly where and when the heavy rains will occur and how long the convective system will remain active.
Revisiting the Conceptual Model
Now we'll revisit the conceptual model see how well our case matched the key features in the model. Notice the following in the IR image:
- Intense convection is located in the trough of the easterly wave
- The easterly wave is located where the AEJ is strong and forms a wave
- Most of the convection is south of the ITF
- The low-pressure centers are located along the ITF over the Sahara
- The location of the subtropical jet enhances outflow from the convection
- The tropical easterly jet is present to the south of the convection over West Africa
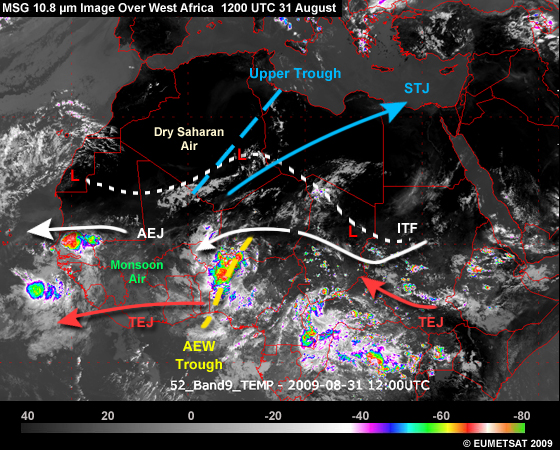
See how well the features match those in the conceptual model.
What Actually Happened
What Actually Happened
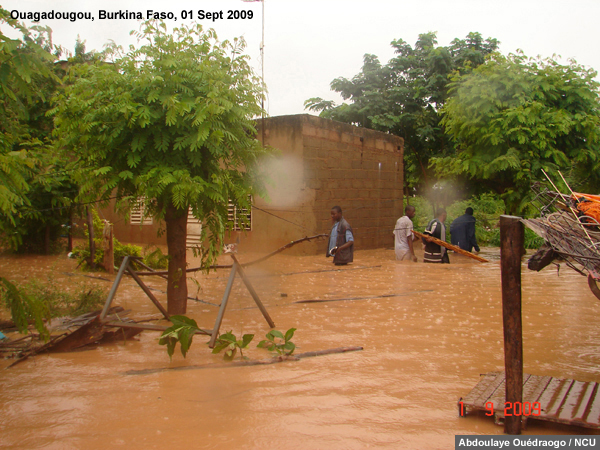
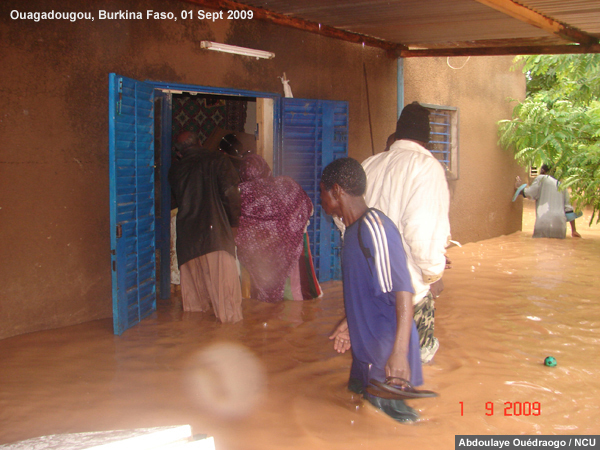
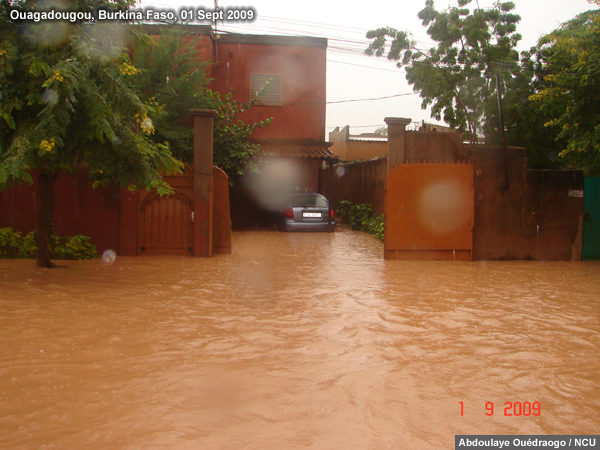
From 30 August to 01 September 2009, a well-organized mesoscale convective system moved across Nigeria-Niger to Burkina Faso, causing heavy rainfall and flooding along its trajectory.
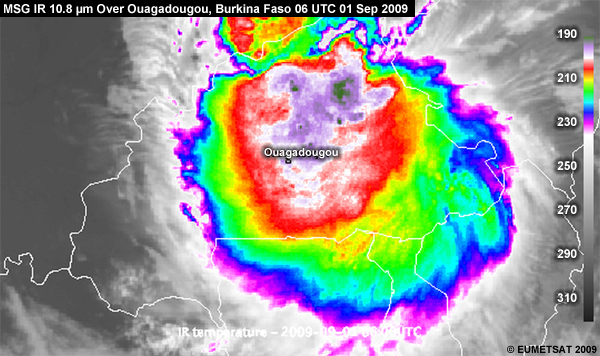
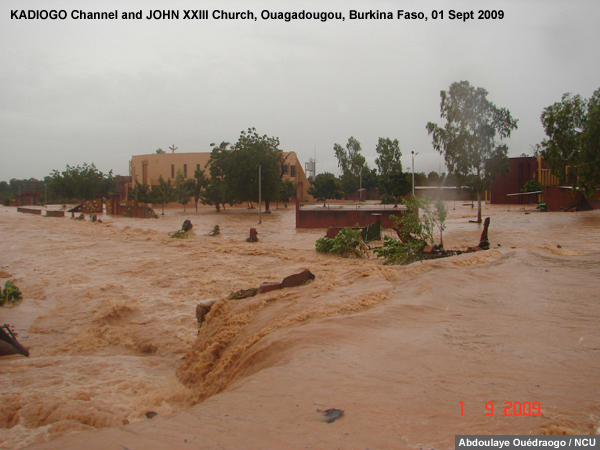
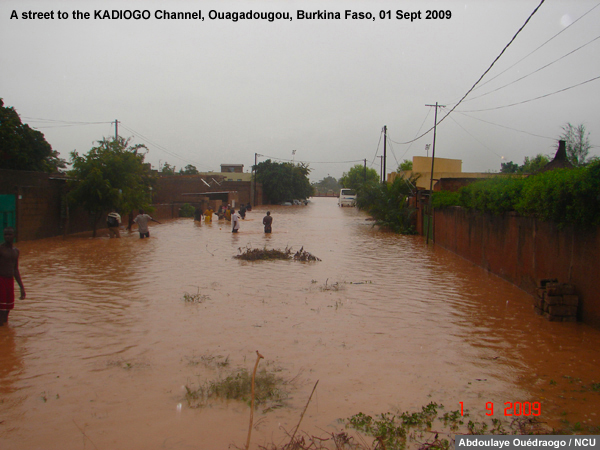
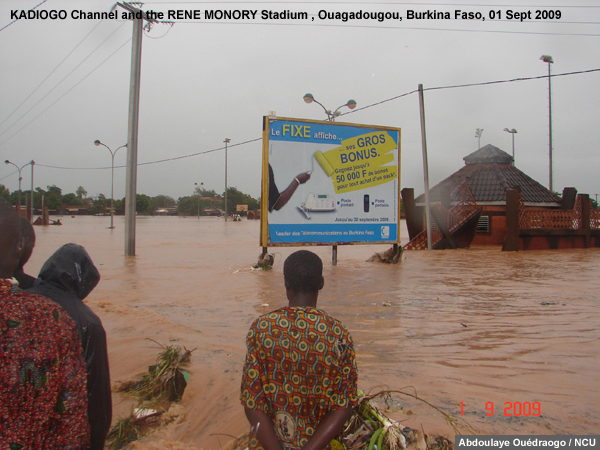
The flooding was particularly severe in Ouagadougou, where 263 mm (over 10 inches) of rain fell in 12 hours on 01 September. According to the Red Cross and Red Crescent Societies, this record-breaking event affected more than 150,000 people within and around Ouagadougou, rendering 48,000 homeless.
Click the tabs to see photographs of flooding in Ouagadougou.
1
2
3
4
5
6
Contributors
COMET Sponsors
The COMET® Program is sponsored by NOAA National Weather Service (NWS), with additional funding by:
- European Organisation for the Exploitation of Meteorological Satellites (EUMETSAT)
- Meteorological Service of Canada (MSC)
- NOAA National Environmental Satellite, Data and Information Service (NESDIS)
- Naval Meteorology and Oceanography Command (NMOC)
Project Contributors
The ASMET project is funded by EUMETSAT. For more information on ASMET, see http://www.meted.ucar.edu/communities/asmet/about.htm.
Scientists
- Emmanuel Kploguédé — Ecole Africaine de la Météorologie et de l’Aviation Civile / L'Agence pour la Sécurité de la Navigation aérienne en Afrique et à Madagascar (EAMAC/ASECNA)
- Abdoulaye Ouédraogo — EAMAC/ASECNA
- Hama Hamidou — EAMAC/ASECNA
Additional Scientists
- Henk Verschuur —EUMETSAT
- Arlene Laing — UCAR/COMET
Instructional Design / Graphics Design / Programming
- Marianne Weingroff — UCAR/COMET
Project Managers
- Henk Verschuur —EUMETSAT
- Marianne Weingroff —UCAR/COMET
- Dr. Patrick Parrish —UCAR/COMET
COMET HTML Integration Team 2020
- Tim Alberta — Project Manager
- Dolores Kiessling — Project Lead
- Steve Deyo — Graphic Artist
- Gary Pacheco — Lead Web Developer
- David Russi — Translations
- Gretchen Throop Williams — Web Developer
- Tyler Winstead — Web Developer
COMET Staff, Winter 2011
Director
- Dr. Timothy Spangler
Administration
- Elizabeth Lessard, Administration and Business Manager
- Lorrie Alberta
- Michelle Harrison
- Hildy Kane
Hardware/Software Support and Programming
- Tim Alberta, Group Manager
- Bob Bubon
- Ken Kim
- Mark Mulholland
- Victor Taberski - Student Assistant
- Chris Webber - Student Assistant
- Malte Winkler
Instructional Designers
- Dr. Patrick Parrish, Senior Project Manager
- Dr. Alan Bol
- Maria Frostic
- Lon Goldstein
- Bryan Guarente
- Dr. Vickie Johnson
- Tsvetomir Ross-Lazarov
- Marianne Weingroff
Media Production Group
- Bruce Muller, Group Manager
- Steve Deyo
- Dan Riter
- Carl Whitehurst
Meteorologists/Scientists
- Dr. Greg Byrd, Senior Project Manager
- Wendy Schreiber-Abshire, Senior Project Manager
- Dr. William Bua
- Patrick Dills
- Matthew Kelsch
- Dolores Kiessling
- Dr. Cody Kirkpatrick
- Dr. Arlene Laing
- Dave Linder
- Dr. Elizabeth Mulvihill Page
- Amy Stevermer
Spanish Translations
- David Russi
NOAA/National Weather Service - Forecast Decision Training Branch
- Anthony Mostek, Branch Chief
- Dr. Richard Koehler, Hydrology Training Lead
- Brian Motta, IFPS Training
- Dr. Robert Rozumalski, SOO Science and Training Resource (SOO/STRC) Coordinator
- Ross Van Til, Meteorologist
- Shannon White, AWIPS Training
Meteorological Service of Canada Visiting Meteorologists
- Brad Snyder