
Introduction
Welcome to this lesson on altimetry!
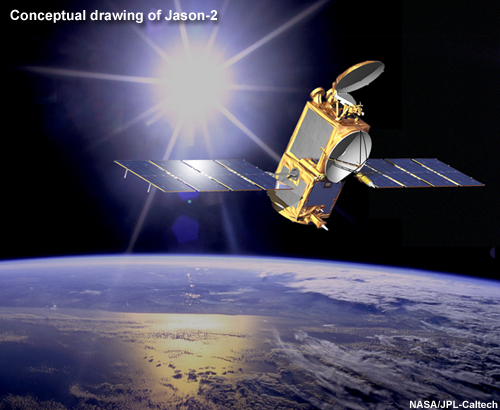
This lesson uses Jason-2 to show how altimeters work and the general applications possible with altimeters.
Since Jason-2 was launched other altimeters have become available (e.g. Altika, Cryosat, Jason 3) and more will become available in the near future (e.g. Sentinel 3) - they all follow the principles and applications described in this lesson.
Overview of Jason-2 and satellite altimetry

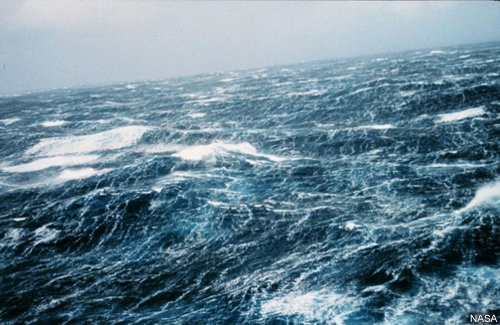
The secrets of the ocean are being unlocked through the use of radar altimeters on board satellites such as Jason-2.
Satellite altimeters measure sea surface height and other characteristics of the ocean surface, which are linked to underlying processes and structures. This makes the data useful for understanding the full depth of the global ocean, from the surface down to the sea floor.
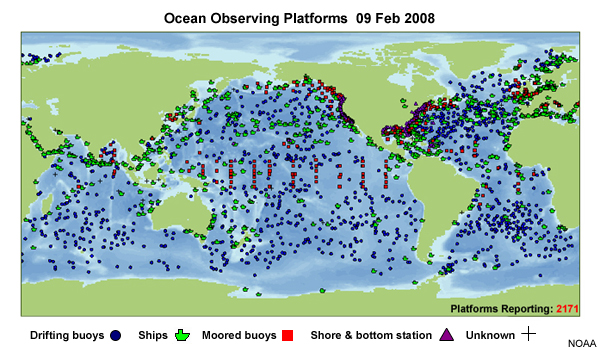
Before the advent of satellite altimetry, our knowledge of the ocean came primarily from buoys, ships, and tidal gauges whose distribution was limited to certain parts of the world. This contributed to a rather superficial view of the ocean: it was thought to be steady and unchanging.
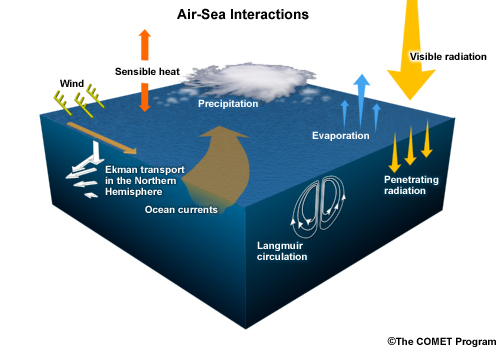
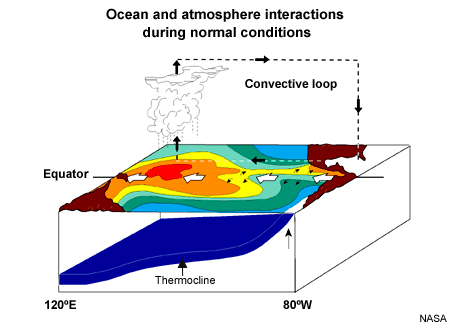
Our understanding has deepened and we now know that the ocean is a great reservoir in continual exchange of heat, moisture, and momentum with the atmosphere. The ocean drives weather and climate patterns and governs slow, subtle climate changes as it heats and cools, moistens and dries the air, and affects wind speed and direction.
The long time series of altimetry measurements have also enabled us to understand ocean dynamics and their spatial and temporal scales.
How altimetry data are used
Here's a sampling of what scientists have been able to accomplish with altimetry data.
- Measure sea surface height, which is key to monitoring sea level rise and global climate change
- Measure the surface topography of the world's oceans to within a few centimetres, which is important for accurately describing seasonal and inter-annual climate variations, etc.

- Improve our understanding and modelling of hurricanes
- Map seasonal and spatial distributions of wave height and wind velocity, which is important for coastal
communities and off-shore industries
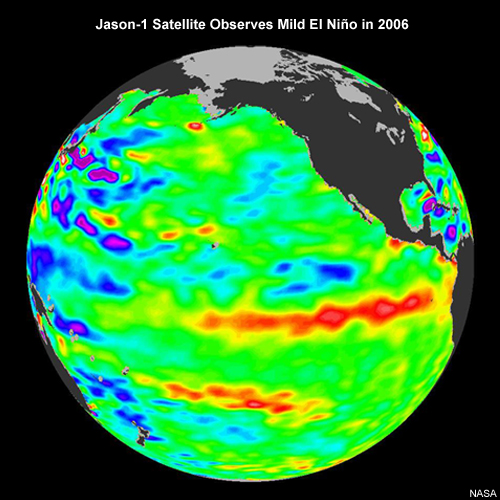
- Assist with the early detection, analysis, and monitoring of climate events such as the El Niño
Southern Oscillation or ENSO
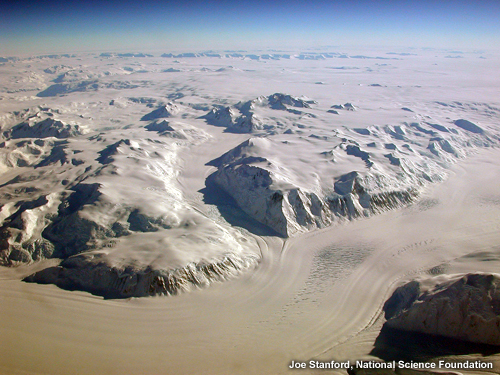
- Expand the suite of data and tools used to monitor the world's ice sheets, glaciers, and sea ice,
improving measurement accuracy
- Improve medium- and long-term weather forecasting based on a better understanding of ocean-atmospheric
coupling
The basics of satellite altimetry
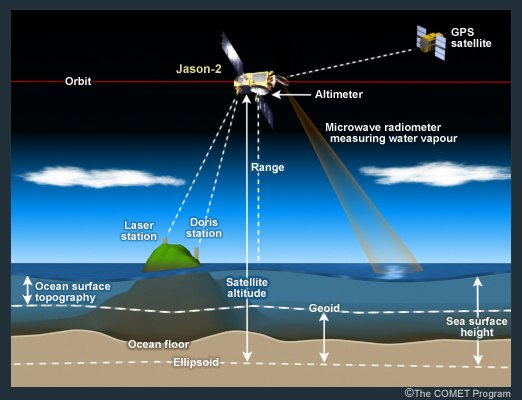
Altimetry satellites determine the height of the ocean surface with respect to a reference such as the average global sea level (known as the Earth’s “geoid”). Orbiting altimeters make very precise measurements of the ocean’s surface topography to derive the speed and direction of ocean currents and eddies, and to observe tides and other features.
Altimetry satellites determine the distance from the satellite to the Earth’s surface by measuring the time it takes a radar pulse to travel from the satellite to the surface and back.
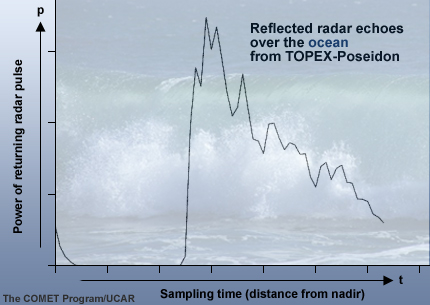
The magnitude and shape of the radar echoes (or waveforms) contain additional information about the characteristics of the surface. For example, reflected radar echoes over the ocean are used to analyze wave height, derive information about wave period, and analyze sea ice.
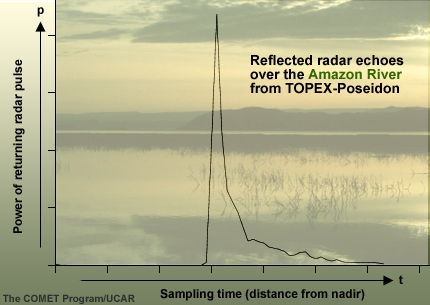
Over land, echoes help characterize land types, such as complex river systems, lakes, ice sheets, and glaciers.
The main components in the satellite altimetry system are:
- The radar altimeter and antenna, which measure sea surface height
- The radiometer, which measures atmospheric disturbances
- The systems for determining the satellite's precise location in orbit
The latter is a critical element for obtaining accurate measurements of sea surface height and has been a key area of improvement in recent altimetry missions.
Additional information on satellite altimetry (optional)
Radar altimeters transmit
pulses of microwave energy (more than 1700 pulses per second) toward Earth and receive the echoes after the
pulses are reflected by the surface.
The distance between the satellite and ocean surface (the “range”) is determined from the precise round-trip time it takes for a pulse to travel between the satellite and sea surface. Averaging many estimates over each second produces very accurate measurements of the satellite-to-ocean-surface range.
Atmospheric phenomena, such as water vapour, can affect the speed of the pulses and must be corrected for. Once this is done, the final range can typically be estimated to within 2 cm.
To derive a meaningful sea surface height, this range is subtracted from the satellite’s orbital position relative to an arbitrary reference surface known as a reference ellipsoid. This is an approximation of the Earth’s surface, a sphere flattened at the poles.
The most important ingredient in determining the satellite’s orbit is satellite-tracking information provided by tracking technologies. For Jason-2, this includes the Doris ground radio receivers, satellite laser ranging stations, and an onboard GPS receiver. The tracking information is then combined with models of the forces that govern satellite motion.
OSTM and Jason-2

Launched in 2008, Jason-2 is the first space-based component of the Ocean Surface Topography Mission (OSTM). OSTM is a joint European-United States effort to take oceanographic studies of sea surface height into operational mode for climate forecasting and a variety of operational applications. OSTM has an expected duration of 20 years, with Jason-2 expected to provide service for five years.
The scientific goals of OSTM/Jason-2 are to:
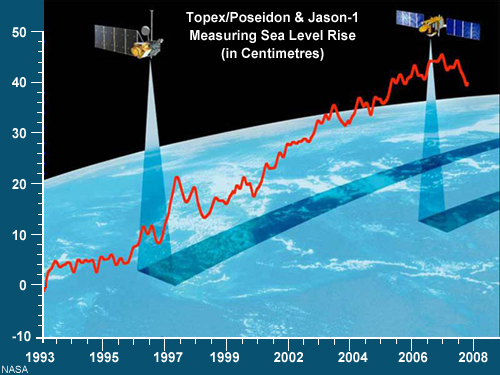
- Extend by two decades the time series of ocean surface topography measurements begun in 1992 with the TOPEX/Poseidon satellite and continued with the Jason-1 satellite in 2001
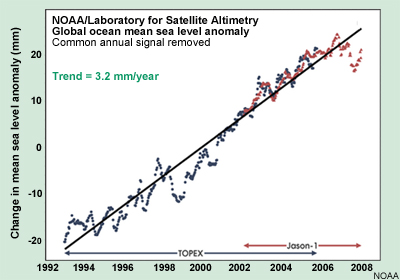
- Monitor the variation of the global mean sea level and its relation to global climate change
- Determine the general ocean circulation and understand its role in Earth’s climate
- Study the variation of ocean circulation on time scales ranging from seasonal to annual to decadal and how the variations affect climate change
- Contribute to and improve the calculation of the transport of heat, water mass, nutrients and salt by the ocean
- Provide estimates of significant wave height and wind speeds over the ocean
- Help improve short- to mid-term weather forecasts
- Improve our knowledge of ocean tides and develop open-ocean tide models
The organisations involved with OSTM include:
- France's Centre National d'Etudes Spatiales (CNES): CNES was in charge of overall system integration; provided two instruments and the PROTEUS bus; and launched the satellite in conjunction with NASA.
- United States National Aeronautics and Space Administration (NASA): NASA provided three instruments and the launcher; and launched the satellite in conjunction with CNES.
- The United States National Oceanic and Atmospheric Administration (NOAA) and the European Organisation for the Exploitation of Meteorological Satellites (EUMETSAT): Both organisations process and archive the data and disseminate near real-time products to the international scientific community.

Do you know how the satellite series got its name? It was named for Jason, the mythological Greek mariner who, with his team of heroes known as the Argonauts, was the first to sail the ocean.
More about Jason-2
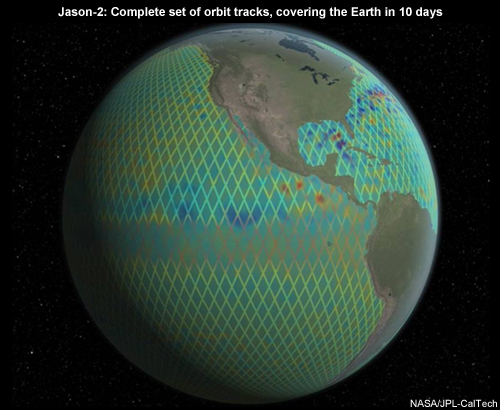
Jason-2 flies in a low-Earth orbit at an altitude of 1336 km. With global coverage between 66°N and 66°S latitude and a 10-day repeat of the ground track, Jason maps 95% of the world's ice-free oceans every ten days. Sea surface height accuracy is currently 3.4 centimetres, with 2.5 expected in the future.
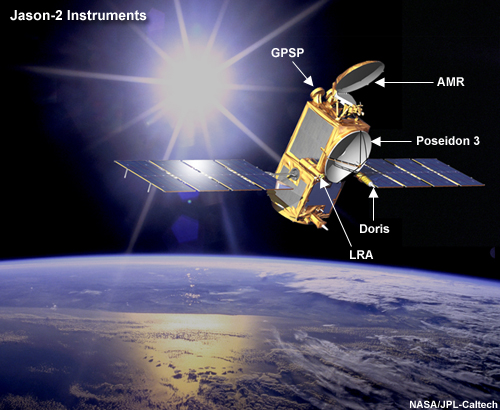
The main instruments on Jason-2 are:
- The Poseidon-3 dual frequency altimeter and its antenna used to measure sea surface height, wind speed, and significant wave height; it is the primary instrument onboard Jason-2 and was supplied by CNES
- The Advanced Microwave Radiometer (AMR), which measures disturbances due to water in the atmosphere; it was developed at NASA’s Jet Propulsion Laboratory (JPL)
- Three systems for determining the satellite’s precise location in orbit: the Doppler Orbitography and Radio-positioning Integrated by Satellite package (DORIS, developed by CNES), the Laser Retroreflector Array (LRA, supplied by NASA), and the Global Positioning System Payload (GPSP) receiver (designed by NASA/JPL)
The structure of the module
The rest of the module provides more in-depth information about satellite altimetry and Jason-2. Sections two, three, and four form a block, which examines the contributions of satellite altimetry to key ocean-related fields from three different perspectives:
- The historical perspective: Section two traces the discoveries and advances made possible by altimetry data
- The scientific perspective: Section three describes how altimetry data have expanded our scientific understanding of oceanography, which deals with the systematic, long-term, and routine measurement of the seas, oceans, and atmosphere and the rapid interpretation and dissemination of forecasts; marine meteorology, which deals with the physics of the marine atmosphere, including atmospheric phenomena over the ocean, their impact on shallow and deep water, and the influence of the ocean surface on atmospheric processes, such as convection; the marine geosciences, which examine the physical properties, composition, and dynamics of the Earth; the cryosphere, which deals with the parts of Earth’s surface where water is in solid form, including sea, lake, and river ice, snow cover, glaciers, ice caps, ice sheets, and frozen ground; and hydrology, which deals with the distribution, movement, and characteristics of water across the Earth
- The applications perspective: Section four describes the practical applications of altimetry data in the marine geosciences, marine meteorology, hydrology, oceanography, and climate studies, which aim to improve our understanding of the climate system, its variability, and its potential for change
Going through all three sections will provide you with a well-rounded view of the impacts and benefits of satellite altimetry on the major ocean-related fields. If you are only interested in specific fields, feel free to focus on them and disregard the others. (This doesn't apply, though, if you are going to take the module quiz.)
The final section of the module, section five, describes Jason-2 and its products and services.
Goals and audience
By the end of the module, you should be able to:
- Describe the concept of radar altimetry and how altimetry instruments measure sea surface height
- Describe the practical applications of altimetry data in a variety of ocean-related fields
- Describe the types of products made from altimetry data that are available to users
The module is intended for a broad audience, including those who:
- Use altimetry products
- Want to learn how satellite altimetry is used to describe and explore the ocean and its connection to climate and climate change, and
- Are involved with policy or research and want an introduction to satellite altimetry and the OTSM programme
A basic knowledge of oceanography, atmospheric science, or the geosciences is useful although not required.
 A note about the narrator: This module is narrated by Francois Parisot, the
Jason-2 Product and Service Manager at EUMETSAT. He is responsible for managing the organization’s
contribution to the deployment and operations of the Ocean Surface Topography Mission (OSTM)/Jason-2 and
related interactions with OSTM programme partners. Prior to this, he worked at CNES, first as the
TOPEX/Poseidon and Jason Department Head and then as Mission and Satellite Manager for the Jason-1 mission
through its 2001 launch.
A note about the narrator: This module is narrated by Francois Parisot, the
Jason-2 Product and Service Manager at EUMETSAT. He is responsible for managing the organization’s
contribution to the deployment and operations of the Ocean Surface Topography Mission (OSTM)/Jason-2 and
related interactions with OSTM programme partners. Prior to this, he worked at CNES, first as the
TOPEX/Poseidon and Jason Department Head and then as Mission and Satellite Manager for the Jason-1 mission
through its 2001 launch.
History
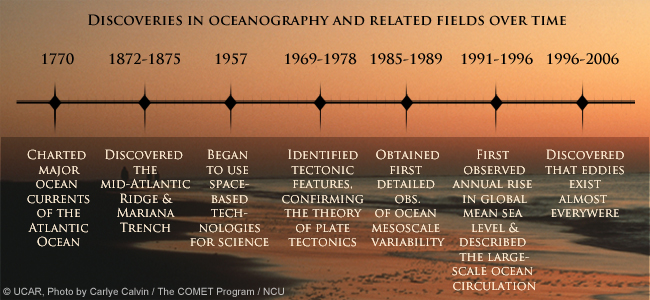
Overview of discoveries over time
Take a minute to consider the following. When do you think the following discoveries and advances were made? What impact might they have had? What future discoveries did they enable?
- The major ocean currents of the Atlantic Ocean were charted for the first time
- Space-based technologies began to be used for scientific purposes
- We confirmed the theory of plate tectonics by identifying large-scale tectonic features on the ocean floor
- The mid-Atlantic Ridge and Mariana Trench were discovered
- The large-scale ocean circulation was first described
- Ocean mesoscale circulations, such as eddies, were discovered to exist nearly everywhere
- We discovered and began tracking the annual rise in global mean sea level
The timeline
Introduction to the timeline
The rest of this section expands on the timeline, describing achievements in oceanography and related fields, many of which have been made possible by satellite altimetry. You'll see how a technology that began with limited goals has revolutionised a host of scientific disciplines and led to a proliferation of practical applications. As you read through the history, notice how improvements in the accuracy of altimetry measurements have led to the discovery and monitoring of both smaller- and larger-scale phenomena and how a longer data record has enabled us to discover, monitor, and better understand long-term phenomena.
1770

The Atlantic Ocean's Gulf Stream was mapped for the first time in 1770. It was done by Benjamin Franklin, who collected information from fisherman and ship captains and later recorded wind and temperature data as he crossed the Atlantic. Thereafter, ship captains were advised to follow the path of the Gulf Stream to save time and money.
1872 to 1875
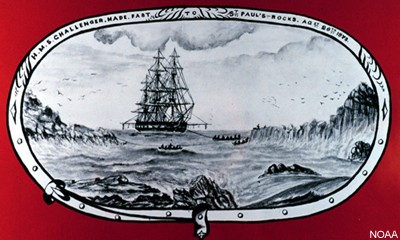
Oceanography was first viewed as a scientific discipline during this period.
The HMS Challenger Expedition sampled oceans across the globe, resulting in numerous discoveries about:
- Ocean currents and temperatures
- Large-scale details of the ocean floor, including the mid-Atlantic Ridge and Mariana Trench, and
- Thousands of new species of ocean life forms
1957
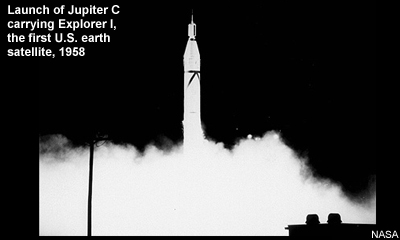
1957 was the International Geophysical Year and marked the beginning of science in space. Using rockets, artificial satellites, and other technologies developed during and after WWII, major discoveries were made in oceanography, meteorology, and a range of other disciplines.
1969 to 1978
1969 is considered the beginning of the altimetry era. The possibility of space-based oceanography using radar observations was first discussed, leading to the development and launch of the first altimetry satellites. From there, we were able to do the following:
- Demonstrate that we could measure ocean surface features due to variations in gravity linked to seafloor topography
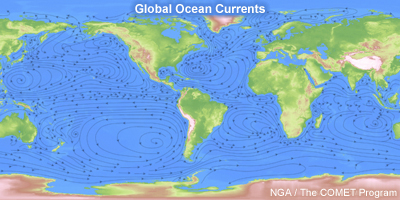
- Infer the ocean circulation and surface currents
- Produce the first observations of global ocean topography and wave heights, which provided insight into the links between the ocean and atmosphere that drive Earth's climate
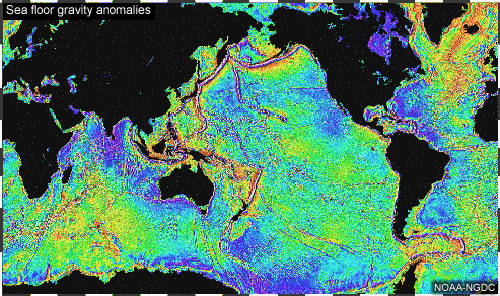
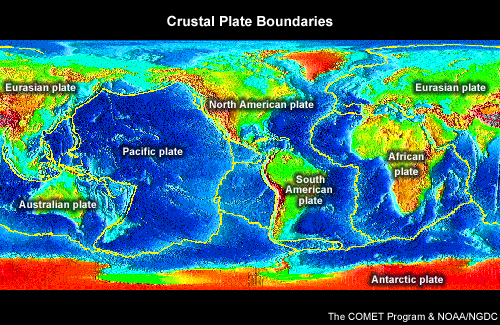
- Produce the first maps of the seafloor and Earth's gravity field, which revealed large-scale tectonic features on the ocean floor; this confirmed the theory of plate tectonics proposed in the first half of the 20th century to describe the motions of the Earth's continents
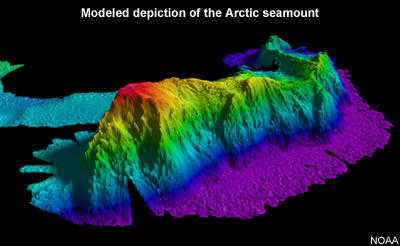
- Discover seamounts (underwater mountains and volcanoes) and seamount chains
- Demonstrate that altimetry could be used to investigate mesoscale variations in the ocean circulation related to currents and eddies
1985 to 1989
During this period, the accuracy of altimetry observations enabled the first detailed observations of ocean mesoscale variability. This led to the study of surface geostrophic currentsand jets in the Gulf Steam, Kuroshio Current, and Antarctic Circumpolar Current. (A geostrophic current is one that results from the balance between gravity and the Coriolis force, which is related to Earth’s rotation.)
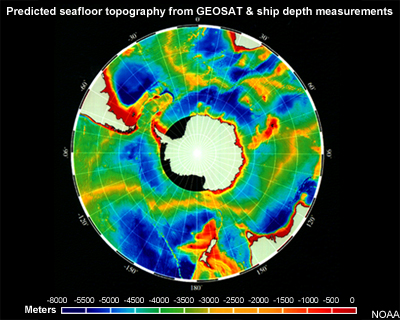
The ability to map the ocean floor led to several finer-scale discoveries about the ocean’s geological
features related to plate tectonics, fracture zones, ridges, seamounts, and valleys.
This graphic of predicted seafloor topography shows the best estimate of seafloor topography of the
southern oceans at the time.
1991 to 1996
During this period, the accuracy of altimetry observations was improved to the centimetre scale.
The first high-resolution (20-km) two-dimensional gravity field was mapped, improving:
- Bathymetry (ocean surface) maps
- The description of Earth's geoid
- Satellite orbit models, which led to improvements in altimeter-derived sea surface height
Fine-scale data were also used to improve our understanding of the seafloor structure, tectonic plates, and
discover new features on the ocean floor.
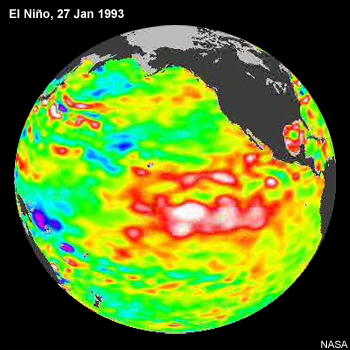
We first observed and tracked an El Niño event in progress (the one from May 1991 to June 1993), which improved our understanding of the evolution of large-scale atmospheric-ocean oscillations.

Finally, the global ocean surface topography was mapped with sufficient accuracy to describe and study the large-scale ocean circulation.
1996 to 2006
This period saw explosive growth in ocean and climate studies made possible by a longer and more accurate time series of sea surface measurements from altimetry satellites. The simultaneous presence of multiple altimetry satellites in orbit led to much better spatial and temporal coverage and resolution, which improved our understanding of mesoscale features in particular.
- Seasonal cycles were first observed with high accuracy, enabling the testing of ocean circulation models. Altimetry data have revolutionized ocean modelling, leading to improved ocean and climate forecasts.
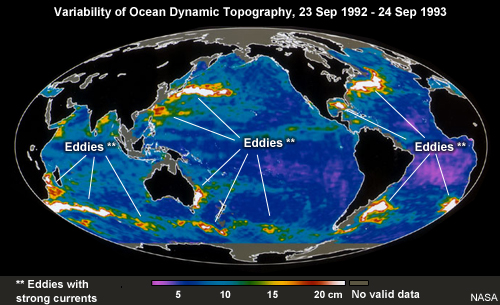
- Ocean eddies were discovered to exist almost everywhere.
- Satellite altimeters began measuring sea level on a global basis with unprecedented accuracy.
- A better understanding of inter-seasonal and multi-decadal variability and climate oscillations led to improvements in climate prediction models.
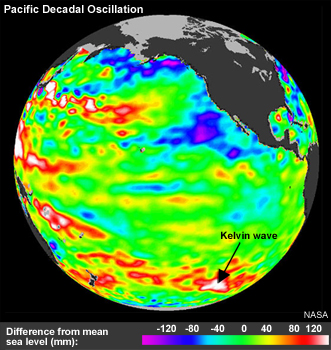
- The presence of planetary-scale oceanic Rossby and Kelvin waves were confirmed. These are ocean waves hundreds to thousands of km across and just a few centimetres high, which have major effects on the large-scale ocean circulation, and impact weather and climate.
- We discovered that deep ocean waves travel twice as fast as previously thought, establishing that the ocean responds much more quickly to climate changes.
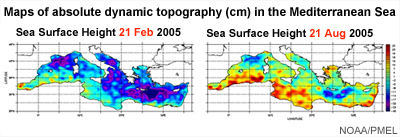
- Oceanic seasons (seasonal changes in sea-level height caused by a change in heat content and prevailing winds) were discovered in the Mediterranean Sea.
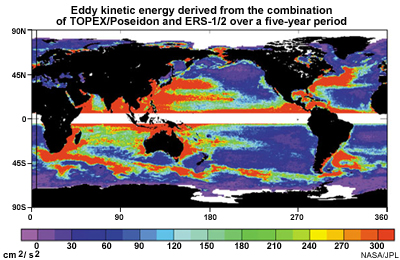
- The value of using datasets from multiple altimeters was recognised. For example, they improve the depiction of mesoscale surface circulations and estimation of global eddy kinetic energy, which has important implications for ocean mixing, large-scale circulations and currents, and climate. This map shows eddy kinetic energy derived from two altimetry satellites, with a level of detail never before achieved at a global scale.
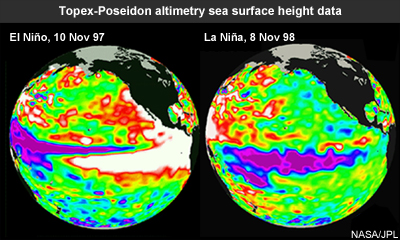
- We discovered that the 1997-98 El Niño event may have been a major contributor to a temporary
increase in average global sea level of about 10 mm.
- Finally, the combination of measurements from altimeters and in-situ data sources helped predict the onset
of climate events, such as the 2006-2008 El Niño/La Niña event and associated shifts in global
atmospheric weather patterns and precipitation.
2008 on
The goals of the OSTM/Jason-2 project, which began with the launch of Jason-2 in 2008, include the following:
- Improve our understanding of the variation of global mean sea level and its relation to global climate change
- Better understand the dynamics of the general ocean circulation at all temporal and spatial scales, including seasonal dynamics and eddies
- Better understand the variation of ocean circulation on time scales ranging from seasonal to annual to decadal and how the variations affect climate change
- Contribute to and improve our ability to calculate the transport of heat, water mass, nutrients and salt by the ocean
- Provide estimates of significant wave height and wind speeds over the ocean
- Help improve short- to mid-term weather forecasts, and
- Improve our knowledge of ocean tides and develop open-ocean tide models
Science
Introduction to the scientific perspective

In this section, we'll examine recent discoveries made possible by altimetry data in the major ocean-related disciplines.
Oceanography
Mesoscale dynamics
The most striking discoveries about ocean eddies and their transport of heat, energy, salt, carbon, and
nutrients have been made over mid- to high-latitude regions.
A decade-long time series of spatial sampling has allowed us to document and investigate the causes and
mechanisms of previously unobserved seasonal and inter-annual variations in eddy kinetic energy and eddy
transports.
Altimetery data have also shed light on how mesoscale eddies can impact the atmospheric circulation and weather phenomena such as tropical cyclones.
Finally, the data have revealed the presence of zonal (east-to-west) oceanic fronts and jets across the oceans.
Tidal science
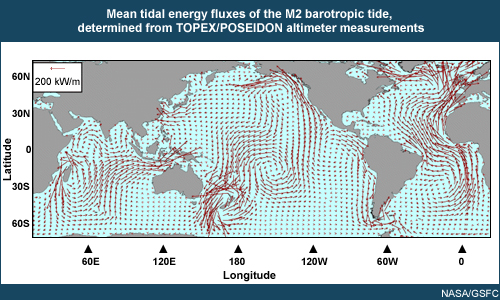
Assimilating Jason-2 measurements into numerical models is improving our understanding of the interactions of tides with coastlines, the internal waves generated by tides, and the dissipation of tidal energy. The latter is believed to be an important factor in the maintenance of the ocean's large-scale thermohaline circulation (also known as the ocean conveyer belt).
Improvements in tide prediction models and tidal mapping are expected to improve our understanding of ocean mixing and circulation as well as climate variability.
This plot, developed from altimetry data, shows how energy displaced from the semi-diurnal lunar tidal wave moves from areas in which it was generated towards dissipation areas.
Altimetry data have revealed other interesting findings.
For example, the energy dissipated on the Patagonian shelf, which has among the highest tides in the world, comes from the Pacific Ocean. 40% of the total energy contributed by the Earth/Moon system to ocean tides is dissipated in the North Atlantic.
Marine meteorology
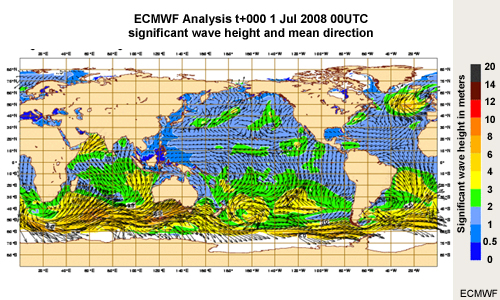
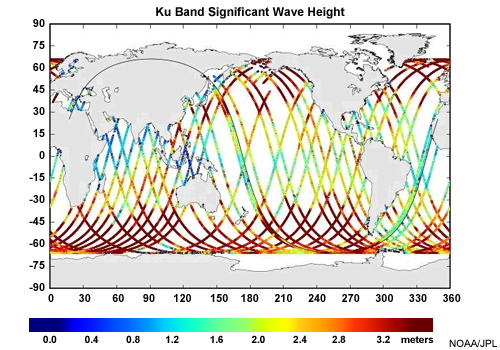
The assimilation of altimetry data has improved wave models such that they now yield more accurate wave analyses and forecasts. This is particularly true in tropical regions.
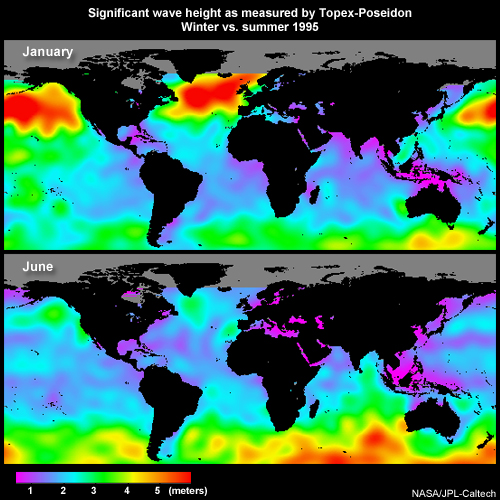
Long-term wave observations have let us build global wave climatologies, which are important to shipping and
other offshore interests. These same wave observations are also helping to extend the climate record by
improving past wave analyses from numerical prediction models.
Altimetry-based wind speed information has proven useful for monitoring extreme weather events, such as tropical cyclone conditions.
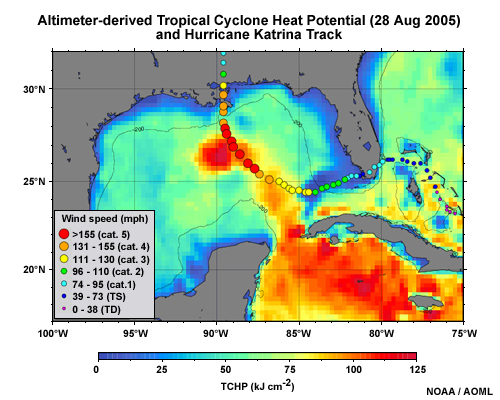
The combination of altimetry and sea surface temperature data is letting us study the impact of upper oceanic heat content on the intensification of tropical cyclones, such as Hurricane Katrina.
This product shows tropical cyclone heat potential computed from altimetry data on August 28, 2005, with the trajectory and intensity of Katrina overlaid. The hurricane’s intensification matches its path over the Loop Current as it absorbs the energy stored in the eddy of hot water.
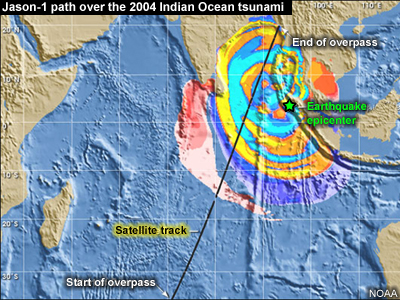
Altimetry data are also helping us improve our understanding and modelling of tsunamis. Tsunamis are series of waves generated when a body of water, such as an ocean, is rapidly displaced by underwater phenomena, such as volcanic eruptions.
Jason-1’s serendipitous track along the path of the December 2004 Indian Ocean tsunami event yielded ocean wave measurements that are helping scientists improve tsunami propagation and dissipation models.
Despite its contributions, satellite altimetry is not likely to be able to assist with the early detection and warning of tsunamis any time soon. Even with several altimeters in orbit at the same time, the probability of one being at the right place just after a tsunami is triggered is quite low. In addition, it is very difficult to develop ground systems capable of gathering, processing, and transferring data at the rate needed by early warning and alert systems.
Coasts are among the most fragile and important areas of the oceans, making it vital to study, monitor, and protect them. Studies estimate that over half of the world's population lives within 200 km of a coastline.
Satellite altimetry would seem to be a natural source of coastal data. However, prior to Jason-2, the data were too sparse and of poor quality to be of real use. Instrument improvements have enabled Jason-2 to more precisely monitor the ocean in coastal areas, which has led to a host of new applications. Examples include coastal resources management, coastal infrastructure sizing, and risk prevention.
Cryosphere
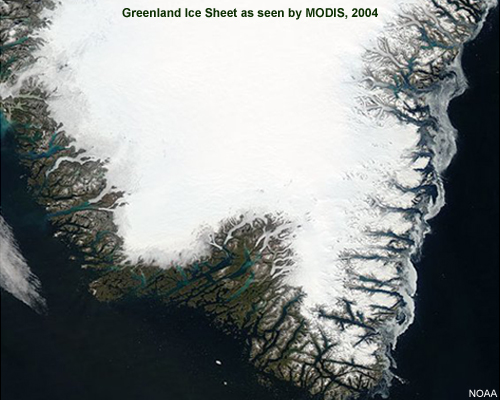
Satellite altimeters are one of the most important observing tools for measuring and monitoring the behaviour of ice sheets and sea ice.
Even though Jason-2 does not fly over the poles, it is used as a reference for other polar-orbiting altimeters. This improves the consistency of the overall data set.
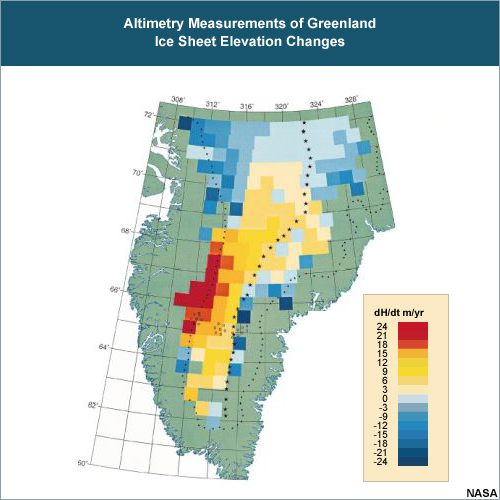
Since the early 1990s, altimetry data have let us calculate the ice sheet balance over Greenland and the Antarctic and led to the discovery of hydrological networks that link sub-glacial lakes and surface features.
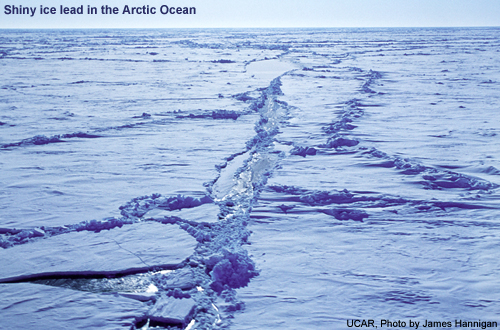
The data are also proving to be a unique tool for carefully mapping sea ice thickness and coverage, and monitoring volume changes.
In addition, altimetry data are helping us determine the freeze-melt cycle of large lakes, which is an important indicator of climate.
Hydrology
Observations of inland water, such as large lakes and the Amazon River Basin, were pioneered in the 1970s
with satellite altimetry. A long-term observational record of inland water has produced the majority of
meaningful measurements and studies that examine changes in lake levels and characterise river basins.
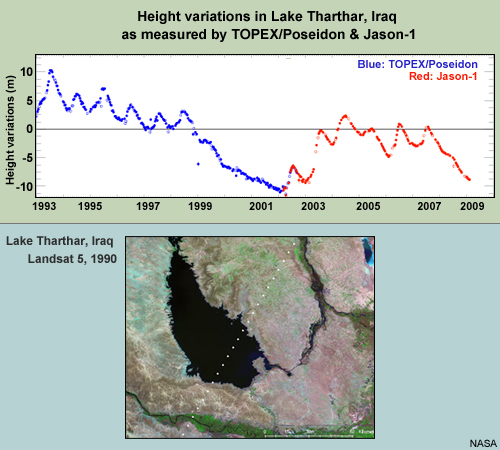
The graph shows declining lake levels in the Lake Tharthar region of Iraq during a drought that lasted
from 1999 to 2001. Since 2002, climate conditions have improved and lake levels have risen.
Marine geosciences
The modern age of the geosciences began with altimetry data. Early observations revealed the large-scale tectonic fabric of the seafloor, helping to test and confirm our understanding of plate tectonics on a regional and global basis.
The data were then used to create a more detailed depiction of the structure of the global seafloor, which increased our knowledge of tectonic history and bathymetry. Bathymetry is the measurement of the depth of the ocean floor from sea level—the oceanic equivalent of topography.
Fine-scale details in bathymetry and gravity have helped us refine tectonic models, delineate micro-plates, detect new seamounts (underwater mountains and volcanoes), and improve digital bathymetric maps.
Most of the global ocean has been mapped at a resolution of 12 to 20 km.
Applications
Practical applications of satellite altimetry

The global, near-real-time, high-accuracy, and high-resolution observations of sea surface topography from altimetry satellites are crucial to a variety of applications in fields ranging from oceanography and marine meteorology to climate monitoring and forecasting, the marine geosciences, and hydrology.
Oceanography
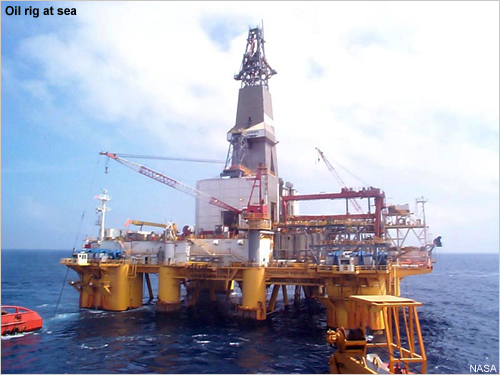
Offshore industries
Many offshore industries require accurate information about ocean circulation patterns to minimize the impact of strong currents and help maintain a steady location. Just think of ships exploring for oil and gas and or laying cable on the ocean floor. Strong eddies are particularly disruptive and can be detected in altimetry measurements of sea surface height.
Statistical data on wave height and strength are used when planning for the construction of offshore structures so they can withstand expected and extreme conditions.
On a day-to-day basis, wind and current altimetry data are used to alert ocean vessels about dangerous conditions that may be developing.
Altimetry data are also used to model the drift of oil slicks and determine where tankers are located and where spills are likely to come ashore.
Ship routing
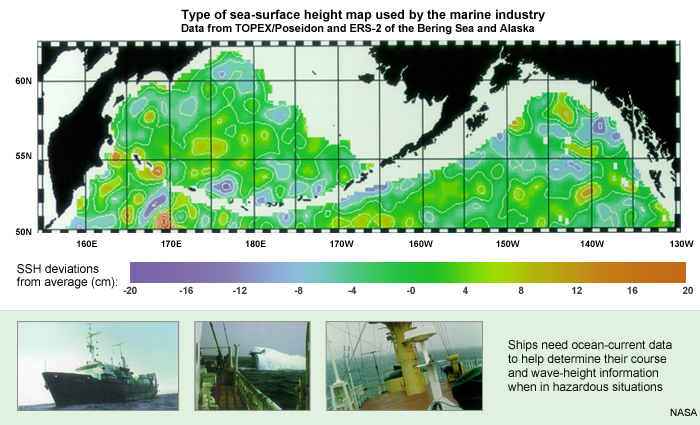
Ships ranging from large container vessels to fishing boats use altimetry products to, for example, identify wave heights and near-real time wind speeds over large areas and determine which regions of the oceans are impacted by strong ocean currents. Knowing where currents are located improves ship routing, which leads to fuel savings and other benefits.
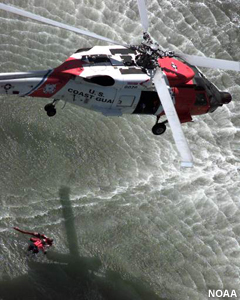
Integrating altimetry measurements into ocean forecast models also helps with search and rescue operations. The information helps target where ships in trouble are drifting so rescue crews can reach them as quickly as possible.
Fisheries management and marine mammal research
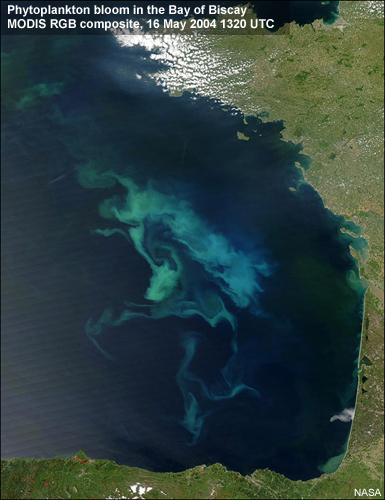
Life in the ocean is fundamental to life on Earth. Phytoplankton, in particular, is a major oxygen generator and carbon recycler for the planet, far more so than forests on land. Measurements of sea surface height from satellite altimeters complement and validate other data to determine the quantity, type, and distribution of phytoplankton.
Surface waters typically have limited nutrients. But when eddies appear, the swirling motions cause nutrients normally found in colder, deeper waters to rise to the surface, substantially increasing chlorophyll and plankton production. Mammals, such as sperm whales and fur seals, feast on the plankton, making eddy monitoring via satellite altimeters a useful way to track them. This kind of monitoring is also helpful for marine ecosystem research and commercial fishing, where measurements are used to identify areas likely to have higher fish concentrations and particular species.

These images correlate sudden phytoplankton blooms between Africa and Madagascar that were detected by a satellite-based vegetation sensor with eddies and currents seen by an altimetry satellite.
Wind and waves
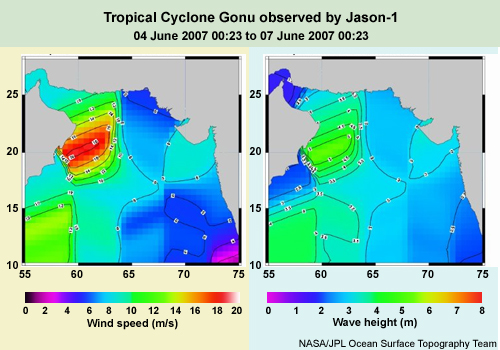
Altimetry data provide snapshots of wave height and wind speed across large areas. Weather and wave forecasting are improving as more accurate and timely altimetry measurements are assimilated into weather and ocean forecast models. This is aiding ship navigation, maritime safety, coastal planning, and climatology studies as well as the global monitoring of the state of the sea. Wave data are also being used to improve the design and operation of offshore structures.
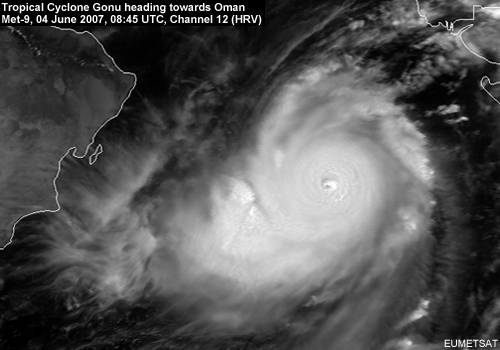
These graphs, made from Jason-1 data, show wind speeds and wave heights for Tropical Cyclone Gonu, which reached Category five strength in the Arabian Sea prior to landfall in early June 2007. Wave heights over five metres are extremely rare in the Arabian Sea and caused extensive flooding in some areas.
Tides

The precise forecasting of tides is vital for many maritime and coastal activities. Just consider this scene from World War II where large tidal ranges left a tank unloading operation marooned at low tide.
Marine meteorology
The high waves, strong winds, and storm surge characteristics of tropical cyclones can be measured by satellite altimeters. In addition, altimeters help quantify the heat stored in the upper oceans—heat that's available to fuel and intensify tropical cyclones.
It’s well known that tropical cyclones require warm water to form. Sea surface temperatures (SSTs) must be above 26°C throughout a depth of about 46 metres. Since SSTs can change rapidly due to mixing processes and correspond to only about the top 10 metres, SST by itself does not provide sufficient information about the heat content stored in the upper ocean to accurately forecast tropical cyclone intensity. We get far more reliable data from altimeters, since sea surface height anomalies are strongly correlated with the internal thermal structure of the ocean.
For example, studies show that the energy contained in the Loop Current (a warm current in the Gulf of Mexico) was a key factor in the intensification of Hurricane Katrina, which devastated the Gulf Coast of the United States in 2005. When the hurricane passed over the Florida peninsula into the Gulf of Mexico, it was a strong hurricane (Category three). But suddenly, about 24 hours before hitting New Orleans, it intensified into a Category five hurricane. Research later revealed a sea surface height anomaly corresponding to a deep layer of very warm water in the area of the Gulf over which Katrina passed, which fuelled the storm.
Altimetry measurements are beginning to be used for forecasting and predicting hurricane intensification.
Climate
Monthly and seasonal forecasting
Will we ever be able to make reliable monthly and even seasonal climate predictions? This is one of the major questions in meteorology and climate research today. It's unlikely that we will be able to predict the weather on a given day more than two weeks in advance. But by improving our understanding of the ocean's influence on the atmosphere, we should be able to better forecast the trends of upcoming seasons—for example, if they will be drier or wetter or hotter or colder than average. Near-real-time ocean state estimates from altimetry and other datasets are critical to producing reliable seasonal forecasts.
Climate events
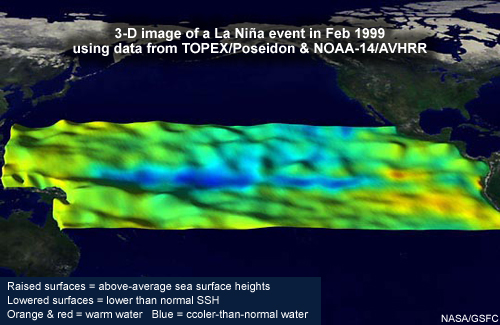
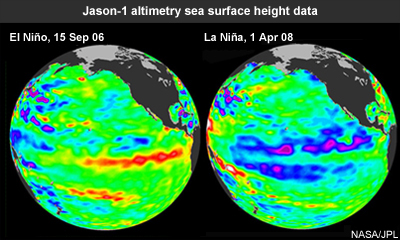
The ocean changes on a yearly and decadal basis due to long-term cyclical phenomena such as El Niño, La Niña, the Pacific Decadal Oscillation (PDO), and the North Atlantic Oscillation (NAO). Altimetry measurements are vital for the early detection, analysis, and monitoring of these types of large-scale tropical climate anomalies. The data help us predict when and how they will develop and anticipate and mitigate their impacts.
This 3-D graphic depicts a La Niña event using data from the TOPEX/Poseidon altimetry satellite and the NOAA-14/AVHRR polar-orbiting satellite. The raised surfaces represent above-average sea surface heights (SSHs), while the lowered ones represent lower than normal SSHs. Warm water is orange and red, and cooler-than-normal water is blue.
Hydrology
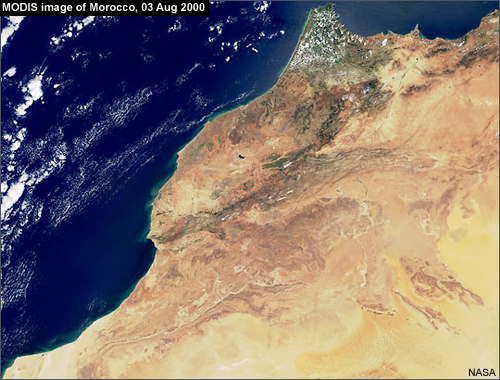
The magnitude and shape of the radar signals used to measure distance with altimetry satellites contain information about the characteristics of the surface off which they reflect.
The best results are obtained over the open ocean, which is a relatively homogeneous surface.
Surfaces with discontinuities or significant slopes, such as sea ice, ice sheets, rivers, and land, make accurate interpretation more difficult. Despite this, satellite altimetry is being used to help monitor the levels of lakes and rivers world-wide and manage regional water resources, particularly in remote regions where ground measurements are hard to obtain.
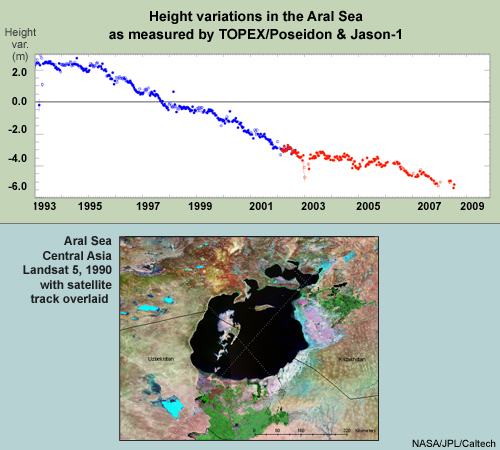
This image shows the alarming rate at which the Aral Sea in Central Asia has been shrinking. Where it was once a huge lake, it’s now split into two. Altimetry data have shown that the larger lake has declined from two metres above a mean level average in 1993 to six metres below that average in 2008. This is due to water being diverted from the rivers that fed the lake for irrigation and other purposes.
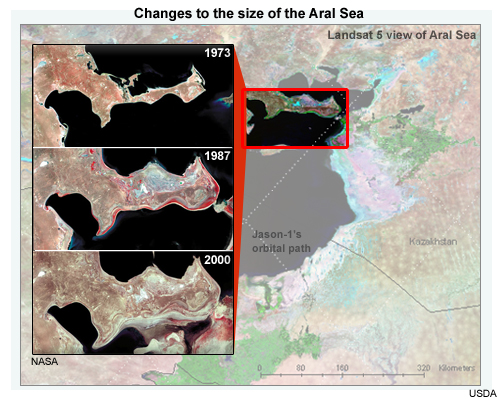
Over 60 percent of the lake has disappeared, causing serious environmental, socio-economic, and health problems to the land and nearby populations.
Marine geosciences
The height of the sea surface reflects phenomena and systems that occur throughout the full depth of the ocean, from the surface down to the sea floor. This makes altimetry data useful for studying the size and shape of the Earth, variations in gravity, seafloor topography, as well as the motion of tectonic plates.
For example, satellite altimeters have let us measure the rotation of the Antarctic Plate for the first time and see that the African and Eurasian plates are moving two centimetres closer to each other every year.
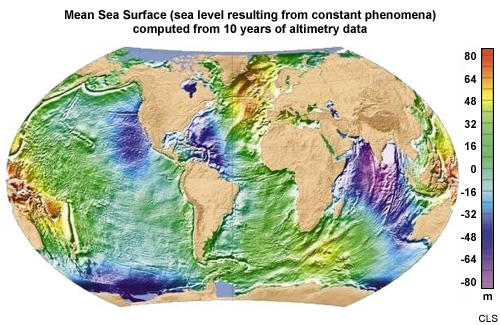
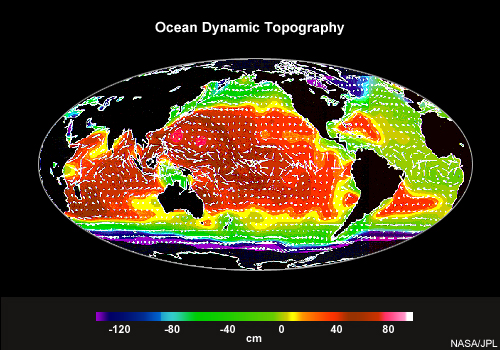
Here we see the mean sea surface resulting from constant phenomena, such as the gravity field and, to a lesser extent, permanent ocean currents, computed from ten years of altimetry data. Differences below the Earth's surface, such as variations in magma density and temperatures, can generate sea level variations of over 100 metres between areas that are thousands of kilometres apart.
Even on a scale of several kilometres, differences in ocean floor topography can cause surface height variations of several metres.
J-2 Services
Real-time services
OSTM/Jason-2 produces and distributes three global data products for the user community. One is delivered in near-real-time (three hours), while the other two are offline and delivered a few days or weeks later. All of the products cover the same key ocean parameters and use the same basic format. They differ according to the auxiliary data included and level of accuracy, with the latter increasing over time.
The Operational Geophysical Data Record (OGDR) was developed for Jason-2 and provides near-real-time data on surface wind speed and wave features along with a first estimate of sea surface height.
The primary purpose of the OGDR is to feed data to meteorological organisations carrying out near-real-time ocean condition forecasting. It is especially useful for numerical weather prediction, including atmosphere and ocean forecasting. It also makes data on sea surface height anomalies available to users.
The product is processed at the EUMETSAT and NOAA ground centres and disseminated over the EUMETCast satellite broadcasting system as well as through data networks and the Global Telecommunication System network.
Off-line services

Off-line products are generated by CNES and distributed by both CNES and NOAA.
- The Interim Geophysical Data Record (IGDR) provides analysed sea surface data produced within one to one and a half days of being recorded and includes sea surface height, absolute dynamic topography, and velocities for larger-scale ocean currents. The data are used in medium-range weather forecasting. This product shows surface velocity vectors in the Gulf Stream region on July 24, 1996. The magnitude of the velocities is shaded to indicate regions of high current speed.
- The Geophysical Data Record (GDR) provides fully-validated data on sea surface height produced within 60 days of events being recorded. The data are used principally for climate monitoring and modelling (verifying climate models), the routine validation of sea level observations from in situ stations, and the International Panel for Climate Change Assessment Report on rising sea levels.
Summary
About satellite altimetry
- Satellite altimeters measure sea surface height and other characteristics of the ocean surface, which are linked to underlying processes and structures. This makes the data useful for understanding the full depth of the global ocean.
- Altimetry satellites determine the distance from the satellite to the Earth’s surface by measuring the time it takes a radar pulse to travel from the satellite to the surface and back. They make very precise measurements of the ocean’s surface topography to derive the speed and direction of ocean currents and eddies and to observe tides and other features.
- The magnitude and shape of the radar echoes (or waveforms) contain additional information about the characteristics of the surface. For example, reflected radar echoes over the ocean are used to analyze wave height, derive information about wave period, and analyze sea ice. Over land, echoes help characterize land types, such as complex river systems, lakes, ice sheets, and glaciers.
Basic facts about Jason-2
- Flies in a low-Earth orbit (1336 km)
- Provides global coverage between 66°N and 66°S latitude
- Has a 10-day repeat of the ground track
- Maps 95% of the world’s ice-free oceans every ten days
- Sea surface height accuracy is currently 3.4 cm (2.5 expected in the future)
- Main instruments: Poseidon-3 dual frequency altimeter and antenna, which measure sea surface height, wind speed, and significant wave height; the Advanced Microwave Radiometer (ARM), which measures disturbances due to water in the atmosphere; and three systems for determining the satellite’s precise location in orbit (DORIS, LRA, GPSP receiver)
Scientific goals of OSTM/Jason-2
- Extend the time series of ocean surface topography measurements
- Monitor the variation of the global mean sea level and its relation to global climate change
- Determine the general ocean circulation and understand its role in Earth’s climate
- Study the variation of ocean circulation on time scales ranging from seasonal to annual to decadal and how the variations affect climate change
- Contribute to and improve the calculation of the transport of heat, water mass, nutrients and salt by the ocean
- Provide estimates of significant wave height and wind speeds over the ocean
- Help improve short- to mid-term weather forecasts
- Improve our knowledge of ocean tides and develop open-ocean tide models
Key events in the history of satellite altimetry
- 1969: Considered the beginning of the altimetry era
- 1985 to 1989: The accuracy of altimetry observations enabled the first detailed observations of ocean mesoscale variability, etc.
- 1991 to 1996: The accuracy of altimetry observations was improved to the centimetre scale.
- 1996 to 2006: Explosive growth in ocean and climate studies made possible by a longer and more accurate time series of sea surface measurements; the simultaneous presence of multiple altimetry satellites in orbit led to much better spatial and temporal coverage and resolution
Discoveries made possible by satellite altimetry
Oceanography
- Deepened our understanding of the causes and mechanisms of seasonal and inter-annual variations in eddy kinetic energy and eddy transports; the impact of mesoscale eddies on the atmospheric circulation and weather phenomena such as tropical cyclones; the presence of east-to-west oceanic fronts and jets across the oceans; and the interactions of tides with coastlines, the internal waves generated by tides, and the dissipation of tidal energy
- Helps improve tide prediction models and tidal mapping, which improves our understanding of ocean mixing and circulation and climate variability
Marine meteorology
- Has improved wave models, which provide more accurate wave analyses and forecasts, particularly in tropical regions
- Has led to the development of global wave climatologies, which are important to shipping and other offshore interests and help extend the climate record
- Helps monitor extreme weather events, such as tropical cyclone conditions
The cryosphere
- Helps measure and monitor the behaviour of ice sheets and sea ice
- Enabled the discovery of networks linking sub-glacial lakes and surface features
- Enabled careful mapping of sea ice thickness and coverage, and monitor volume changes
- Helps determine the freeze-melt cycle of large lakes (an important climate indicator)
Hydrology
- Provides a long-term observational record of inland water
- Produces the majority of measurements and studies that examine changes in lake levels and characterise river basins
Marine geosciences
- Helps test and confirm our understanding of plate tectonics regionally and globally and more accurately depict the structure of the global seafloor
- Helps refine tectonic models, delineate micro-plates, detect new seamounts, and improve digital bathymetric maps
- Has been used to map most of the global ocean at a resolution of 12 to 20 km
Practical applications of satellite altimetry
Oceanography
- Assimilation into weather and ocean forecast models improves weather and wave forecasting, which aids ship navigation, maritime safety (including search and rescue operations), coastal planning, climatology studies, global monitoring of the state of the sea, and the design/operation of offshore structures
- Helps determine the quantity, type, and distribution of phytoplankton (a major oxygen generator and carbon recycler for the planet), track sea mammals, and assist with marine ecosystem research and fishing
Marine meteorology
- Helps measure high waves, strong winds, and storm surge characteristics of tropical cyclones
- Helps quantify the heat stored in the upper oceans—heat that’s available to fuel and intensify tropical cyclones
- The data are starting to be used for forecasting and predicting hurricane intensification
Climate studies
- Is improving our understanding of the ocean's influence on the atmosphere
- Is critical to producing reliable seasonal forecasts and detecting, analyzing, and monitoring large-scale tropical climate anomalies
Hydrology: Helps monitor the levels of lakes and rivers world-wide and manage regional water resources
Marine geosciences: Is used to study the size and shape of the Earth, variations in gravity, seafloor topography, and the motion of tectonic plates
Jason-2 products and services
- Interim Geophysical Data Record (IGDR): Provides analysed sea surface data produced within one to one and a half days of being recorded; includes sea surface height, absolute dynamic topography, and velocities for larger-scale ocean currents; the data are used in medium-range weather forecasting, seasonal forecasting, and ocean weather applications
- Geophysical Data Record (GDR): Provides fully-validated data on sea surface height produced within 60 days of events being recorded; used principally for climate monitoring and modelling, validating sea level observations from in situ stations, and the International Panel for Climate Change Assessment Report on rising sea levels
Visit either of the following links for additional information on Jason-2, the Ocean Surface Topopgraphy Mission, and altimetry:
Jason-2 (EUMETSAT):
http://www.eumetsat.int/Home/Main/Satellites/Jason-2/index.htm?l=en
AVISO site:
http://www.aviso.oceanobs.com/
Links
Visit either of the following links for additional information on Jason-2, the Ocean Surface Topopgraphy Mission, and altimetry:
Jason-2 (EUMETSAT):
http://www.eumetsat.int/Home/Main/Satellites/Jason-2/index.htm?l=en
AVISO site:
http://www.aviso.oceanobs.com/
Contributors
COMET Sponsors
The COMET® Program is sponsored by NOAA National Weather Service (NWS), with additional funding by:
- Air Force Weather (AFW)
- Australian Bureau of Meteorology (BoM)
- European Organisation for the Exploitation of Meteorological Satellites (EUMETSAT)
- Meteorological Service of Canada (MSC)
- National Environmental Education Foundation (NEEF)
- National Polar-orbiting Operational Environmental Satellite System (NPOESS)
- NOAA National Environmental Satellite, Data and Information Service (NESDIS)
- Naval Meteorology and Oceanography Command (NMOC)
Project Contributors
Principal Science Advisors
- Patrick Dills — UCAR/COMET
- Francois Parisot — EUMETSAT
- Sally Wannop — EUMETSAT
- Cecilie Wettre — EUMETSAT
Project Lead/Instructional Design
- Marianne Weingroff — UCAR/COMET
Graphics/Interface Design
- Steve Deyo — UCAR/COMET
- Brannan McGill — UCAR/COMET
- Marianne Weingroff — UCAR/COMET
Multimedia Authoring
- Dan Riter — UCAR/COMET
- Marianne Weingroff — UCAR/COMET
Audio Editing/Production
- Steve Deyo — UCAR/COMET
- Seth Lamos — UCAR/COMET
- Marianne Weingroff — UCAR/COMET
Audio Narration
- Francois Parisot — EUMETSAT
COMET HTML Integration Team 2021
- Tim Alberta — Project Manager
- Dolores Kiessling — Project Lead
- Steve Deyo — Graphic Artist
- Ariana Kiessling — Web Developer
- Gary Pacheco — Lead Web Developer
- David Russi — Translations
- Tyler Winstead — Web Developer
COMET Staff, April 2009
Director
- Dr. Timothy Spangler
Deputy Director
- Dr. Joe Lamos
Administration
- Elizabeth Lessard, Administration and Business Manager
- Lorrie Alberta
- Michelle Harrison
- Hildy Kane
Hardware/Software Support and Programming
- Tim Alberta, Group Manager
- Bob Bubon
- James Hamm
- Ken Kim
- Mark Mulholland
- Wade Pentz, Student
- Jay Shollenberger, Student
- Malte Winkler
Instructional Designers
- Dr. Patrick Parrish, Senior Project Manager
- Dr. Alan Bol
- Lon Goldstein
- Bryan Guarente
- Dr. Vickie Johnson
- Tsvetomir Ross-Lazarov
- Marianne Weingroff
Media Production Group
- Bruce Muller, Group Manager
- Steve Deyo
- Seth Lamos
- Brannan McGill
- Dan Riter
- Carl Whitehurst
Meteorologists/Scientists
- Dr. Greg Byrd, Senior Project Manager
- Wendy Schreiber-Abshire, Senior Project Manager
- Dr. William Bua
- Patrick Dills
- Dr. Stephen Jascourt
- Matthew Kelsch
- Dolores Kiessling
- Dr. Arlene Laing
- Dr. Elizabeth Mulvihill Page
- Amy Stevermer
- Warren Rodie
- Dr. Doug Wesley
Science Writer
- Jennifer Frazer
Spanish Translations
- David Russi
NOAA/National Weather Service - Forecast Decision Training Branch
- Anthony Mostek, Branch Chief
- Dr. Richard Koehler, Hydrology Training Lead
- Brian Motta, IFPS Training
- Dr. Robert Rozumalski, SOO Science and Training Resource (SOO/STRC) Coordinator
- Ross Van Til, Meteorologist
- Shannon White, AWIPS Training
Meteorological Service of Canada Visiting Meteorologists
- Phil Chadwick
- Jim Murtha