Media elements used in this module are protected by a variety of copyright licenses. Please use the "copyright terms" link associated with each item below for more information.
Description:
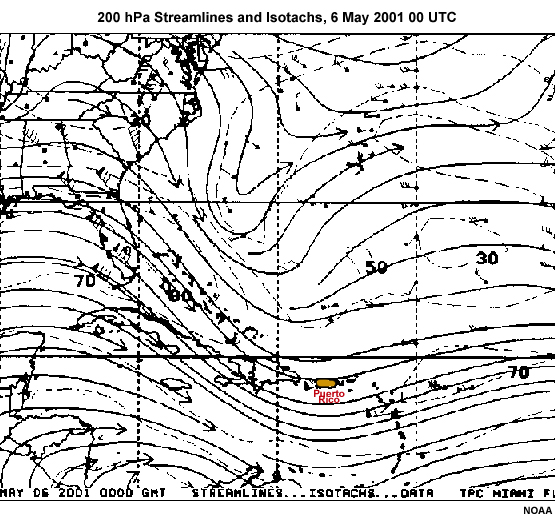
Streamline analysis at 0000 UTC on 6 May 2001.
File Name:
200mb_may6_00z.jpg
Credits:
NOAA
Copyright Terms:
COMET Standard Terms of Use
Description:
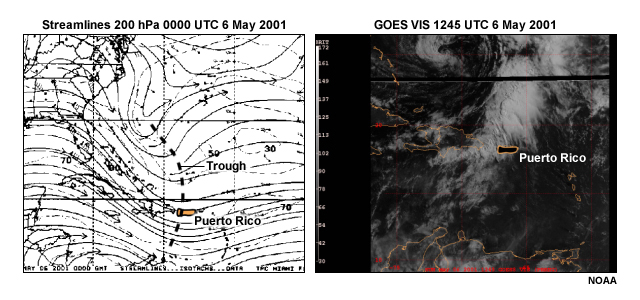
200 hPa streamline analysis showing tropical upper tropospheric trough at 0000 UTC 6 May 2001 and visible satellite image from 1245 UTC.
File Name:
200mb_vis.jpg
Credits:
NOAA
Copyright Terms:
COMET Standard Terms of Use
Description:
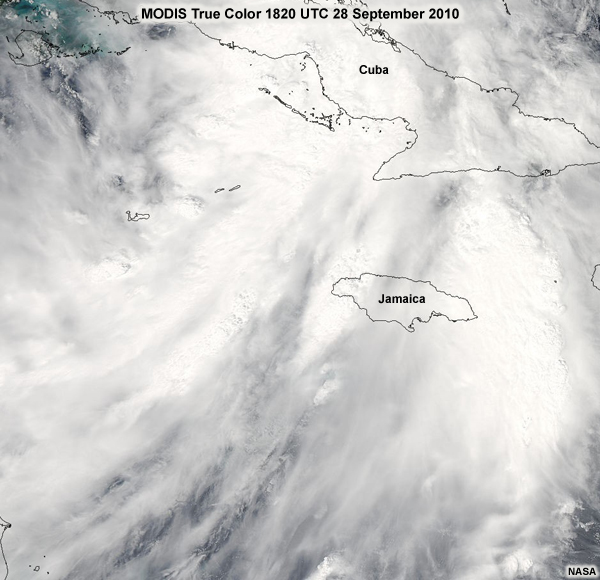
MODIS true color image at 1820 UTC, 28 September 2010.
File Name:
201009281820UTC_Nicole_MODIS.jpg
Credits:
NASA
Copyright Terms:
COMET Standard Terms of Use
Description:
250 GFS Analysis for the Caribbean and Tropical Atlantic for 0000 UTC 23 December 2009
File Name:
250_turbulence_feedback.jpg
Credits:
NOAA/NCEP
Copyright Terms:
COMET Standard Terms of Use
Description:
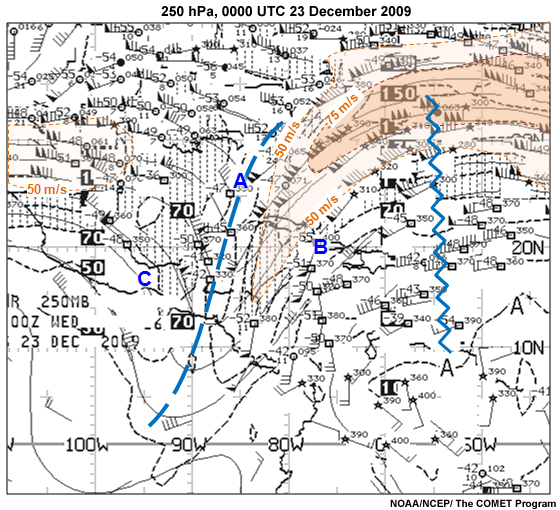
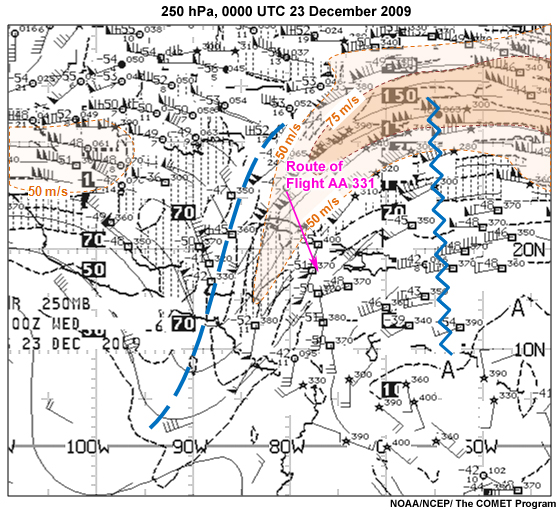
250 GFS heights and wind velocity for the Caribbean and Tropical Atlantic at 0000 UTC 23 December Orange-shaded areas are winds > 50 m/s (100kts). The route of Flight AA 331 is the magenta arrow.
File Name:
250_wind_hgt_flt_path_feedback.jpg
Credits:
NOAA/NCEP
Copyright Terms:
COMET Standard Terms of Use
Description:
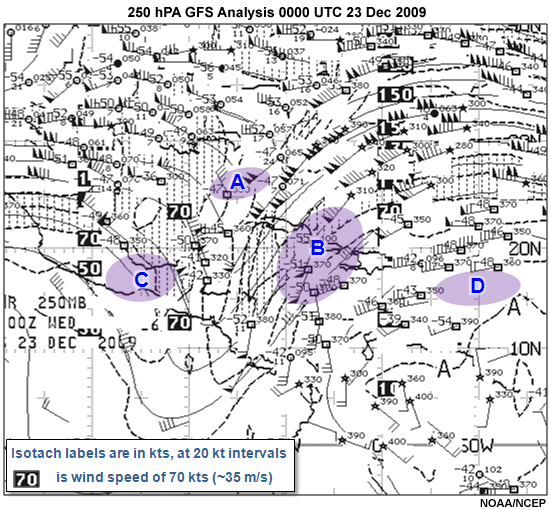
250 GFS Analysis for the Caribbean and Tropical Atlantic for 0000 UTC 23 December 2009
File Name:
250MB_turbulence_question.jpg
Credits:
NOAA/NCEP
Copyright Terms:
COMET Standard Terms of Use
Description:
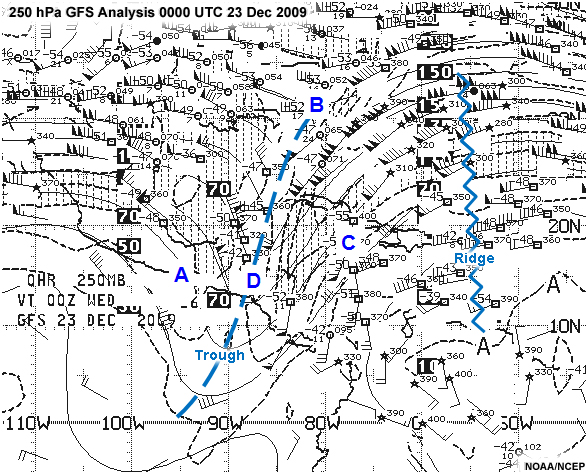
250 GFS Analysis for the Caribbean and Tropical Atlantic for 0000 UTC 23 December 2009
File Name:
250MB.gfs.fax.anl.00.20091223_question.jpg
Credits:
NOAA/NCEP
Copyright Terms:
COMET Standard Terms of Use
Description:
500 GFS Analysis for the Caribbean and Tropical Atlantic for 0000 UTC 23 December 2009. Showing examples of areas where turbulence is likely.
File Name:
500_turbulence_feedback.jpg
Credits:
NOAA/NCEP
Copyright Terms:
COMET Standard Terms of Use
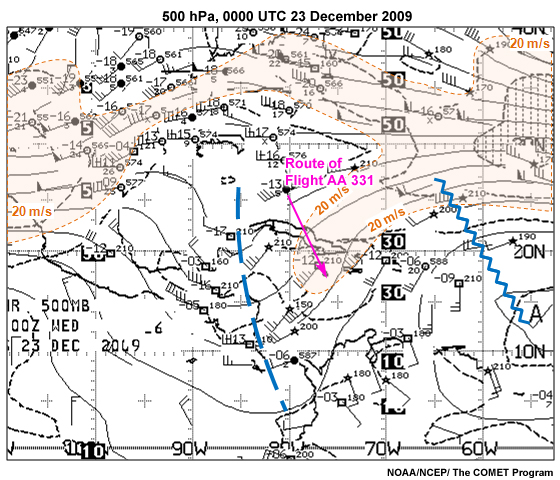
Description:
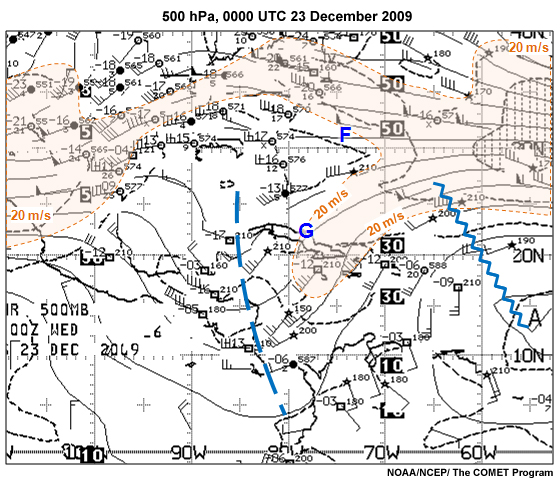
500 GFS heights and wind velocity for the Caribbean and Tropical Atlantic at 0000 UTC 23 December Orange-shaded areas are winds > 20 m/s (40 kts). The route of Flight AA 331 is the magenta arrow.
File Name:
500_wind_hgt_flt_path_feedback.jpg
Credits:
NOAA/NCEP
Copyright Terms:
COMET Standard Terms of Use
Description:
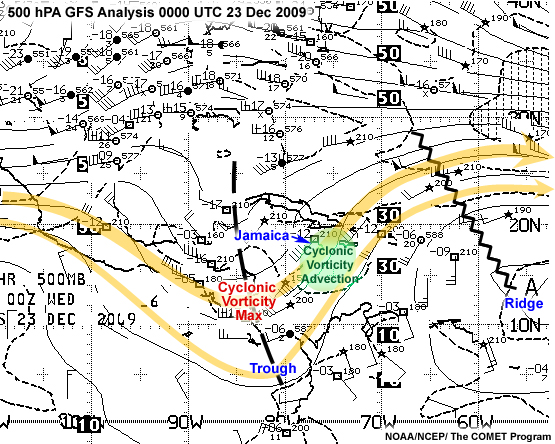
500 hPa heights and winds at 0000 UTC 23 December 2009. Green shaded area marks the area of maximum cyclonic vorticity advection.
File Name:
500hPa_dec2009.jpg
Credits:
NOAA/NCEP
Copyright Terms:
COMET Standard Terms of Use
Description:
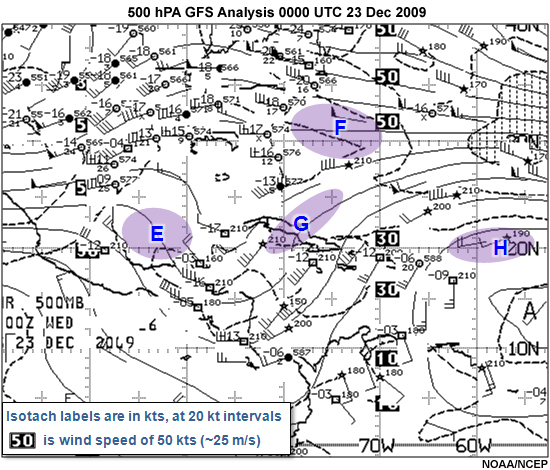
500 GFS Analysis for the Caribbean and Tropical Atlantic for 0000 UTC 23 December 2009
File Name:
500MB_turbulence_question.jpg
Credits:
NOAA/NCEP
Copyright Terms:
COMET Standard Terms of Use
Description:
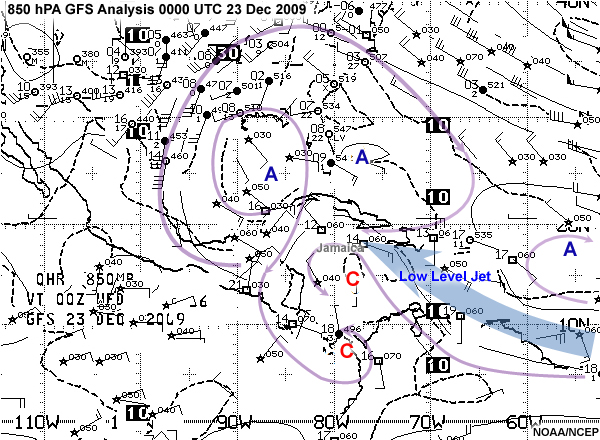
850 GFS Analysis for the Caribbean and Tropical Atlantic for 0000 UTC 23 December 2009
File Name:
850MB.gfs.fax.anl.00.20091223.jpg
Credits:
NOAA/NCEP
Copyright Terms:
COMET Standard Terms of Use
Description:
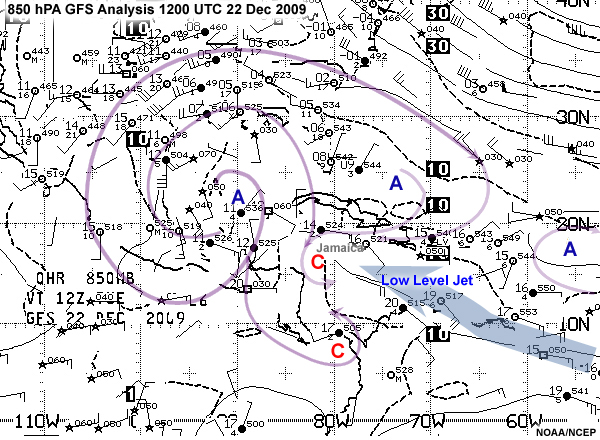
850 Analysis for the Caribbean and Tropical Atlantic for 1200 UTC 22 December 2009
File Name:
850MB.gfs.fax.anl.12.20091222.jpg
Credits:
NOAA/NCEP
Copyright Terms:
COMET Standard Terms of Use

Description:
Animation of enhanced satellite IR images of strong convection and clouds associated with a quasi-stationary front and deepening surface low over the Western Caribbean, 22-23 December 2009
File Name:
8km_ir4_22_23dec2009_0001.htm
Credits:
NOAA
Copyright Terms:
COMET Standard Terms of Use

Description:
Animation of enhanced satellite water vapor images of strong convection and clouds associated with a quasi-stationary front and deepening surface low over the Western Caribbean, 22-23 December 2009
File Name:
8km_wv_22_23dec2009_0001.htm
Credits:
NOAA
Copyright Terms:
COMET Standard Terms of Use

Description:
(Upper) Conceptual model of bow echo evolution and favored locations for downbursts, tornadoes, and bookend vortices. (Lower left) Conceptual diagram of bow echo features and an example cross section showing the rear-inflow notch or weak echo notch which signifies the location of a descending rear inflow jet that leads to damaging straight line surface winds. (Lower right) Example of a bow-echo cross section showing radar reflectivity and storm relative flow including the rear inflow jet (from Grim et al. 2009).
File Name:
bow_echo_carib.jpg
Credits:
NOAA/NWS
Copyright Terms:
COMET Standard Terms of Use
Description:
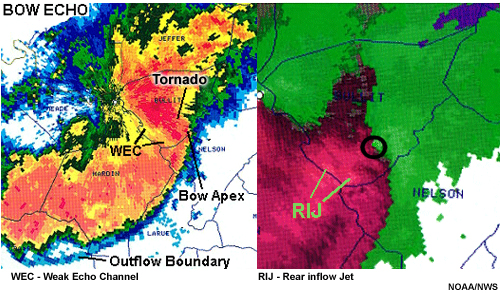
(left) Radar reflectivity image of bow echo that produced a tornado and damaging surface winds. Note the weak echo channel (WEC), also known as a rear inflow notch, associated with the strong rear inflow jet (RIJ, in the right panel). (right) Doppler velocity image. The black circle marks the velocity couplet that indicates rotation.
File Name:
bow_echo_NWS.jpg
Credits:
NOAA/NWS
Copyright Terms:
COMET Standard Terms of Use
Description:
Effects of line-end (bookend) vortices on the rear-inflow jet.
File Name:
bowbbowl.gif
Credits:
© The COMET Program
Copyright Terms:
COMET Standard Terms of Use
Description:
Horizontal Slice view of Bow Echo Evolution with Rear Inflow Notch and Jet
File Name:
bowcmev.gif
Credits:
© The COMET Program
Copyright Terms:
COMET Standard Terms of Use
Description:
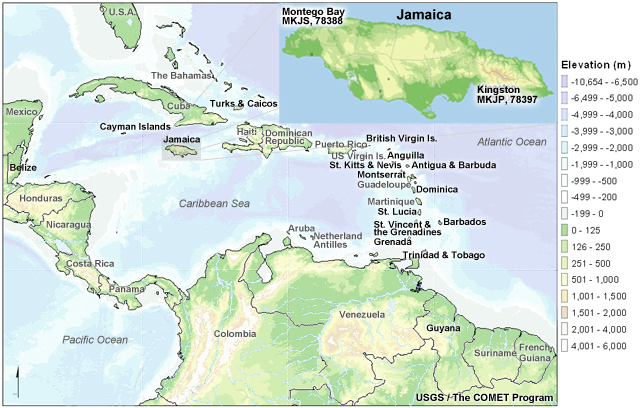
Map of the Caribbean showing elevation and bathymetry. Inset map shows Jamaica with parish boundaries and the observations stations at the international airports in Kingston (MKJP, 78397) and Montego Bay (MKJS, 78388). Caribbean Meteorological Organization (CMO) members are labeled in bold black.
File Name:
caribbean_jamaica_labels.jpg
Credits:
USGS / The COMET Program
Copyright Terms:
COMET Standard Terms of Use
Description:
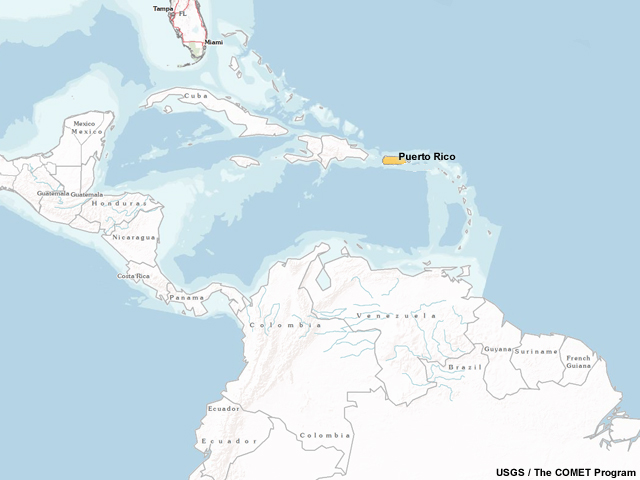
Map of Caribbean countries with Puerto Rico highlighted
File Name:
caribbean_map_pr.jpg
Credits:
© The COMET Program
Copyright Terms:
COMET Standard Terms of Use

Description:
Radar reflectivity showing Hurricane Georges moving across Puerto Rico from 13:02 UTC on 21 Sep to 15:31 UTC on 22 Sep 1998
File Name:
doppler_1.htm
Credits:
WSI
Copyright Terms:
COMET Standard Terms of Use
Description:
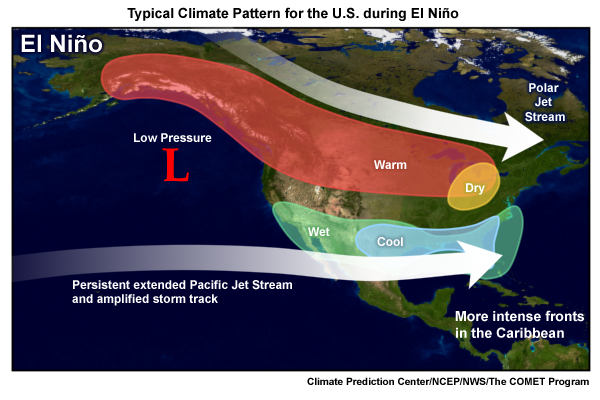
Typical climate patterns over the United States during El Niño situations. This includes warmer conditions in the Northern Tier and Great Lakes states all the way up to southern Alaska. Drier conditions prevail in the Southern Great lakes. The southern third of the US experiences wetter conditions and the Southeast US experiences cooler than average temperatures.
File Name:
El_nino_wx_patterns.jpg
Credits:
Climate Prediciton Center/NCEP/NWS/The COMET Program
Copyright Terms:
COMET Standard Terms of Use
Description:
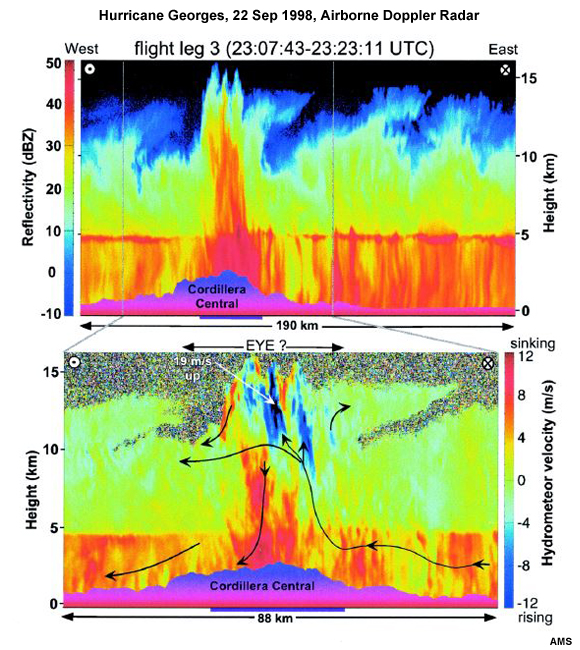
Radar reflectivity from research aircraft EDOP radar, 22 September 1998 showing a cross-section of Hurricane Georges over the island of Hispaniola
File Name:
flightleg3.jpg
Credits:
AMS
Copyright Terms:
COMET Standard Terms of Use
Description:
NCEP GFS Surface Analysis, 18 UTC 28 Sep 2010 showing tropical depression over the Western Caribbean
File Name:
gdas.fax.18.20100928.gif
Credits:
NOAA/NCEP
Copyright Terms:
COMET Standard Terms of Use
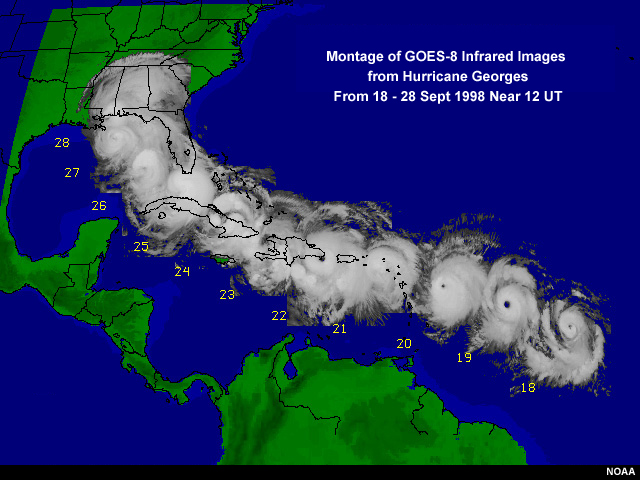
Description:
Track of Hurricane Georges from GOES-8 infrared imagery, 18-28 September 1998
File Name:
geo-mon.jpg
Credits:
NOAA
Copyright Terms:
COMET Standard Terms of Use
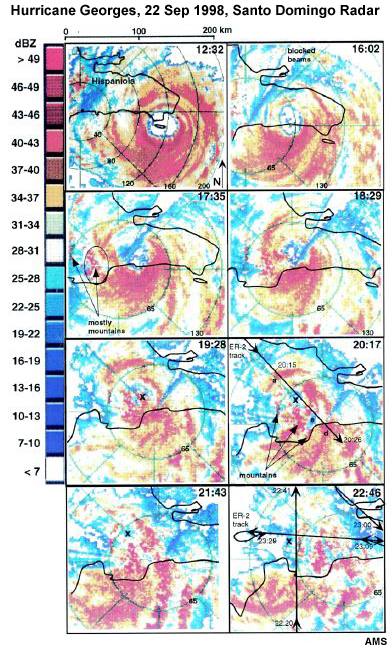
Description:
Radar reflectivity from Santo Domingo radar, 22 September 1998 showing Hurricane Georges move across the island of Hispaniola
File Name:
georges_doppler_radar_DomRep_bams.jpg
Credits:
AMS
Copyright Terms:
COMET Standard Terms of Use
Description:
Radar reflectivity loop from San Juan, Puerto Rico WSR-88D, 21-22 September 1998 showing Hurricane Georges move across the island
File Name:
georges1998precip.jpg
Credits:
NOAA
Copyright Terms:
COMET Standard Terms of Use
Description:
NCEP GFS Surface Analysis, 12 UTC 27 Sep 2010 showing low pressure over Western Caribbean
File Name:
gfs.fax.anl.12.20100927.gif
Credits:
NOAA/NCEP
Copyright Terms:
COMET Standard Terms of Use
Description:
NCEP GFS Surface Analysis, 12 UTC 28 Sep 2010 showing low pressure over Western Caribbean
File Name:
gfs.fax.anl.12.20100928.gif
Credits:
NOAA/NCEP
Copyright Terms:
COMET Standard Terms of Use
Description:
NCEP GFS 250 hPa height and wind analysis, 00 UTC 29 Sep 2010 showing upper-level ridge associated with Tropical Stom Nicole
File Name:
gfs.fax.anl.250_00.20100929.gif
Credits:
NOAA/NCEP
Copyright Terms:
COMET Standard Terms of Use
Description:
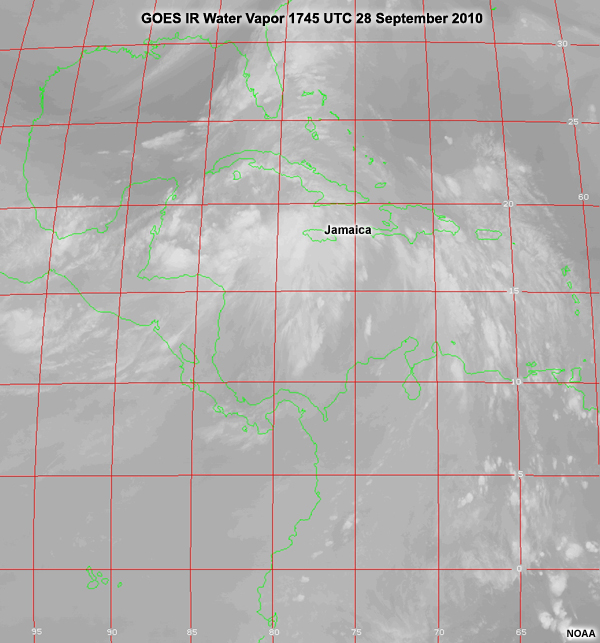
GOES IR Water Vapor image of developing tropical depression 16, 1745 UTC 28 September 2010.
File Name:
goes13.2010.271.174518.BAND_03.jpg
Credits:
NOAA
Copyright Terms:
COMET Standard Terms of Use
Description:
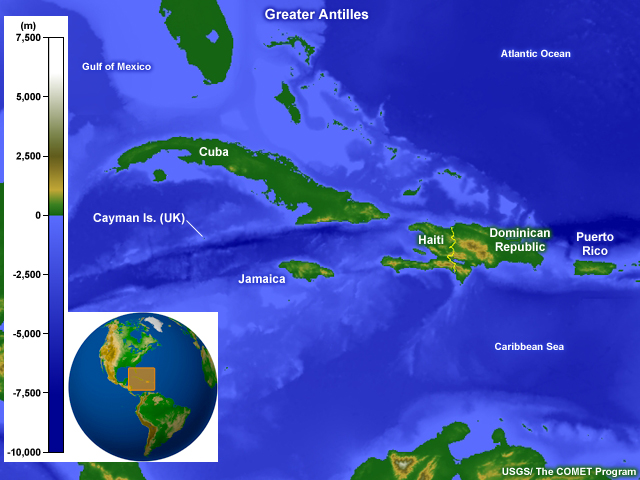
Map of the Greater Antilles
File Name:
greater_antilles.jpg
Credits:
USGS / The COMET Program
Copyright Terms:
COMET Standard Terms of Use
Description:
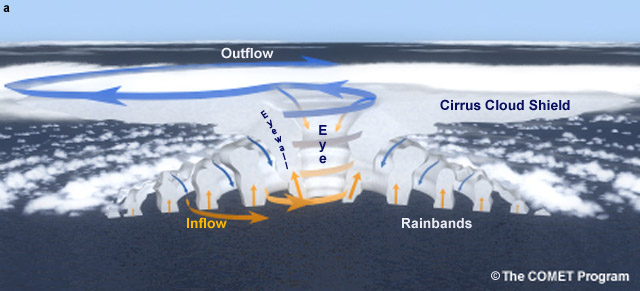
Conceptual model of a hurricane
File Name:
hur1a.jpg
Credits:
© The COMET Program
Copyright Terms:
COMET Standard Terms of Use
Description:
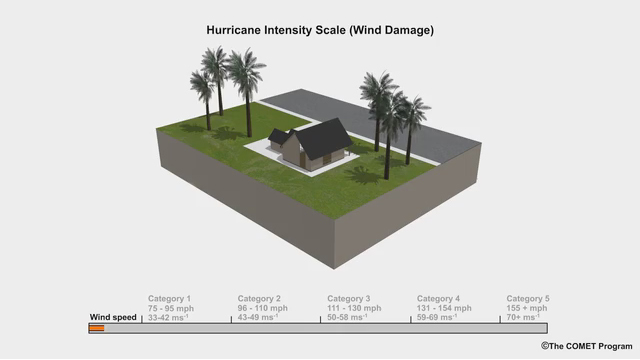
Saffir-Simpson Scale Animation: Damage to house in increasing hurricane winds.
File Name:
hurricane_wind_damage.mp4
Credits:
© The COMET Program
Copyright Terms:
COMET Standard Terms of Use
Description:
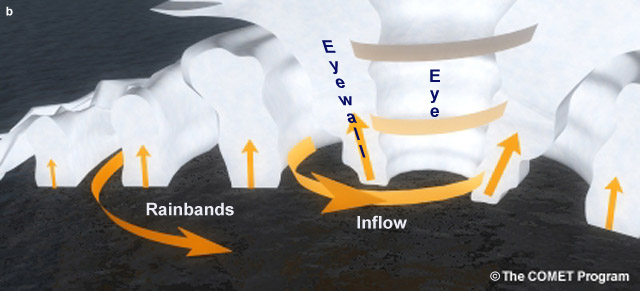
Close-up conceptual model of a hurricane
File Name:
inflow5_new.jpg
Credits:
© The COMET Program
Copyright Terms:
COMET Standard Terms of Use

Description:
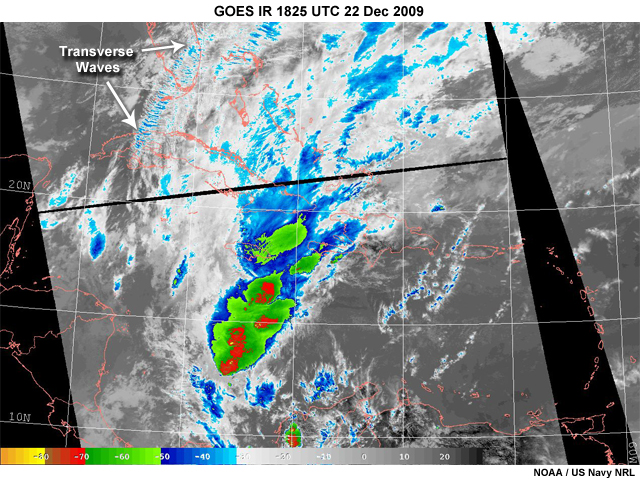
Enhanced satellite IR images of strong convection and clouds associated with a quasi-stationary front and deepening surface low over the Western Caribbean, 22 December 2009
File Name:
IR_200912221825.jpg
Credits:
NOAA / US Navy NRL
Copyright Terms:
COMET Standard Terms of Use
Description:
Enhanced satellite IR images of strong convection and clouds associated with a quasi-stationary front and deepening surface low over the Western Caribbean, 22 December 2009
File Name:
IR_200912221825_turb.jpg
Credits:
NOAA / US Navy NRL
Copyright Terms:
COMET Standard Terms of Use

Description:
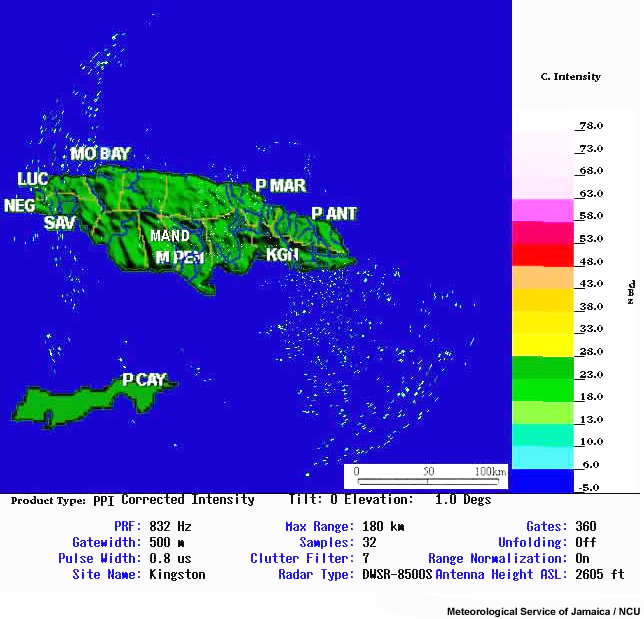
Long-range radar reflectivity on 22 - 23 December 2009 from Jamaican Meteorological Service Radar in Kingston, Jamaica
File Name:
jam_radar_aa_crash_2009_0001.htm
Credits:
Meteorological Service of Jamaica / NCU
Copyright Terms:
COMET Standard Terms of Use
Description:
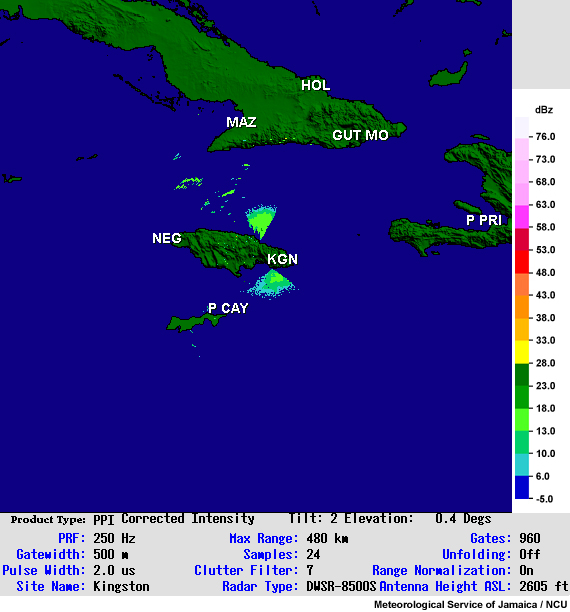
Long range (480km) Doppler radar map for Jamaica (courtesy of the National Meteorological Service of Jamaica).
File Name:
jam_radar_map_480km.jpg
Credits:
Meteorological Service of Jamaica / NCU
Copyright Terms:
COMET Standard Terms of Use

Description:
Animation of satellite IR images of developing tropical depression 16 during 28 -29 September 2010.
File Name:
jam_sat_ir_anim_0001.htm
Credits:
NOAA
Copyright Terms:
COMET Standard Terms of Use
Description:
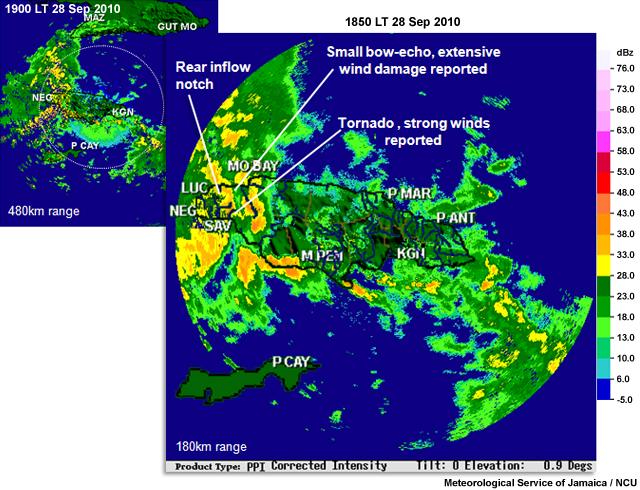
Radar reflectivity images from 1850LT 28 Sep of bow-echo over Western Jamaica that produced a tornado/waterspout, other severe weather, and flash floods.
File Name:
jamaica_bowecho.jpg
Credits:
Meteorological Service of Jamaica / NCU
Copyright Terms:
COMET Standard Terms of Use
Description:
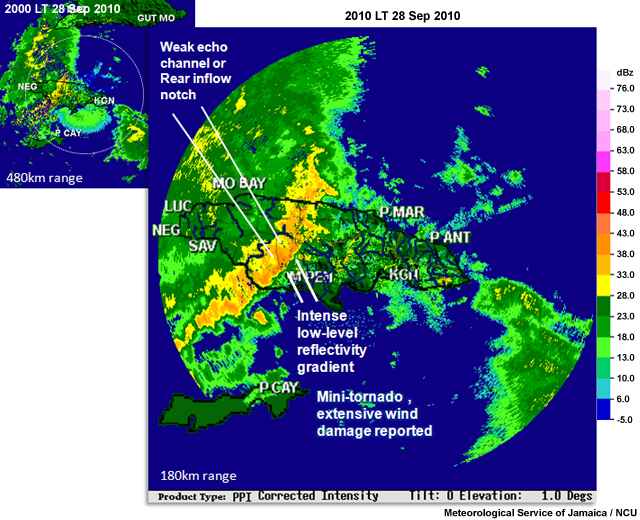
Radar reflectivity images 2010 28 Sep of squall line oriented NE-SW across central Jamaica that produced severe damaging winds and flash floods
File Name:
jamaica_mcs_sql_line.jpg
Credits:
Meteorological Service of Jamaica / NCU
Copyright Terms:
COMET Standard Terms of Use

Description:
Radar reflectivity images from 1850LT 28 Sep to 0210LT 29 Sep 2010 of thunderstorms that produced tornado, severe weather, and floods across Jamaica
File Name:
jamaica_radar_flood_sep2010_0001.htm
Credits:
Meteorological Service of Jamaica / NCU
Copyright Terms:
COMET Standard Terms of Use

Description:
Radar reflectivity images from 1850LT 28 Sep to 0210LT 29 Sep 2010 of thunderstorms that produced tornado, severe weather, and floods across Jamaica
File Name:
jamaica_radar_flood_sep2010_feedback_0001.htm
Credits:
Meteorological Service of Jamaica / NCU
Copyright Terms:
COMET Standard Terms of Use
Description:
Radar map for the 180 km range around Jamaican Doppler radar (figure from the Jamaican National Meteorological Service)
File Name:
jamaica_radar_map.jpg
Credits:
Meteorological Service of Jamaica / NCU
Copyright Terms:
COMET Standard Terms of Use
Description:
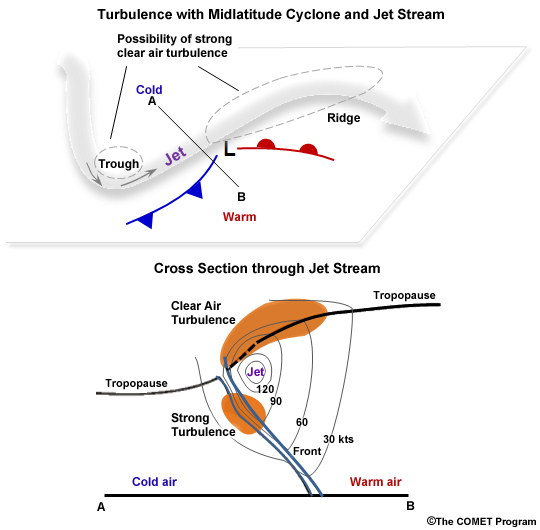
Upper panel shows turbulence relative to the location of the upper-level wave and surface fronts. Lower panel shows cross-section through the jet stream and front with areas of turbulence above the jet over the sloping tropopause and below the jet and around the front.
File Name:
jet_cyclone_turbulence.jpg
Credits:
© The COMET Program
Copyright Terms:
COMET Standard Terms of Use
Description:
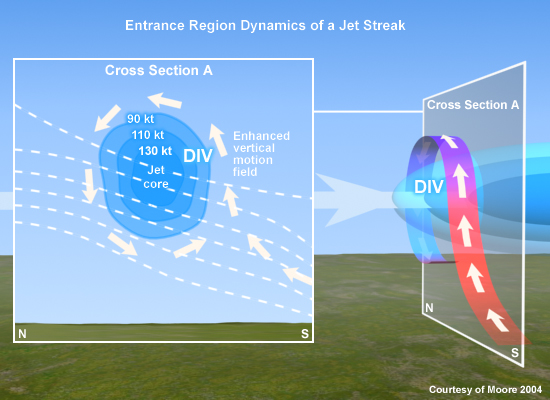
Conceptual diagram showing cross section and plan view of entrance region dynamics of a jet streak.
File Name:
jet_upperlevelentrance.jpg
Credits:
Courtesy of Moore 2004
Copyright Terms:
COMET Standard Terms of Use

Description:
Map of the Jamaica showing elevation, parish boundaries, and towns affected by severe weather. Also marked are the WMO/ICAO stations at the international airports in Kingston (MKJP, 78397) and Montego Bay (MKJS, 78388).
File Name:
map_jamaica_with_elev.jpg
Credits:
USGS / The COMET Program
Copyright Terms:
COMET Standard Terms of Use
Description:
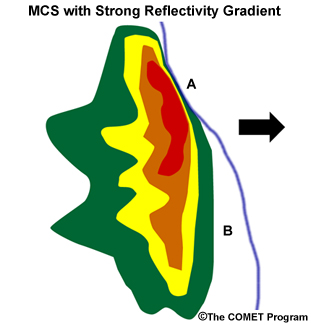
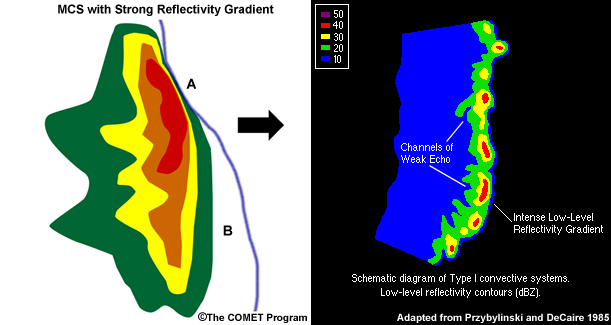
Left: Conceptual model of an MCS moving left to right. Shown qualitatively as a low-level horizontal slice through the radar reflectivity of the system. The blue line ahead of the low-level reflectivity core marks the system gust front. Point A shows a gust front that stays close to the leading deep updrafts of the system and a tight low-level reflectivity gradient. Both indicators suggest an enhanced likelihood for damaging winds near point A. Point B shows a gust front that has outrun the core, and a very broad reflectivity gradient. The damaging wind risk here is significantly lower that at point A.
File Name:
MCS_refl_gradient.jpg
Credits:
©The COMET Program
Copyright Terms:
COMET Standard Terms of Use
Description:
Left: Conceptual model of an MCS moving left to right. Shown qualitatively as a low-level horizontal slice through the radar reflectivity of the system. The blue line ahead of the low-level reflectivity core marks the system gust front. Point A shows a gust front that stays close to the leading deep updrafts of the system and a tight low-level reflectivity gradient. Both indicators suggest an enhanced likelihood for damaging winds near point A. Point B shows a gust front that has outrun the core, and a very broad reflectivity gradient. The damaging wind risk here is significantly lower that at point A.
Right: 'Type 1' case is characterized of having two or even three bowing segments. Each of the individual segments may be as long as 100 km in length and may be associated with a mesocirculation near the northern end of the segment.
File Name:
MCS_refl_gradient_ront1.jpg
Credits:
©The COMET Program / Przybylinski and DeCaire (1985)
Copyright Terms:
COMET Standard Terms of Use
Description:
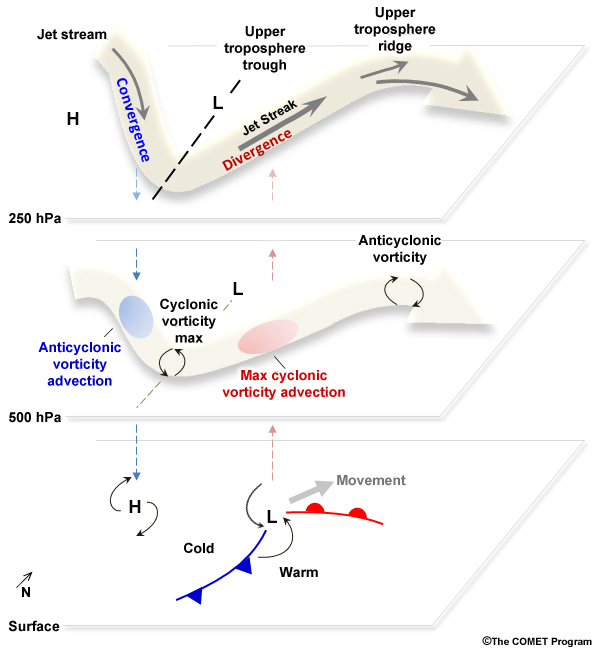
Conceptual model of midlatitude cyclone at surface, 500 hPa, and 250 hPa showing jet stream and streamlines, regions of upper-level divergence/convergence, maxima of mid-level vorticity and vorticity advection, surface low/high pressure, and surface fronts.
File Name:
midlatitude_cyclone_concept.jpg
Credits:
© The COMET Program
Copyright Terms:
COMET Standard Terms of Use
Description:
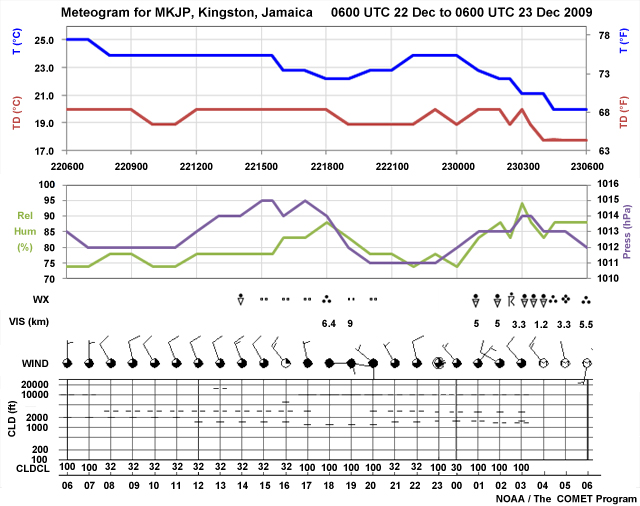
Meteogram for MKJP, Kingston, Jamaica from 0600 UTC 22 Dec to 0600 UTC 23 Dec 2009
File Name:
mkjp_meteogram_22_23dec2009.jpg
Credits:
NOAA / The COMET Program
Copyright Terms:
COMET Standard Terms of Use
Description:
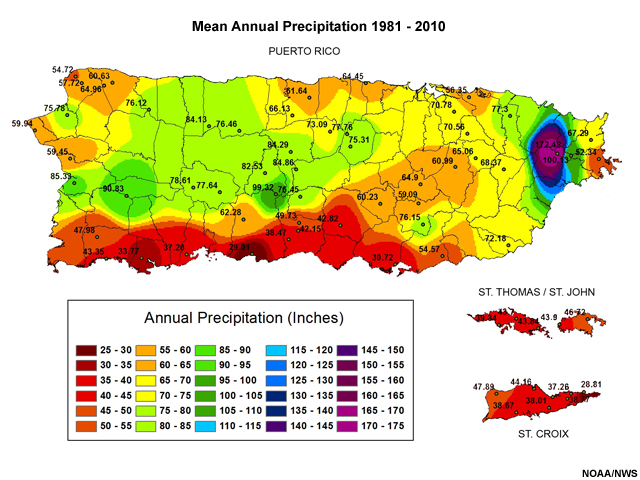
Mean annual precipitation in inches for Puerto Rico and the surrounding area for the period 1981 through 2010.
File Name:
ncdc_precip_normalsxm_PR_USVI-1.jpg
Credits:
NOAA/NWS
Copyright Terms:
COMET Standard Terms of Use

Description:
Animation showing Tropical Cyclones by 10-day periods from 1851-2009
File Name:
nhc_1.htm
Credits:
NOAA / NHC
Copyright Terms:
COMET Standard Terms of Use
Description:
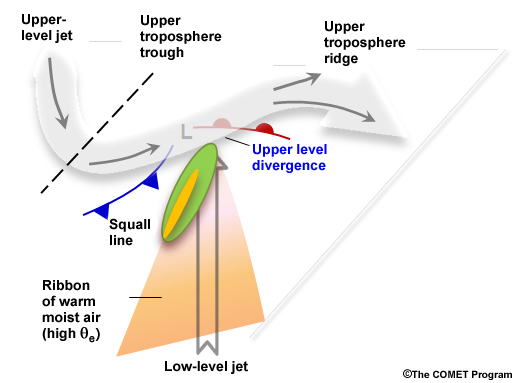
Schematic of key features that are associated with midlatitude, prefrontal squall lines. Green and yellow shades represent the radar reflectivity signature of a leading convective line/trailing stratiform MCS
File Name:
prefrontal_squall_env.jpg
Credits:
© The COMET Program
Copyright Terms:
COMET Standard Terms of Use
Description:
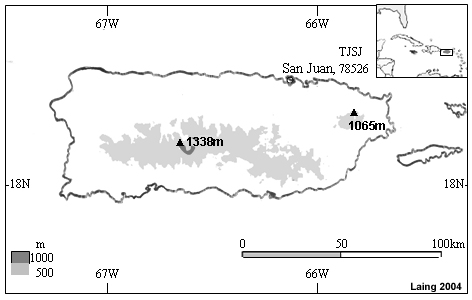
Map of Puerto Rico with terrain values great than 500m and greater than 1000m shaded.
File Name:
puertorico_elev.jpg
Credits:
Laing 2004
Copyright Terms:
COMET Standard Terms of Use
Description:
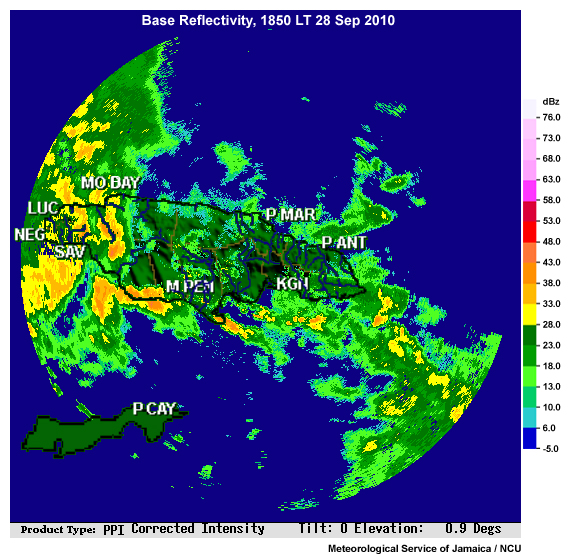
Radar reflectivity images from 1850LT 28 Sep 2010, Jamaican National Meteorological Service
File Name:
radar_180km_20100928_1850LT.jpg
Credits:
Meteorological Service of Jamaica / NCU
Copyright Terms:
COMET Standard Terms of Use
Description:
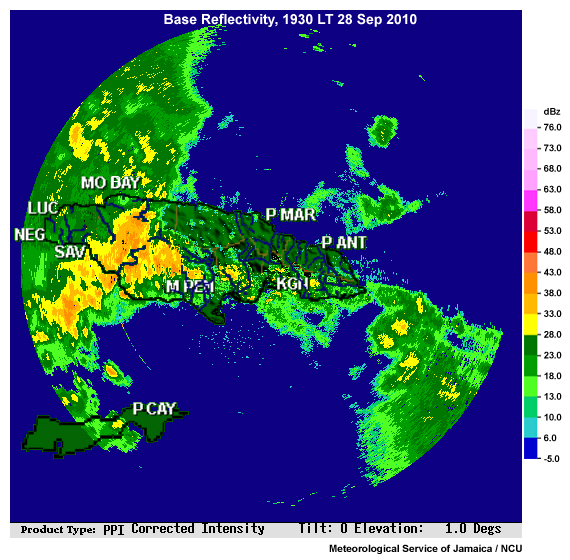
Radar reflectivity images from 1930LT 28 Sep 2010, Jamaican National Meteorological Service
File Name:
radar_180km_20100928_1930LT.jpg
Credits:
Meteorological Service of Jamaica / NCU
Copyright Terms:
COMET Standard Terms of Use
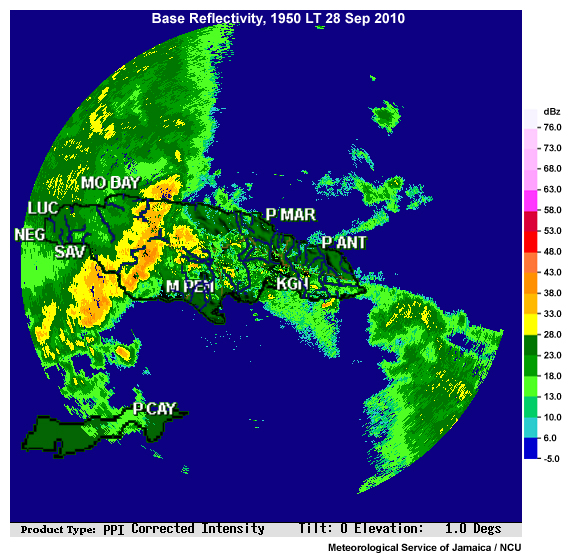
Description:
Radar reflectivity images from 1950LT 28 Sep 2010, Jamaican National Meteorological Service
File Name:
radar_180km_20100928_1950LT.jpg
Credits:
Meteorological Service of Jamaica / NCU
Copyright Terms:
COMET Standard Terms of Use
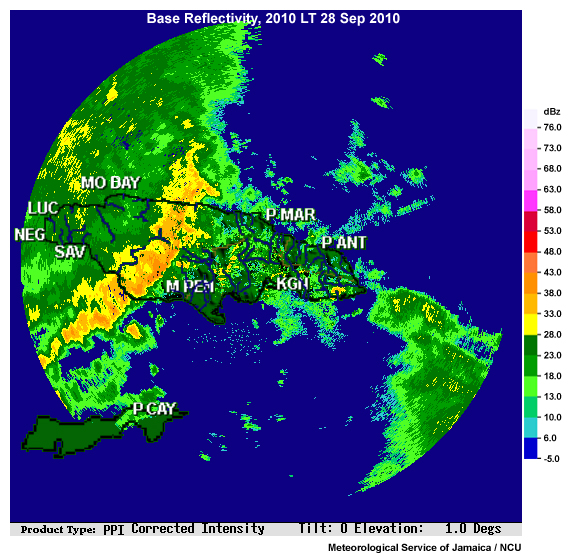
Description:
Radar reflectivity image from 2010LT 28 Sep 2010, Jamaican National Meteorological Service
File Name:
radar_180km_20100928_2010LT.jpg
Credits:
Meteorological Service of Jamaica / NCU
Copyright Terms:
COMET Standard Terms of Use
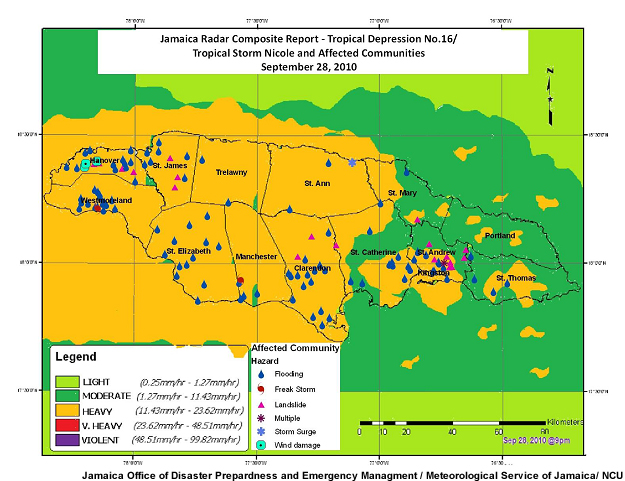
Description:
Radar composite and storm damage map of Jamaica on September 28 2010. Map is courtesy of the National Meteorological Service of Jamaica and the Office of Disaster Preparedness and Emergency Management (ODPEM) of Jamaica.
File Name:
radar_composite_metservice_damage_opdem.jpg
Credits:
Jamaica Office of Disaster Prepardness and Emergency Managment / Meteorological Service of Jamaica/ NCU
Copyright Terms:
COMET Standard Terms of Use

Description:
Radar reflectivity from 07:58 UTC on 6 May 2001 to 01:59 UTC on 7 May 2001 from San Juan NWS Doppler Radar.
File Name:
radar_loop_wpr_may62001_0001.htm
Credits:
NOAA/NWS
Copyright Terms:
COMET Standard Terms of Use

Description:
Radar reflectivity of convection over Puerto Rico and vicinity, 6 May 2001
File Name:
radar_puertorico_flood_6may2001.jpg
Credits:
NOAA/NWS San Juan
Copyright Terms:
COMET Standard Terms of Use
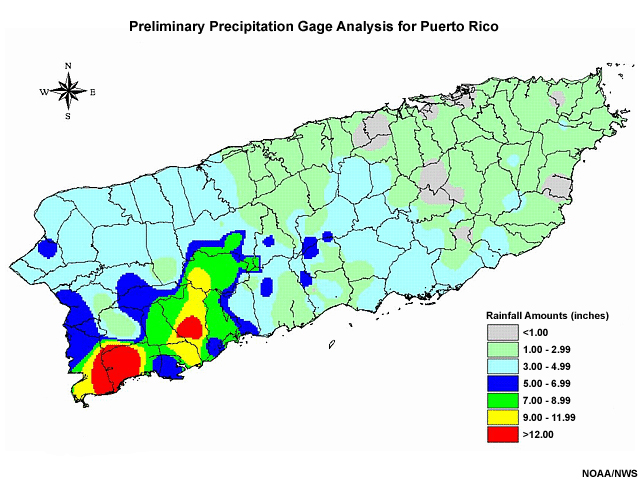
Description:
Preliminary precipitation data in inches for Puerto Rico for the 24-hr period ending 7am 5/07/2001.
File Name:
rfc_24hr_end07.jpg
Credits:
NOAA/NWS
Copyright Terms:
COMET Standard Terms of Use
Description:
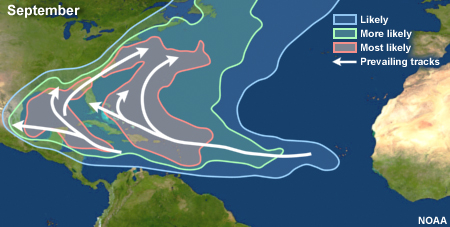
Prevailing hurricane tracks during September
File Name:
sep.jpg
Credits:
NOAA
Copyright Terms:
COMET Standard Terms of Use
Description:
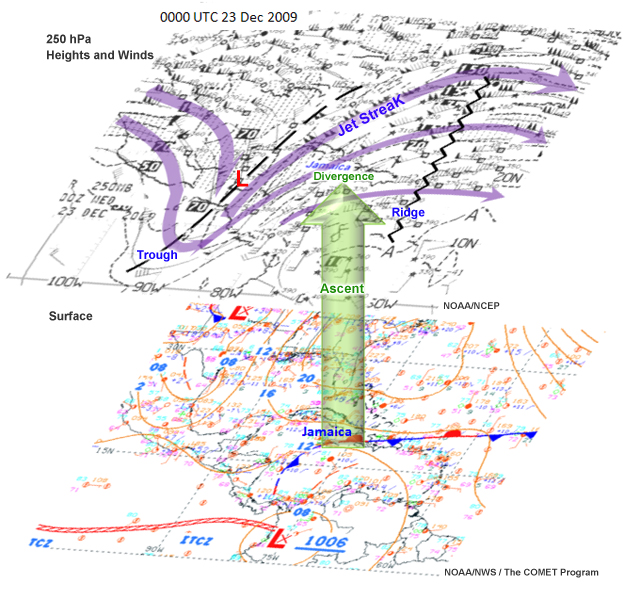
Two layers showing, respectively, the 250 hPa heights and winds and the corresponding surface analysis. The green arrow represents rising motion that is induced by the upper-level divergence.
File Name:
sfc_250_maps_dec2009.jpg
Credits:
NOAA/NWS/ The COMET Program (lower panel) and NOAA/NCEP (for upper panel)
Copyright Terms:
COMET Standard Terms of Use

Description:
Animation of Unified Surface Analysis for the Caribbean and Tropical Atlantic for 19 - 22 December 2009 (from US National Weather Service)
File Name:
sfc_analysis_19_22dec2009_0001.htm
Credits:
NOAA/NWS
Copyright Terms:
COMET Standard Terms of Use

Description:
Animation of Unified Surface Analysis for the Caribbean and Tropical Atlantic for 19 - 23 December 2009 (from US National Weather Service)
File Name:
sfc_analysis_19_23dec2009_0001.htm
Credits:
NOAA/NWS
Copyright Terms:
COMET Standard Terms of Use

Description:
(Upper) Surface map for the Caribbean and vicinity at 0000 UTC 23 Dec 2009. Overlaid are 250 hPa streamlines, jet streak, trough, and ridge. (Lower left) Color-enhanced GOES IR water vapor and (lower right) color enhanced GOES Thermal IR image at 0000 UTC 23 December 2009.
File Name:
sfc_upr_cyclones_23dec2009.jpg
Credits:
NOAA/NWS/ The COMET Program (for upper panel) and NOAA (for lower panel)
Copyright Terms:
COMET Standard Terms of Use
Description:
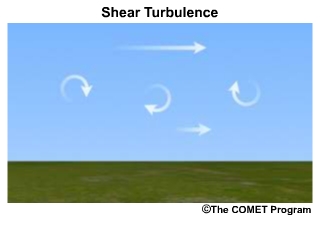
Animated schematic of turbulence due to shear
File Name:
shear_turbulence.mp4
Credits:
© The COMET Program
Copyright Terms:
COMET Standard Terms of Use
Description:
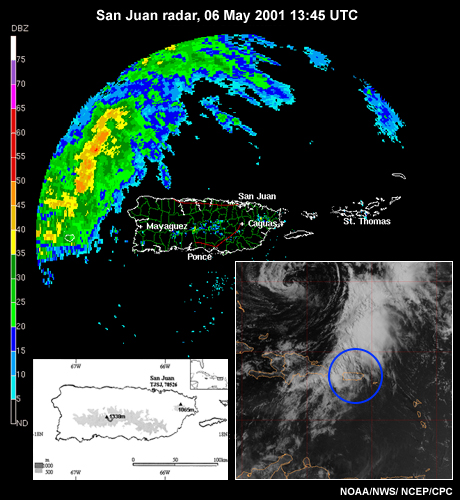
Radar reflectivity at 1348 UTC on 6 May 2001 from San Juan NWS Doppler Radar. With visible satellite imagery from 1345 UTC and topographic map of Puerto Rico inset
File Name:
sj_radar_vis_elevation_1345.jpg
Credits:
NOAA/NWS/NCEP/CPC
Copyright Terms:
COMET Standard Terms of Use
Description:
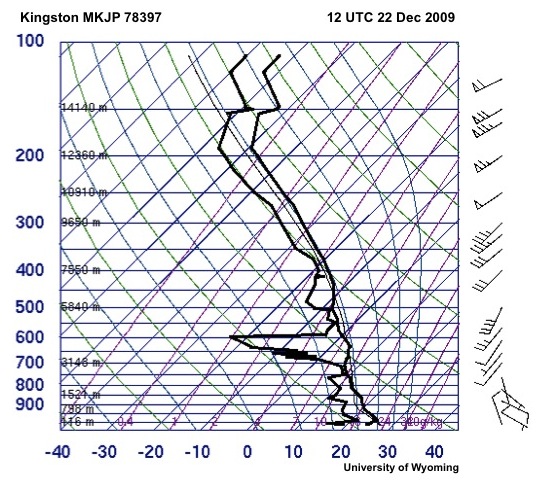
Skew-T log P sounding, Kingston, MKJP, 78397, 12 UTC 22 Dec 2009
File Name:
skewt_mkjp_200912221200.jpg
Credits:
University of Wyoming
Copyright Terms:
COMET Standard Terms of Use
Description:
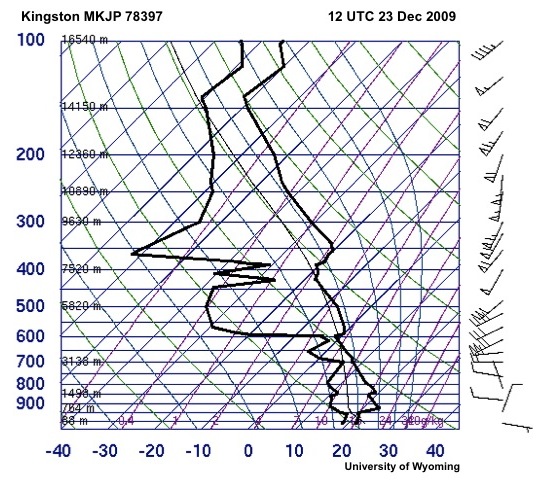
Skew-T log P sounding, Kingston, MKJP, 78397, 12 UTC 23 Dec 2009
File Name:
skewt_mkjp_200912231200.jpg
Credits:
University of Wyoming
Copyright Terms:
COMET Standard Terms of Use
Description:
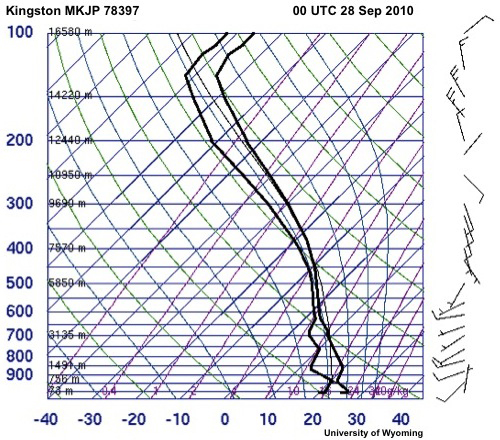
Skew-T log P sounding, Kingston, MKJP, 78397, 00 UTC 28 Sep 2010
File Name:
skewt_mkjp_2010092800.jpg
Credits:
University of Wyoming
Copyright Terms:
COMET Standard Terms of Use
Description:
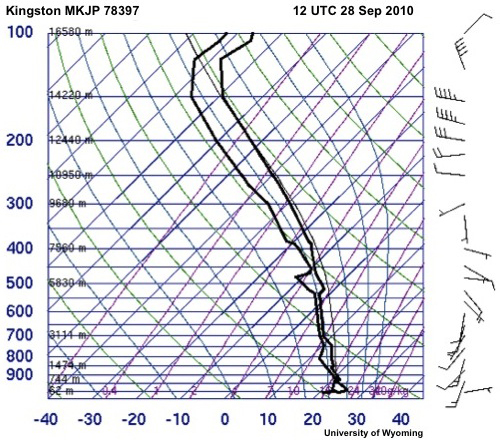
Skew-T log P sounding, Kingston, MKJP, 78397, 12 UTC 28 Sep 2010
File Name:
skewt_mkjp_2010092812.jpg
Credits:
University of Wyoming
Copyright Terms:
COMET Standard Terms of Use
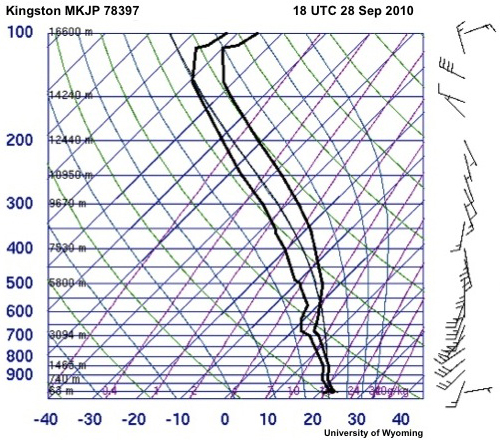
Description:
Skew-T log P sounding, Kingston, MKJP, 78397, 18 UTC 28 Sep 2010
File Name:
skewt_mkjp_2010092818.jpg
Credits:
University of Wyoming
Copyright Terms:
COMET Standard Terms of Use
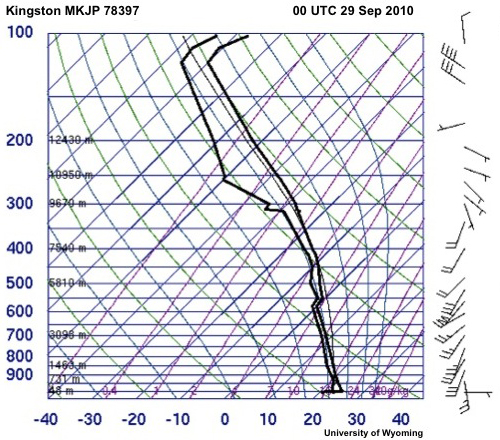
Description:
Skew-T log P sounding, Kingston, MKJP, 78397, 00 UTC 29 Sep 2010
File Name:
skewt_mkjp_2010092900.jpg
Credits:
University of Wyoming
Copyright Terms:
COMET Standard Terms of Use
Description:
Plan view of squall showing back building.
File Name:
sqlbkbld.gif
Credits:
© The COMET Program
Copyright Terms:
COMET Standard Terms of Use
Description:
Conceptual model of the development of a squall line.
File Name:
sqlcmev.gif
Credits:
© The COMET Program
Copyright Terms:
COMET Standard Terms of Use
Description:
Cell Motion vs Squall Line Motion
File Name:
sqlmotin.gif
Credits:
© The COMET Program
Copyright Terms:
COMET Standard Terms of Use
Description:
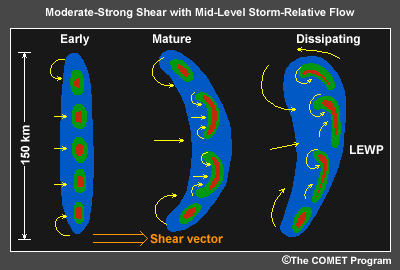
Conceptual evolution of squall line into line echo wave pattern with small bow echoes; three states under moderate to strong shear.
File Name:
sqlsysms_mod.jpg
Credits:
© The COMET Program
Copyright Terms:
COMET Standard Terms of Use
Description:
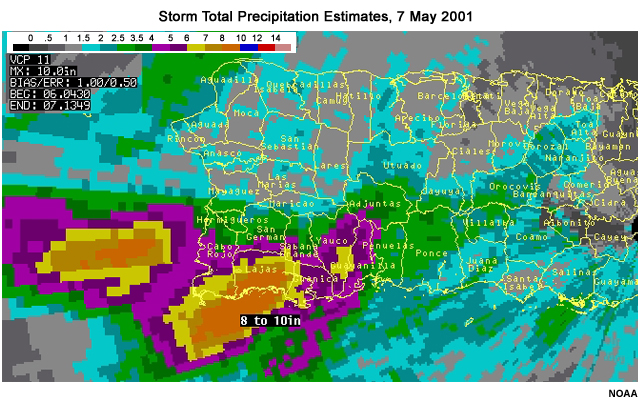
Storm total precipitation estimates from the FAA Doppler radar over Western Puerto Rico on 7 May 2001.
File Name:
stp_westpr_06to07.jpg
Credits:
NOAA
Copyright Terms:
COMET Standard Terms of Use
Description:
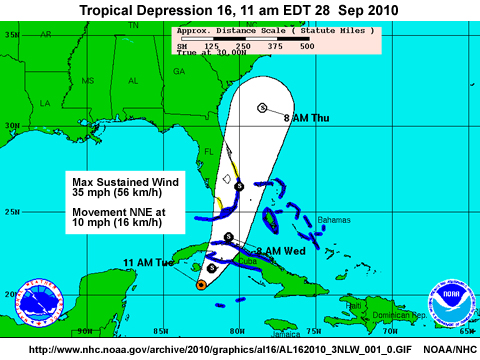
Location and forecast track of Tropical Depression 16 at 11 am EDT 28 September 2010
File Name:
td16_fcst_20100928_11edt.jpg
Credits:
NOAA
Copyright Terms:
COMET Standard Terms of Use
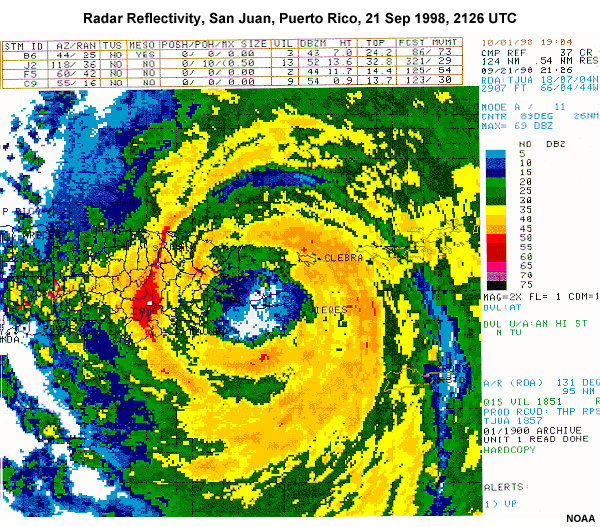
Description:
Radar reflectivity product from San Juan, Puerto Rico WSR-88D, 21 September 1998 at 2126 UTC
File Name:
tjua_21sep98_2126z.jpg
Credits:
NOAA
Copyright Terms:
COMET Standard Terms of Use
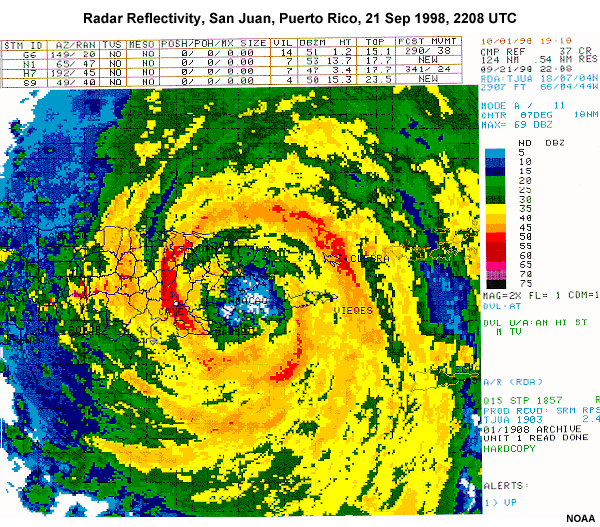
Description:
Radar reflectivity product from San Juan, Puerto Rico WSR-88D, 21 September 1998 at 2208 UTC
File Name:
tjua_21sep98_2208z.jpg
Credits:
NOAA
Copyright Terms:
COMET Standard Terms of Use
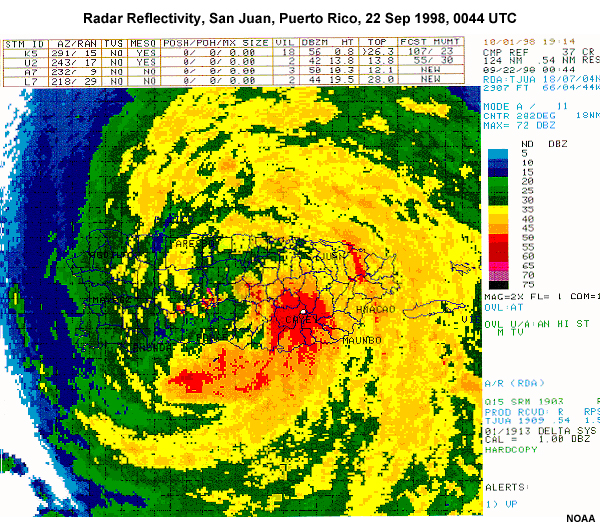
Description:
Radar reflectivity product from San Juan, Puerto Rico WSR-88D, 22 September 1998 at 0044 UTC
File Name:
tjua_22sep98_0044z.jpg
Credits:
NOAA
Copyright Terms:
COMET Standard Terms of Use

Description:
Photograph of the destroyed historic Savanna-la-mar Baptist church that was hit by reported tornado on 28 September 2010
File Name:
tornado_damage_sw_jamaica.jpg
Credits:
Arlene Laing
Copyright Terms:
COMET Standard Terms of Use
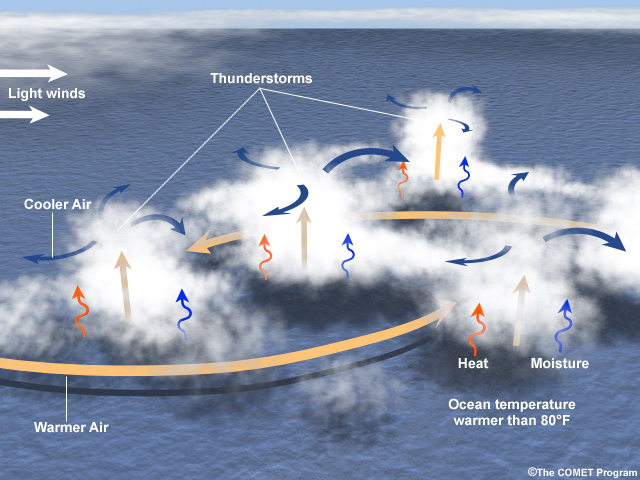
Description:
Ingredients for the development of a tropical cyclone
File Name:
trop_depression_concept.jpg
Credits:
© The COMET Program
Copyright Terms:
COMET Standard Terms of Use
Description:
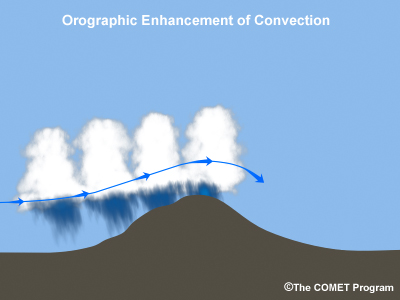
Conceptual image of the convection being enhanced by orographic lift.
File Name:
upslope_pot_inst.jpg
Credits:
© The COMET Program
Copyright Terms:
COMET Standard Terms of Use
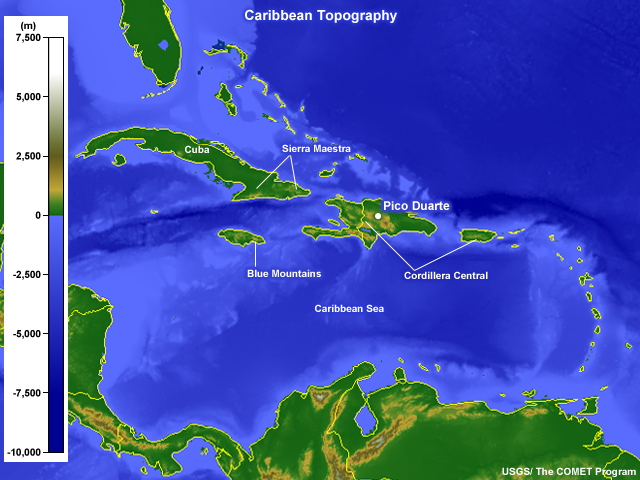
Description:
Map of the West IndianTopography
File Name:
westindies_topo.jpg
Credits:
USGS / The COMET Program
Copyright Terms:
COMET Standard Terms of Use