Introduction
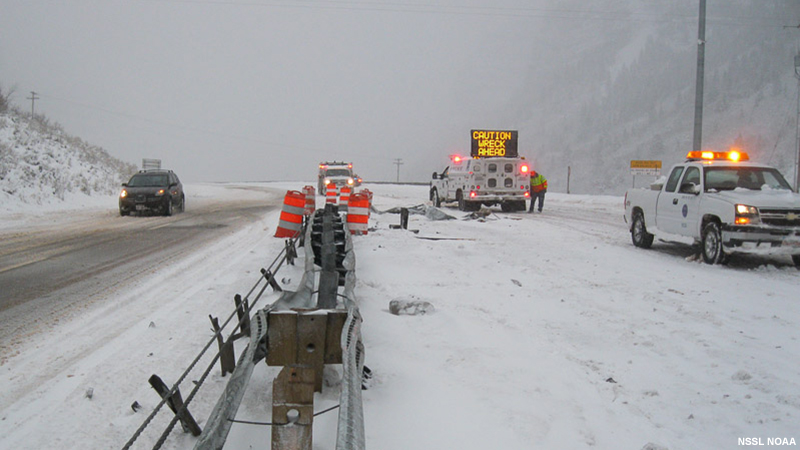
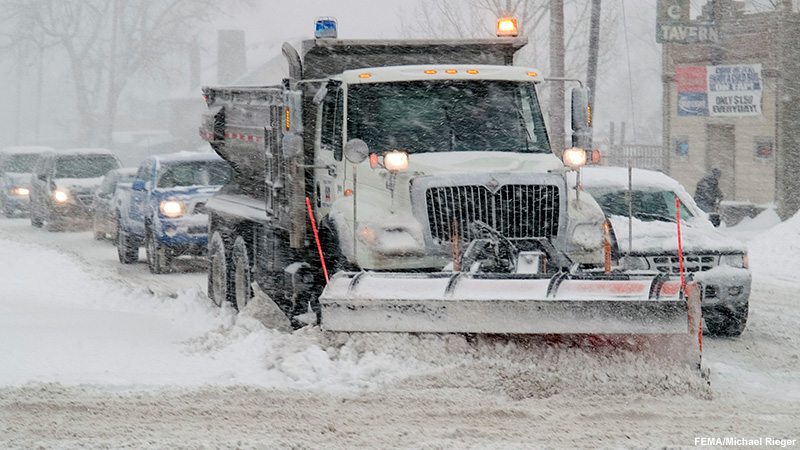
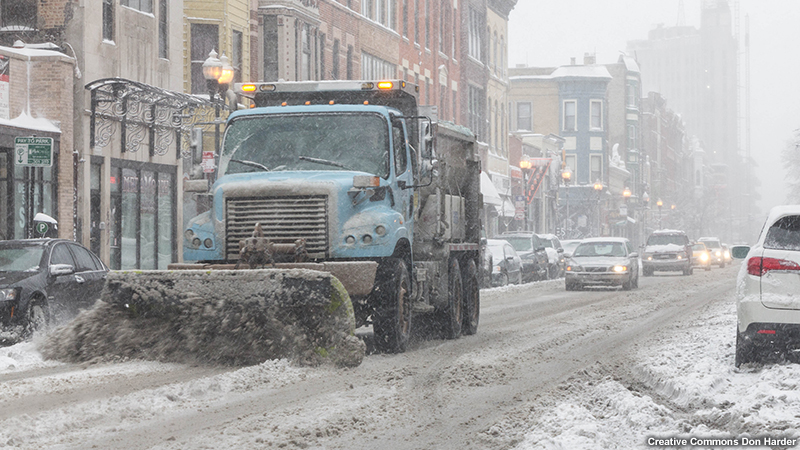
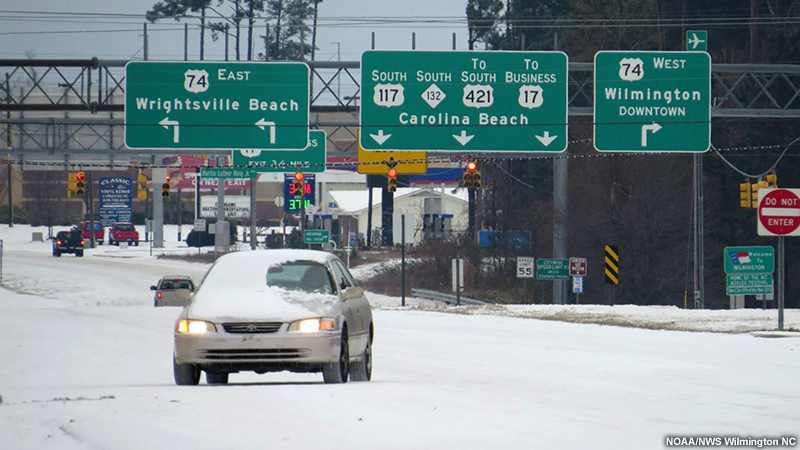
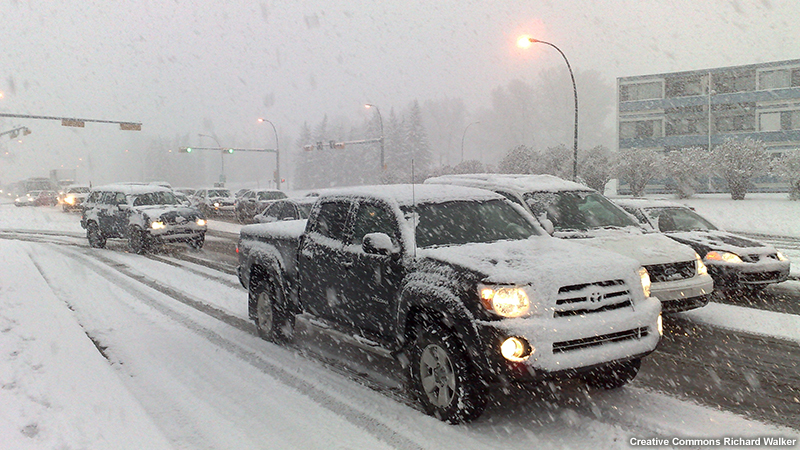
Winter weather causes significant road impacts. According to the Federal Highway Administration, about 22% of all accidents in the U.S. from 2005-2014 were weather-related. This translates to yearly averages of about 5,900 fatalities, over 445,000 injuries, and nearly 1 million property-damage-only accidents. State, local, and municipal Departments of Transportation (DOTs) implement various strategies to mitigate impacts on the roads. More accurate and timely weather and road weather forecasts, in addition to observations, can better inform DOTs and improve their decision-making capabilities.
In the next section, we will go through an exercise to learn how forecasters can better communicate winter weather threats to the DOT.
Simulation
This simulation will give you a chance to apply what you already know about communicating winter weather information to National Weather Service (NWS) partners. You will take the role of a NWS forecaster communicating winter weather information to a local DOT manager via a teleconference. Your partner’s reaction and decisions will change based on your selections.
Scenario
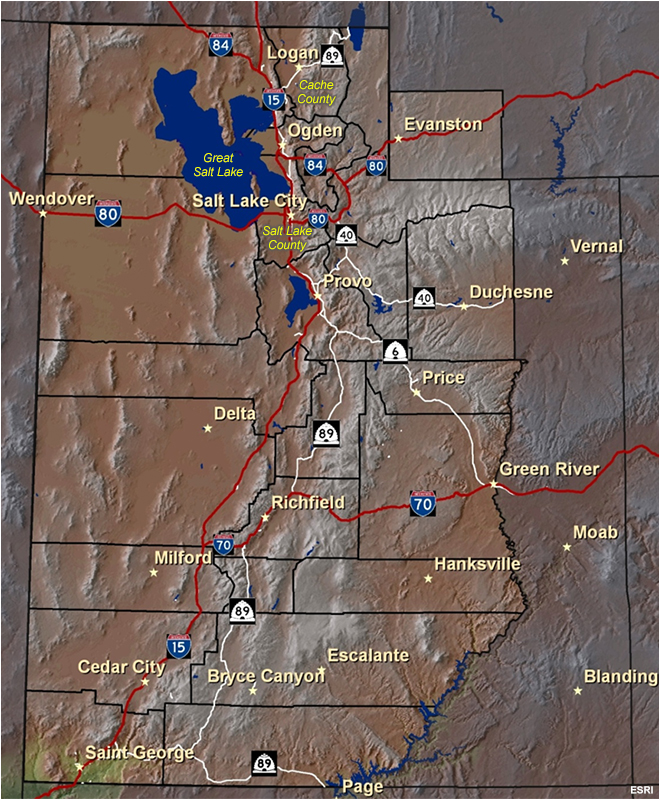
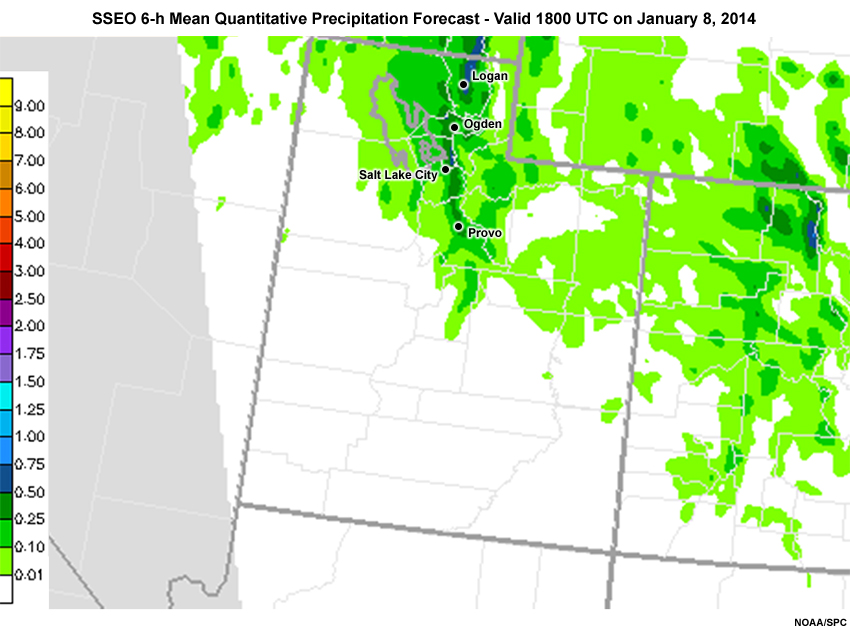
You are a forecaster at the Weather Forecast Office (WFO) Salt Lake City with responsibility for most of Utah. The Wasatch Front lies west of the Wasatch Mountain Range, stretching from south of Provo to north of Ogden and includes the Salt Lake City metro area (see map). It is Tuesday, January 7th.
A trough along the Oregon coast is forecast to track southeast through northern Utah on Wednesday and bring a chance for snow. Although the trough is not very strong, it does have adequate moisture and lift to generate widespread precipitation across northern Utah throughout Wednesday morning. The snow may begin before sunrise along the Utah/Idaho border before spreading south towards Salt Lake County.
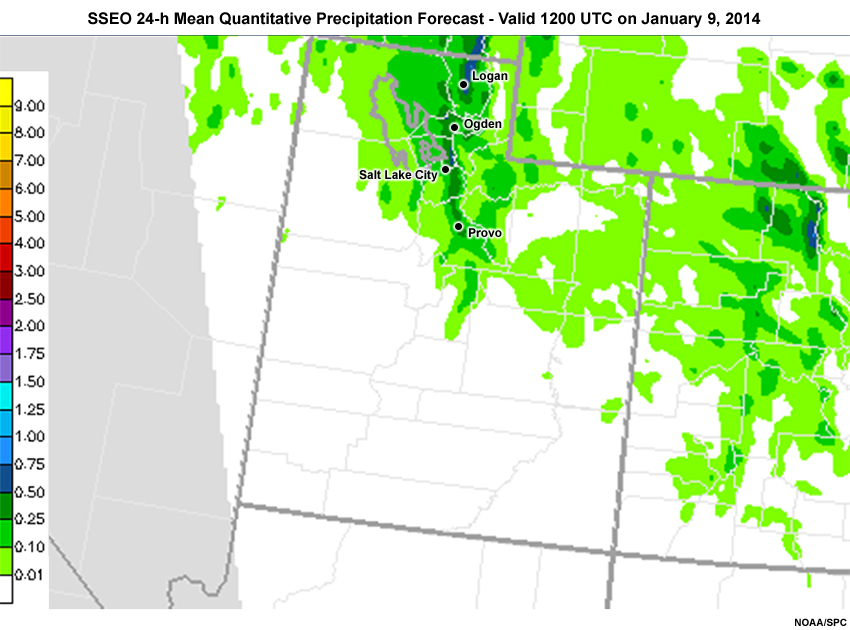
The Storm Scale Ensemble of Opportunity (SSEO) model shows that the snow could arrive in time and in sufficient quantity to slicken the roads during the morning commute. The 24-hour mean quantitative precipitation forecast (QPF) ending early Thursday morning shows 0.10” to 0.25” along the Wasatch Front from Salt Lake City north, and 0.01” to 0.10” in the Provo area. The 6-hour mean QPF ending late Wednesday morning shows that nearly all of the valley precipitation falls on Wednesday between 5:00 AM and 11:00 AM local time.
Traditional snow advisory criteria for Utah’s valleys is 3” to 5” in 12 hours, and 4” to 8” in 24 hours. Snowfall amounts associated with Winter Storm Warning criteria are 6” or more in 12 hours, and 9” or more in 24 hours. However, current NWS philosophy is to adjust these traditional criteria, as needed, based on the level of impact expected with an event.
After looking over all forecast information, it appears that snowfall will begin around 6:00 AM and continue through late morning, although snowfall is expected to be only 1” to 3”.
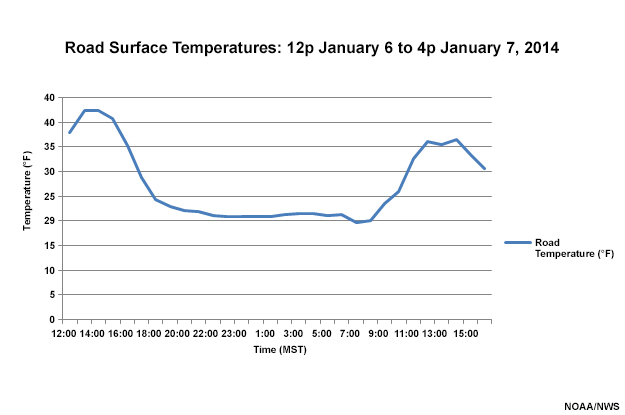
Another important forecast factor is the road surface temperatures. Tuesday’s road surface temperatures climbed into the mid-30s°F and dropped into the low-30s°F by the time you would be making your forecast. Although road temperatures are expected to stay a little warmer overnight with south winds and increased cloud cover ahead of the cold front, they should still fall well below freezing, which would enable snow to quickly stick to roads.
Question
Based on the weather information above, will you issue a Winter Weather Advisory, Winter Storm Watch or Winter Storm Warning?
The correct answer is a.
The weather information indicates that the forecast snowfall is below the local watch and warning criteria. However, the timing of the snowfall could impact the morning rush hour commute with slippery, snow covered roads. The potential travel impacts validate the issuance of a Winter Weather Advisory. If the local DOT has meteorologists on staff, it would be important to have a dialog with them regarding:
- potential event impacts,
- routes they are most concerned about, and
- joint messaging opportunities regarding the potential event impacts.
The DOT will appreciate the advance notice that the advisory provides so that they can begin planning their response to the event. You decide to issue a Winter Weather Advisory on Tuesday morning.
There are three questions in this simulation. To complete the simulation successfully, you will need to select the correct answer for all three questions. Feedback is available only after you complete the simulation. You will have three attempts to complete the simulation successfully. Launch the simulation when you are ready.
Launch Simulation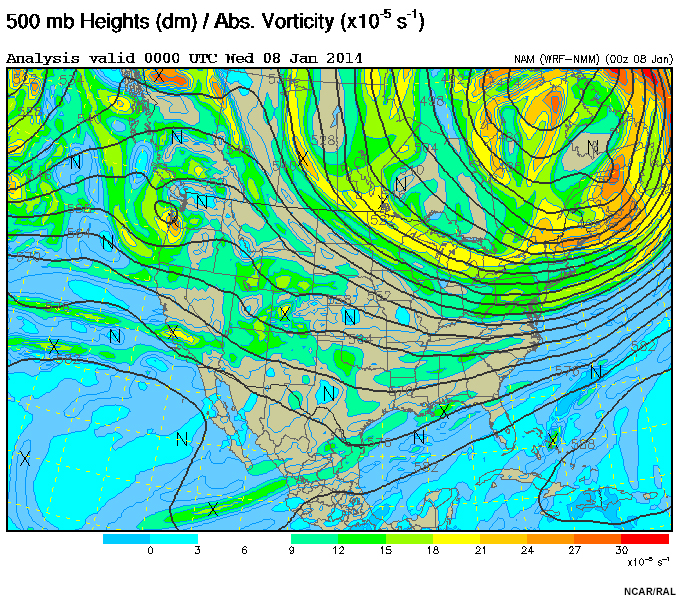
Preseason Coordination
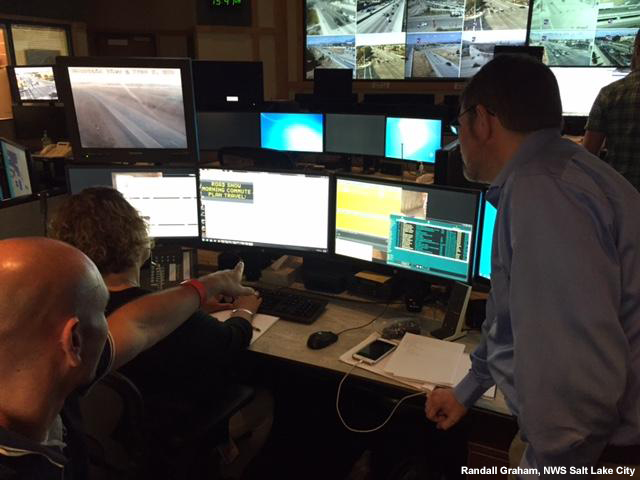
The Traffic Operations Center at the Utah Department of Transportation.
Providing meteorological support to decision-makers does not start with the first event of the season. Pre-season coordination is vital for effective communication whenever a winter weather event unfolds. It will enable you to understand the critical thresholds and decision points of DOT personnel.
Question
Before the winter season begins, you should meet with the DOT to learn about their workflow, concerns, and information needs. Doing so will help you be better prepared to help them when events unfold. Which of the following questions will help you capture this information? Select all that apply.
The correct answers are a, b, c, d, and f.
Answers to questions like these will help you create a timeline of critical information to help the DOT make important decisions. When providing Impact-Based Decision Support Services (IDSS) to partners, you can create a table that shows the weather conditions, locations at risk, event timing, and road impacts for an impending winter storm (see example below). This is a helpful way of organizing information while keeping it concise, and will give the DOT enough time to implement their preparedness measures.
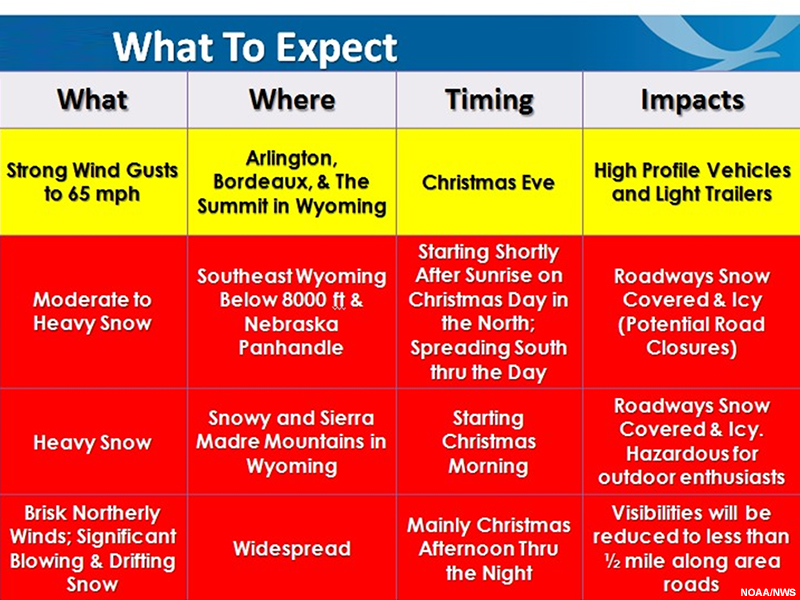
Table showing expected weather conditions, locations at risk, event timing, and road impacts for an impending Christmas winter storm.
Here are additional items to address in pre-season planning with the DOT:
- Find out how they like to be briefed and what information they hope to learn.
- For remote briefings, verify if they have a communication system that you can connect to, and what time window works best for them.
- Become familiar with their planning cycle so you can provide the right information at the right time.
- Ask about their experiences with the previous season’s storms. This will help you understand their perspectives and anticipate some of their concerns with future storms.
- Discuss forecast uncertainties and limitations on what information can (or cannot) be provided at particular phases of an event.
- Identify what their critical decision thresholds are (e.g., snowfall rates and amounts of concern, cross wind speeds that restrict travel).
Keep in mind that the NWS offices will not be forecasting road conditions for DOTs. Private sector and DOT weather providers support DOTs with specialized road surface temperature forecasts and expertise on road treatment options.
You may want to offer short training sessions to the DOT on how to understand and interpret your WFO's winter weather forecast products. Also, conduct integrated warning team exercises with the DOT that simulate actual events. All participants will come away with a better understanding of each other’s needs and roles. A better understanding of how the DOT operates will allow you, as a forecaster, to use your limited time and staffing resources efficiently during significant winter weather events. When partners practice together, everyone benefits.
Question
Winter weather information is viewed differently depending on your role during the event. Use the pull-down menu to select the population that is most interested in the answer for each question.
The correct answers are highlighted above. The following chart describes the focus that decision-makers, meteorologists, and the public have when dealing with a winter weather event.
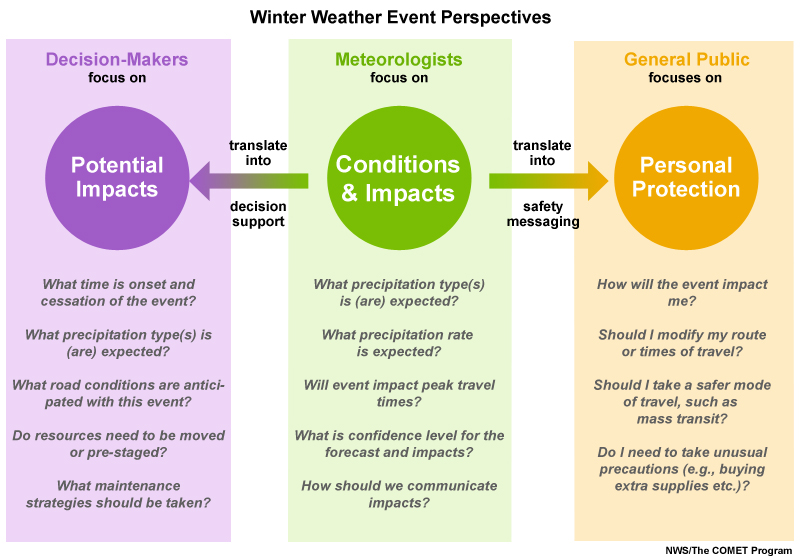
The main concerns as perceived by decision-makers, meteorologists, and the general public during winter weather events.
Winter weather information is viewed differently depending on your role during the event. As a forecaster, you are likely to focus on the precipitation type, amount, timing, and location. You must determine how to best communicate this information and associated forecast uncertainties. Most of your customers do not know the jargon or science behind the forecast. Also, they have a different perspective on the event according to their responsibility toward the community or their family.
Decision-makers tend to focus on potential impacts. This is typically done through emergency playbooks and disaster plans that have been adapted for the event. These plans contain trigger points based on critical thresholds tailored for the area. Decision-makers need to determine where and when to respond first, what measure of resources are needed, and the type of rescue and recovery actions entailed.
The general public is concerned about potential impacts too, but relative to personal protection and safety. Personal decisions of whether to work from home, send children to school, and stock up on emergency supplies and gas are their primary considerations. They also decide on what can be done to safely limit the impacts of the winter precipitation and when to begin preparation.
Next, we explore the ways in which forecasters can best support the DOT during the winter season.
Preseason Coordination » DOT Mitigation Strategies
Snowfall often affects a community’s entire surface transportation system at once such that traffic cannot flow or be directed around the impacted areas. The precipitation type, intensity, and impact on transportation govern many DOT decisions and trigger many actions. Certain actions are taken ahead of potential storms, particularly when Watches are issued and during Advisory and Warning events.
In the DOT, adverse weather impacts on the road can be categorized four ways (Pisano and Goodwin, 2004):
- Slick roads due to wet, snowy/slushy, or icy pavement.
- Reduced visibility due to fog, heavy precipitation, or vehicle spray.
- Obstructed lanes due to snow accumulations, standing water, or road debris.
- Road damage from potholes or washed out roads.
Road damage usually requires maintenance that can take days or months to complete. The other three impacts can be addressed using mitigation strategies, which will vary from place to place depending on an area’s specific needs.
There are three types of mitigation strategies:
- Advisory Strategies. Influence drivers and the general public in their decision-making process.
- Control Strategies. Restrict access to roads by reducing speeds and number of lanes, or completely closing a road to keep drivers safe.
- Treatment Strategies. Apply resources to the road environment to improve driving conditions.
Question
Use the pull-down menu to match the action with the type of mitigation strategy it best fits.
The correct answers are highlighted above. Knowledge of weather-related mitigation activities will help NWS forecasters provide services in a timely fashion so that DOTs can effectively mitigate hazardous weather impacts on the roads.
Preseason Coordination » Supporting the DOT
NWS offices should be flexible in how services are provided to state/local DOTs. For example, if the DOT has no weather support (e.g. in-house or a private sector provider), your IDSS may focus on timing of snowfall, precipitation rates, or your confidence in certain aspects of the event. Your IDSS should not include specialized weather support and customized consulting services to DOTs (e.g. road surface temperature forecasts or advice on which road chemicals are best suited for a particular circumstance).
If the DOT has weather support, a conversation with the DOT site manager should identify the level of service needed from NWS. Service will likely be a collaborative discussion focused on the impacts. The DOT weather support team will likely have expertise in forecasting road conditions and they should be able to help WFO forecasters assess potential event impacts. In this scenario, a brief discussion on the meteorology of the event should quickly shift to expected impacts and joint messaging by the two agencies. This discussion might focus on timing, specific routes, and locations (e.g. mountain passes or traditional trouble spots) that the DOT is most concerned about. Ideally, this interaction would focus on joint messaging strategies (i.e., routes to highlight and verbiage to use in statements) between the WFO and the DOT to ensure that we provide a consistent message to the public and our partners.
Examples of collaboration processes that occur in the DOT can be found here.
Question
You are a forecaster talking to the manager of a DOT that DOES NOT have weather support. Review the following statements and determine which best suits the DOT given their weather support circumstances. Choose the best answer.
The correct answer is a.
Option (a) discusses snowfall timing/rates, risk areas and forecast confidence. This information suits a DOT without weather support. Option (b) focuses on specific counties of greatest concern and snowfall impacts. This information suits a DOT with weather support.
DOTs without meteorological staff need information on the evolution, timing, and potential impacts of hazardous weather events. Weather forecasts are useful during the strategic timeframe, 24-48 hours prior to a hazardous weather event (i.e. start of precipitation). During this time, the DOT managers determine the specific mitigation strategies they will implement, ensure they have all of the equipment they need, and begin changing schedules to secure appropriate staffing for the event.
During and just prior to the event (~0-3 hours) is the tactical timeframe. At this point, DOT managers are sending out crews to specific locations and implementing specific advisory, control, and treatment strategies to mitigate the adverse weather impacts. Weather observations are in great demand during the tactical timeframe.
Question
During what DOT timeframe are the following scenarios most likely to occur? Use the pull-down menu to select “Strategic” or “Tactical” timeframe.
The correct answers are highlighted above. If operations personnel make good decisions based on the provided weather information, the situation may not become an emergency. For DOTs to implement mitigation strategies effectively, they need weather information both during the strategic and tactical phases of their operations.
When preparing to provide decision support for a DOT, forecasters need to already be aware of their needs. The mindset of DOT personnel is typically as follows:
- Initiate on magnitude and timing thresholds - DOT managers have critical precipitation types and amounts, and event timing limitations based on the potential road impacts. They use these “trigger points” to initiate actions.
- Plan for threats - once the latest weather assessment is received, including the forecast and its relative uncertainties, default operations are initiated and adapted to the current situation.
- Prepare for impacts - actions are taken according to the active plan in order to ready the community against the potential winter storm impacts.
Collaboration between the NWS and DOT is needed to ensure consistent information is shared between all parties and with the traveling public. Next, we learn about how the NWS and DOT work together to create a unified message.
Collaborate for a Unified Message
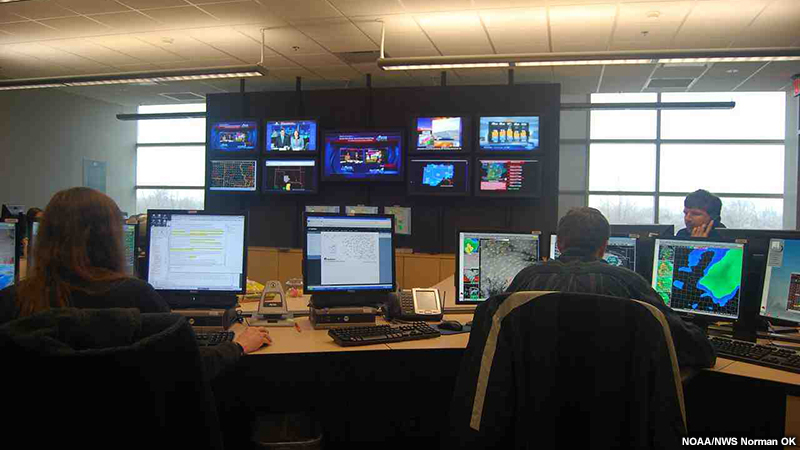
Operations area of the Norman, Oklahoma weather forecast office during a winter storm.
Within the NWS, a constant process of coordination and collaboration during a winter weather event is required for a unified message. Interactions need to happen between you and your neighboring local offices. Collaboration between your office and NOAA national centers, such as the Weather Prediction Center, is important to make sure that everyone is communicating a consistent message.
Question
What is one issue that may arise from travelers receiving weather information from different sources? Choose the best answer.
The correct answer is a.
When people receive inconsistent information, they may have difficulty determining how the weather will impact their travels. When DOTs and NWS collaborate on weather impact messages, consistent information is disseminated across various sources. Consistent impact-based information and messaging allows travelers to make informed decisions regarding travel in hazardous weather.
If the DOT that you are working with has weather support, then it presents the opportunity for a much more robust type of collaboration. The NWS Chatroom is one way the NWS and DOT share information. Other common collaboration methods include conference calls and decision-support product development. Prior to the calls, the NWS and DOT weather providers share initial thoughts regarding areas where significant impacts may occur by sharing preliminary informational graphics or via chat.
Conference Calls
Conference calls are key to sharing information between the NWS and DOT weather forecasters. Calls should be short (5-15 minutes) and focus on the expected precipitation type and intensity, event timing, and especially impacts. Subsequent joint messaging should emphasize the most significant impacts.
Weather Graphics
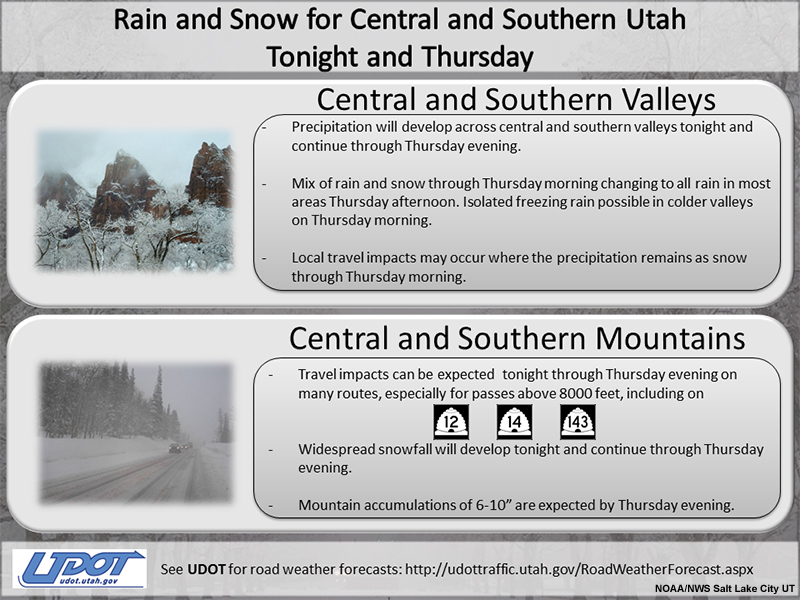
DOT Graphic
NWS Graphic
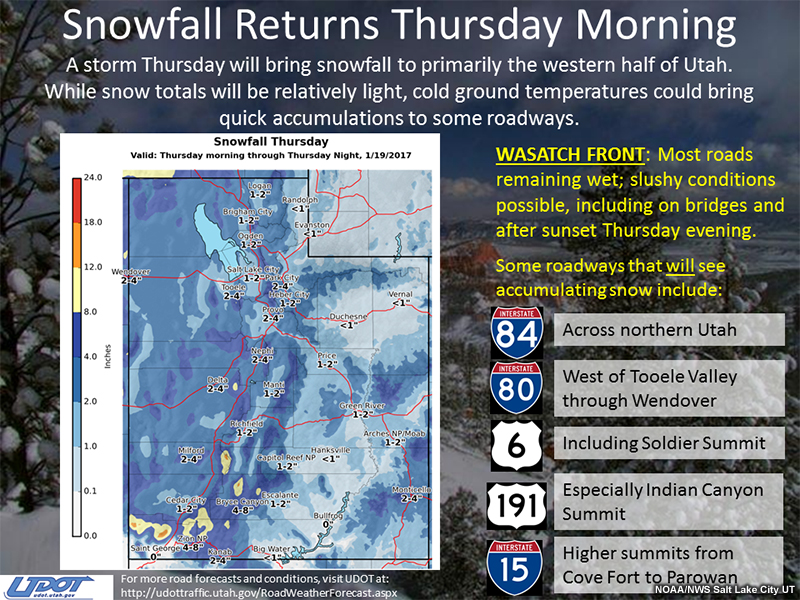
Both the NWS and DOT weather forecasters share informational graphics that highlight similar forecast weather conditions, event timing, areas of concern, and potential impacts. When user's receive similar information from trusted, authoritative sources, they are more likely to modify their behavior and take protective action.
Question
Examine the messages in the tabs above. What attributes of the messages increase the likelihood that individuals will take precautionary actions? Select all that apply.
The correct answers are a, b, c.
The correct answers are highlighted above. If the DOT that you are working with has weather support, work with them to identify the areas and routes of greatest concern and impact. This information can be shared via NWS messaging, with links or attribution to the DOT. This cross promotion shows consistent messaging and increases the likelihood that individuals will take precautionary action.
The NWS and state DOTs are considered authoritative voices and individuals are more likely to change their behavior based on messaging from such entities. A study of driver awareness and behavior modification conducted in Utah following two winter storms found that drivers that gathered information from the NWS or the Utah DOT were more likely to modify their behavior than were those that gathered information elsewhere.
Snowfall Possibilities
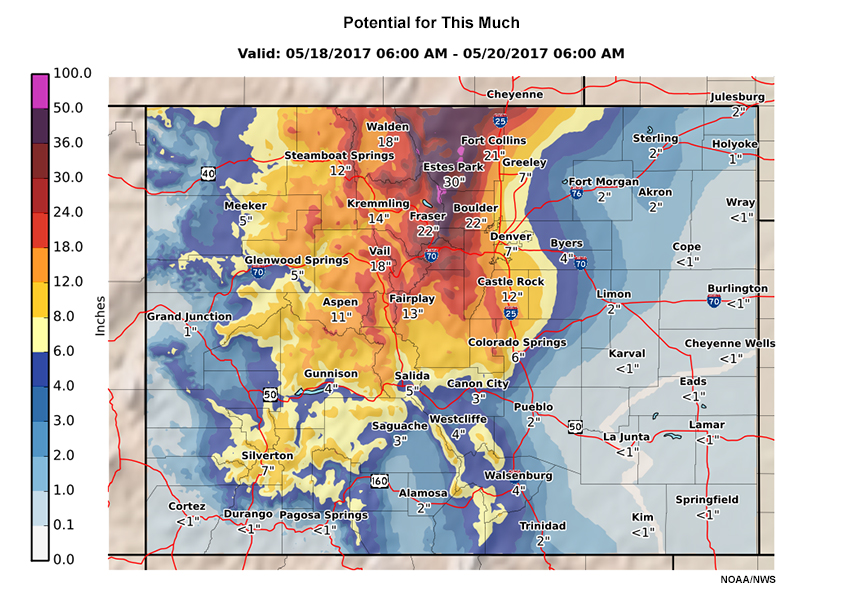
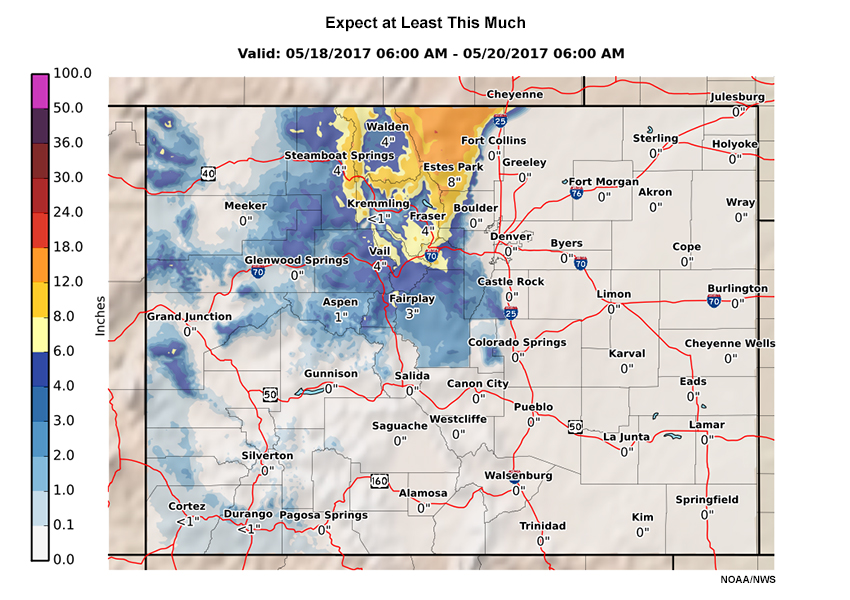
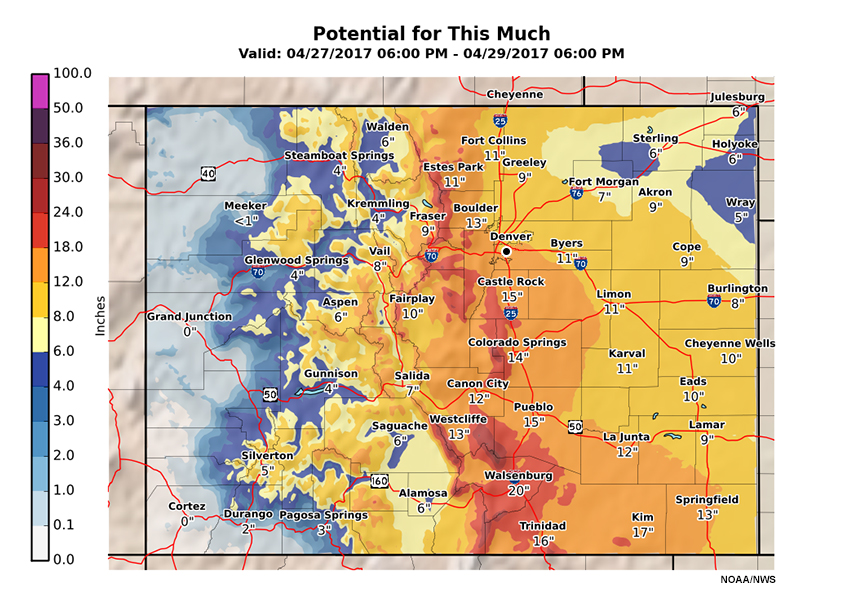
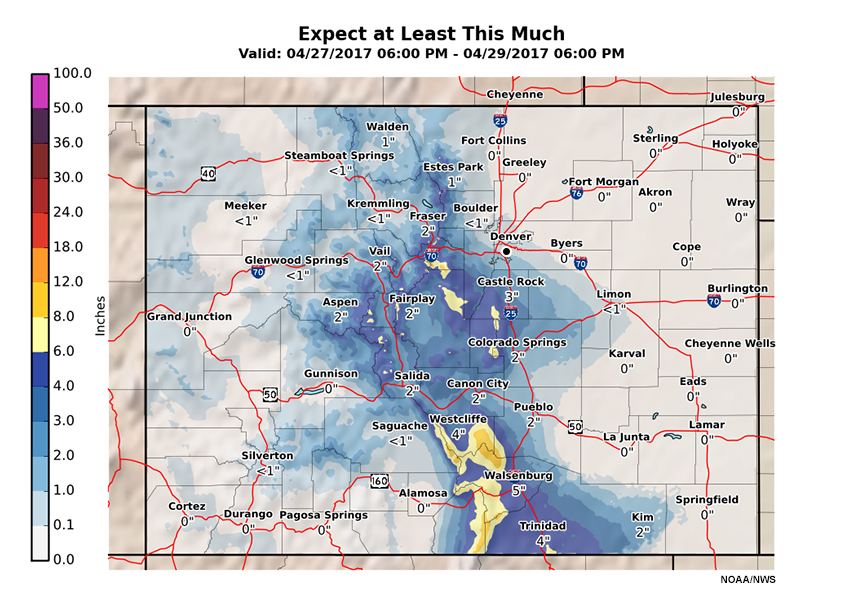
Behavioral research shows that communication of probabilistic information can help end-users make more cost-effective and safer decisions (LeClerc and Joslyn, 2012). The NWS is experimenting with probabilistic snowfall products that show the chances of exceeding specific amounts. Forecasters can show three types of projected scenarios: “Official Snowfall Forecast” (or most likely snowfall), “Expect At Least This Much”, and “Potential For This Much”. The purpose of these products is to provide users with a range of snowfall possibilities, better communicate forecast uncertainties, and further assist decision-makers during winter weather events.
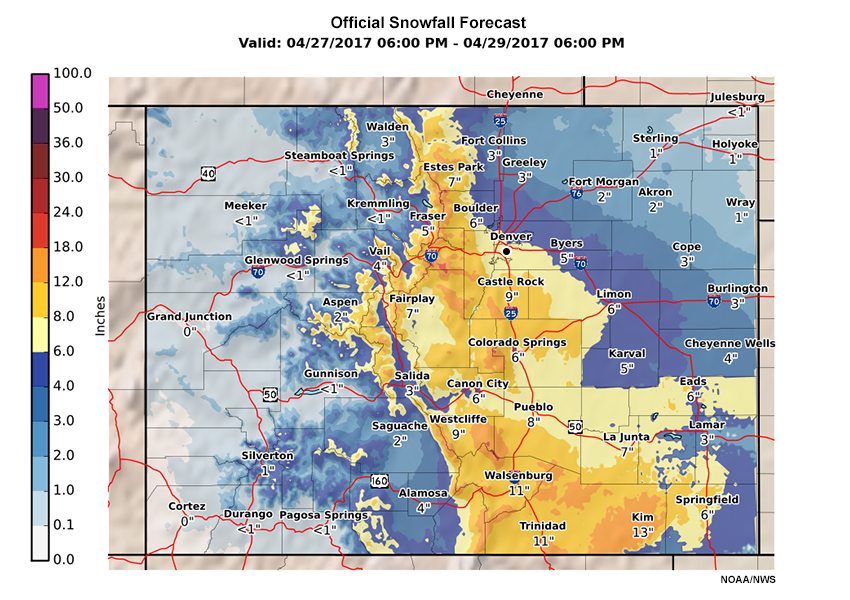
The "Official Snowfall Forecast" is a deterministic representation of a forecaster’s best effort toward absolute accuracy. It is the official forecast within the next one to three days, and the amounts are provided as point and range values.
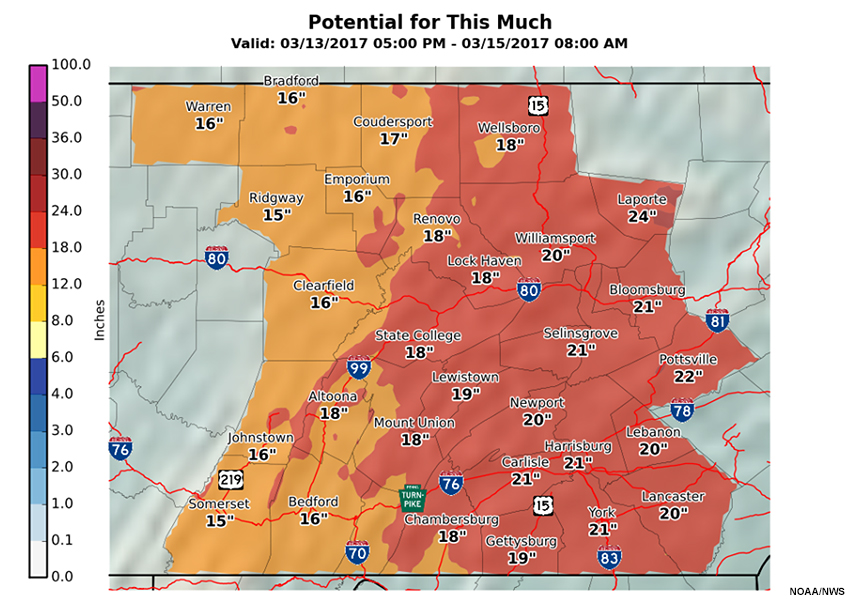
The “Potential For This Much” forecast represents the “safety margin forecast”, or that 9 out of 10 times the totals will fall below the given forecast value. This product is issued up to 3 days in advance, and helps communities better prepare ahead of the storm based on the storm’s maximum potential snowfall accumulation.
Similarly, the “Expect At Least This Much” forecast can help advance preparations based on the least amount of snow the storm is expected to produce. In a winter weather situation, both "Potential For This Much” and “Expect At Least This Much” scenarios are needed to fully address the array of decisions that need to be made.
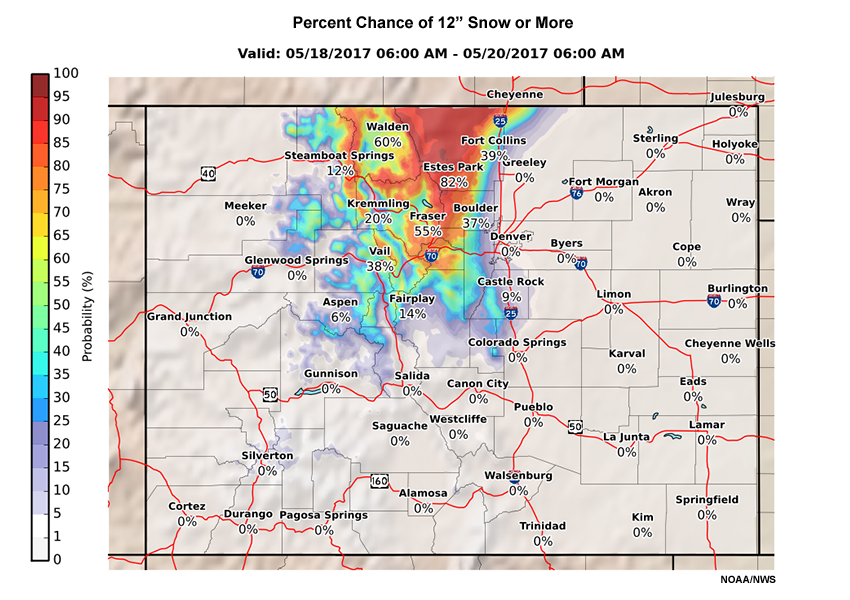
The NWS is also experimenting with Exceedance Probability products that represent the likelihood of exceeding a specific snowfall amount (0.1”, 1”, 2”, 4”, 6”, 8”, 12”, and 18”). These products are designed to indicate high or low confidence in the official forecast.
Question
Review the snowfall probabilities below and answer the following question.
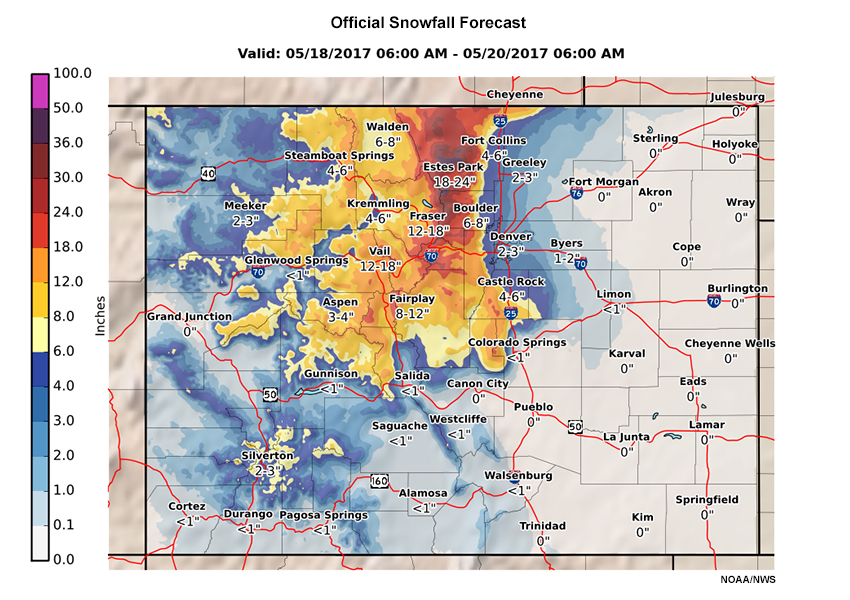
Official Forecast
Potential for This Much
Expect at Least This Much
Percent Exceedance
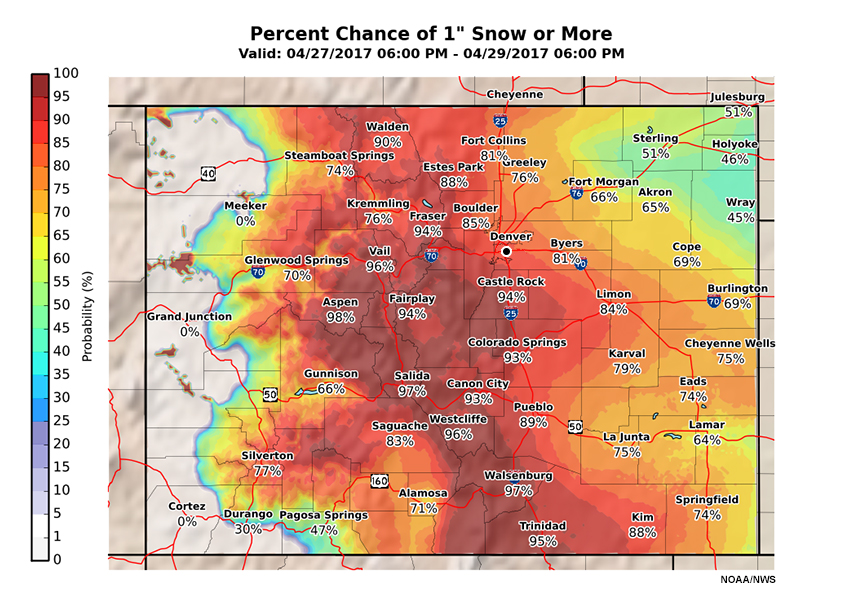
Based on the graphics above, what potential snow accumulation amounts could Denver, Colorado experience?
The correct answers are highlighted above.
Winter Weather Event Types
Let’s look at NWS support of DOT operations during winter weather. To frame this part of our discussion, it helps to differentiate these winter weather events by perceived severity.
Question
Determine True or False for the following statement.
Winter weather events that do not meet watch/warning criteria can have major impacts on the community.
The correct answer is a.
Larger snowstorms are frequently well-predicted in advance. However, smaller events can also have tremendous impacts. For example, a quick inch of snow on cold road surfaces during rush hour will likely result in numerous accidents and will generally have a bigger societal impact than a 6-12 inch snowstorm occurring overnight or on a weekend.
Winter Weather Event Types » Warning-Criteria Events
Events meeting traditional warning-criteria are generally thought of as being more severe. However, forecasters must consider the potential impacts of an event when making watch, warning and advisory decisions. For example, while snowfall totals may reach low-end warning criteria, if it is a late season event with warm ground temperatures and occurring on a Saturday night, perhaps an advisory will be sufficient. Conversely, a snowfall event with snow totals that are below traditional advisory criteria, but which is occurring with cold road surfaces and during a weekday rush hour, might warrant an advisory or warning based on the impacts.
Winter Weather Event Types » Sub-advisory Events
Question
Which of the following factors contribute to the impact of sub-advisory events? Select all that apply.
The correct answers are a, d.
The correct answers are highlighted above. Hazardous conditions during sub-advisory events (based on traditional criteria) occur more frequently and may often be associated with lower confidence forecasts as the event duration and precipitation rates may be less certain. Impacts from these events range from minimal to severe, depending on the situation. Significant impacts are more likely in areas where winter weather is less common, or when snowfall occurs during peak commute times in areas more accustomed to snow. However, areas that regularly experience winter weather can still experience major traffic impacts because the public often ignores these so-called “minor” weather events. Significant sub-advisory events can have a greater impact on DOT strategic planning because the details and confidence on the potential impacts may not be well established until they are in the tactical time frame.
Case: Pennsylvania Winter Storm Event
You are a forecaster at WFO State College with responsibility for central Pennsylvania (PA). It is Sunday, March 12th.
A strong coastal storm is expected to bring significant wintry precipitation across the mid-Atlantic and New England early in the week. Much of central PA is likely to get snow Monday night through Tuesday night. A Winter Storm Watch is in effect.
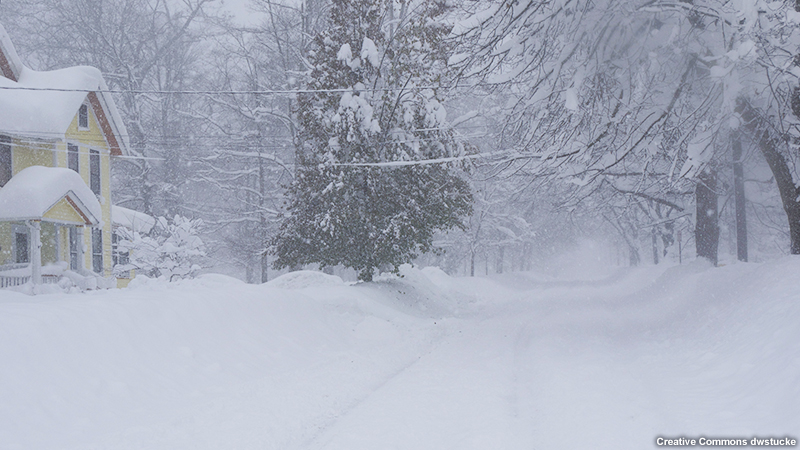
This storm comes on the heels of another system that brought arctic cold air and snowfall across PA over the weekend. The heaviest snow fell in west-central PA.
Models have converged on the track of the surface low to be east of Maryland early Tuesday. The heaviest snowfall is expected to occur between predawn and early morning on Tuesday, when snowfall rates of 1” to 2” per hour are expected for several hours.
The track of the low will determine where the highest snowfall totals will fall. There is uncertainty in the storm total accumulation, depending on exactly where the deformation zone forms on the northwest side of the surface low. Currently, it looks like the surface low does not strengthen until it passes through New Jersey around midday Tuesday. This scenario would result in the heaviest snow from northeast PA into New England.
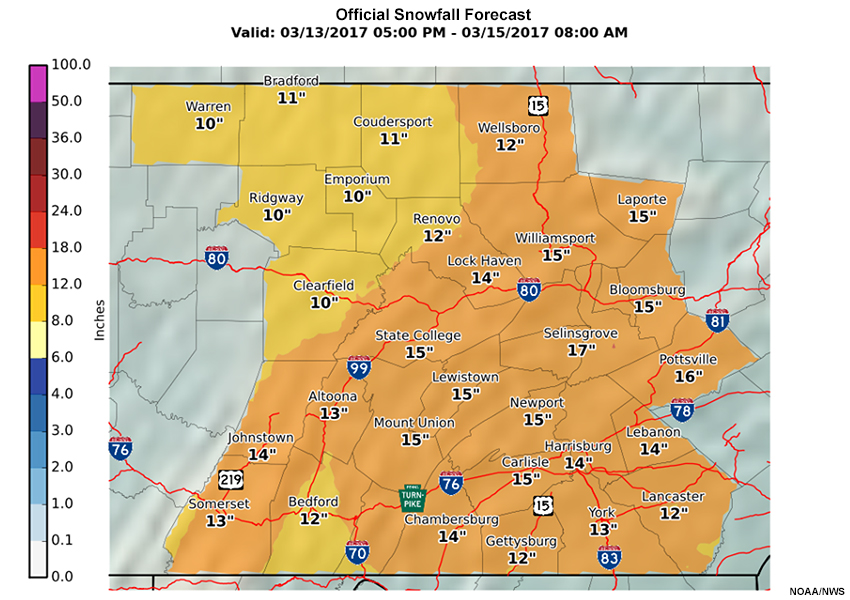
Official Snowfall Forecast
Potential for This Much
Expect at Least This Much
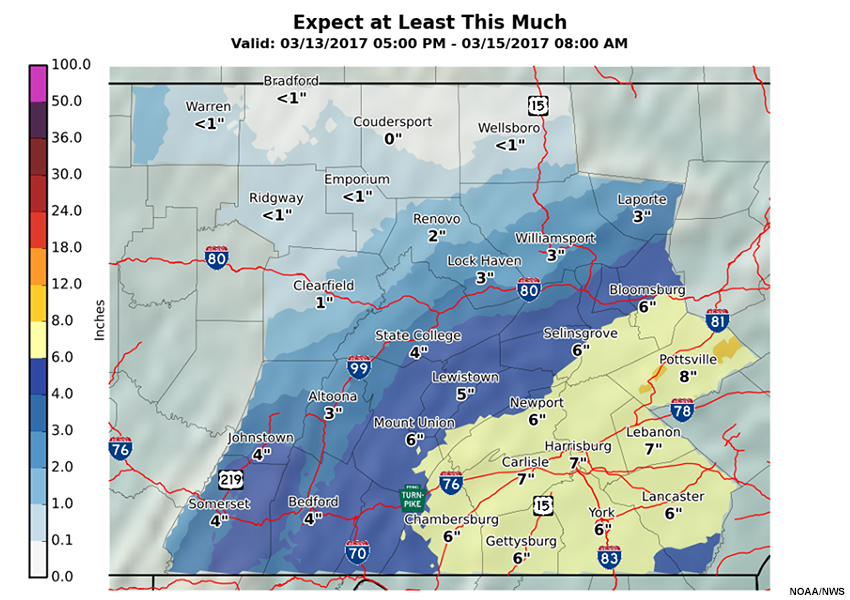
After looking over the forecast information, it appears that the official forecast calls for 10”+ of snow over the CWA, with higher amounts over the eastern portions. Overall amounts expected: western counties, 10” to 14"; central counties, 11” to 15"; and eastern counties, 12” to 17". However, uncertainty remains with these amounts and they will be adjusted as the main event approaches.
Case: Pennsylvania Winter Storm Event » Winter Weather Threat
Note: Although NWS State College does not directly communicate with the DOT, this scenario may be applicable to other NWS offices that interact with the DOT.
Surface Forecast
Official Snowfall Forecast
Potential for This Much
Expect at Least This Much
Question
The DOT manager at State College calls the office and after the usual pleasantries says “I just came on shift and see that you have issued Winter Storm Warnings across our area. Is this going to primarily be a snow-producing storm? How much of it are we going to get across the area?”
How would you describe the winter weather threat expected to impact State College on Monday? Choose the best answer.
The correct answer is c.
The official forecast calls for 15” of snow in State College. However, because the snowfall totals depend on where the deformation zone of the surface low develops, you should communicate to the DOT manager a range of plausible outcomes to reflect these forecast uncertainties. These outcomes would be what is shown in the “Expect at Least This Much” and “Potential for This Much”. It is also good practice to express forecast snowfall rates and timing of those rates, which will help the DOT determine how quickly to deploy snow plows and how many. Snow rates and timing are huge factors in determining potential impacts.
While the other options are concise and well stated, option (a) is incorrect because State College should expect to see at least 4”, according to the “Potential for This Much” scenario. Option (b) is incorrect because the antecedent conditions (cold airmass and past snow cover) suggest that precipitation from the current storm would likely fall as snow and accumulate on the ground. The “Potential For this Much” and “Expect At Least This Much” scenarios should not be used as forecast minimum and maximum amounts. Also, option (b) uses meteorological jargon that the DOT may not be familiar with (e.g. deformation zone).
Case: Pennsylvania Winter Storm Event » Confidence and Areas of Concern
Surface Forecast
Official Snowfall Forecast
Potential for This Much
Expect at Least This Much
Question
As a follow-up to your response, the DOT manager asks “What is your confidence in this forecast? Are there any particular geographic areas you think are at greatest risk? What time will the worst conditions occur?”
Which of the following statements will you use to answer the manager’s questions? Choose the best answer.
The correct answer is b.
Option (b) is succinct and describes important information that will help the DOT in their plans for snow removal. You clearly communicated to the DOT manager your forecast confidence without getting into meteorological detail. It is helpful to describe the risk areas relative to known geographical locations. Using obscure geographical references will not help decision-makers adequately prepare for operations. Also, it is good to use broad time descriptions (like predawn to early morning) to indicate what time(s) of the day are most likely to experience the worst of the storm. In this way, our language accounts for forecast uncertainty.
Option (a) is incorrect because it focuses on forecast uncertainties rather than answering the manager’s questions. In this case, you may lose the decision-maker’s trust in the weather information you communicate. This option does not mention risk areas or when the DOT can expect the worst conditions. Also, option (a) uses meteorological jargon that the DOT may not be familiar with (e.g. deformation zone).
Option (c) is incorrect because errors in the initial conditions of a high-resolution model can result in a poor high-resolution forecast. High-resolution forecasts are only as good as their initial conditions. Also, this option does not provide specific geographic locations at risk and needs better timing descriptors to express the forecast uncertainties in event timing.
Case: Pennsylvania Winter Storm Event » Communicate the Impacts
Surface Forecast
Official Snowfall Forecast
Potential for This Much
Expect at Least This Much
Question
As a final follow-up to your responses, the DOT manager asks “What are the potential impacts of Monday’s winter storm?"
Which of the following statements will you use to answer the manager’s question? Choose the best answer.
The correct answer is a.
The weather threat is clearly stated, along with general descriptions of potential road impacts. Other details describing the potential snow total, problems with snow load due to the snow already on the ground, and when to expect the worst of the storm is provided to the DOT manager.
Option (b) is incorrect because no useful information is communicated to the DOT manager. Instead, the discussion focuses on how poorly the models are handling the winter storm and ignores the contribution of the antecedent conditions. Also, option (b) uses meteorological jargon that the DOT may not be familiar with (e.g. deformation zone).
Option (c) is incorrect because there is no information on which areas are at greatest risk to experiencing the most snowfall. Also, forecasters should not make recommendations about emergency management decisions.
Case: Pennsylvania Winter Storm Event » What Happened?
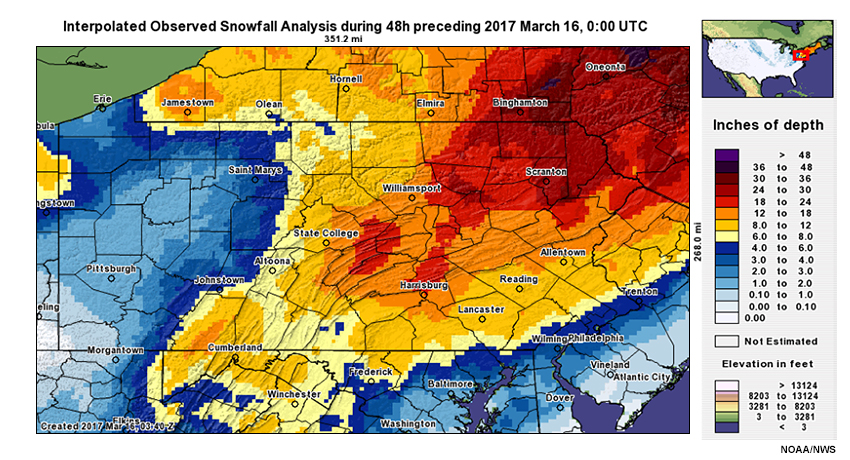
The surface low moved up the U.S. East Coast on March 14th. The strong system produced a large swath of 16”+ of snow over central and northeastern Pennsylvania, and over 32” of snow in northeastern Pennsylvania.
Numerous school closures and 3 fatalities (due to snow shoveling) in Schuylkill County, Pennsylvania were among the notable storm impacts across the State College CWA. The state’s governor signed a “Disaster Emergency” that allowed the state DOT and the Turnpike Commission to restrict speeds on interstate highways and limit traffic. Snowfall rates in eastern areas were 2” to 4” per hour, reducing speeds and closing roads. Blowing and drifting snow on the roads reduced visibility and made it difficult to keep roads passable. Road closings reduced traffic as did advanced warnings.
The map below shows the observed snowfall analysis from the March 13-14 winter storm.
Summary
The DOT implements various strategies to mitigate winter weather impacts on the road network. DOT decision-makers need reliable weather information to make critical decisions and adequately prepare communities at risk. Pre-season coordination enables forecasters to understand the needs, mitigation strategies, and critical time frames of DOT personnel.
Also, the lesson discussed how collaboration between the NWS and DOTs is essential to communicating concise and consistent forecast information. The benefits and appropriate interpretations of probabilistic snowfall forecast products were also highlighted.
The discussion then turned to how warning-criteria events differ from sub-advisory events. Event severity and resulting impacts vary depending on which type of winter weather is at hand. The simulation exercise also provided practice in supporting a DOT manager during a sub-advisory event.
Finally, learners worked through a winter weather case study to practice how to communicate the weather threat, areas at risk, forecast confidence, and potential impacts that are most beneficial to DOT personnel.
You have reached the end of the lesson. Please complete the quiz and share your feedback with us via the user survey.
References
Barjenbruch, K., and Coauthors, 2016: Drivers’ Awareness of and Response to Two Significant Winter Storms Impacting a Metropolitan Area in the Intermountain West: Implications for Improving Traffic Flow in Inclement Weather. Wea. Climate Soc., 8,475–491
National Weather Service Winter Safety
COMET MetEd Module: Weather and Road Management
LeClerc, J. and S. Joslyn, 2012: Odds Ratio Forecasts Increase Precautionary Action for Extreme Weather Events. Wea. Climate Soc., 4, 263–270.
NOAA/NWS Warning Decision and Training Division Module: Road Weather Impacts and Surface Transportation Mitigation Strategies
U.S. Department of Commerce National Oceanic and Atmospheric Administration: Guidance for NWS Support for State/Local Departments of Transportation. Retrieved August 11, 2017.
U.S. Department of Transportation Federal Highway Administration: How Do Weather Events Impacts Roads? Last modified: February 1, 2017. Retrieved June 9, 2017.
U.S. Department of Transportation Federal Highway Administration: Another Rain Delay. Last modified: January 31, 2017. Retrieved June 19, 2017.
U.S. Department of Transportation Federal Highway Administration: Collaboration Across the Road Weather Enterprise: The Pathfinder Project. Retrieved August 16, 2017.
Product/Service Description Document - Experimental Probabilistic Snowfall Products Winter 2016-2017
Wisconsin Transportation Bulletin No. 6: Using Salt and Sand for Winter Road Maintenance. Retrieved July 27, 2017.
Contributors
COMET Sponsors
MetEd and the COMET® Program are a part of the University Corporation for Atmospheric Research's (UCAR's) Community Programs (UCP) and are sponsored by NOAA's National Weather Service (NWS), with additional funding by:
- Bureau of Meteorology of Australia (BoM)
- Bureau of Reclamation, United States Department of the Interior
- European Organisation for the Exploitation of Meteorological Satellites (EUMETSAT)
- Meteorological Service of Canada (MSC)
- NOAA's National Environmental Satellite, Data and Information Service (NESDIS)
- NOAA's National Geodetic Survey (NGS)
- National Science Foundation (NSF)
- Naval Meteorology and Oceanography Command (NMOC)
- U.S. Army Corps of Engineers (USACE)
To learn more about us, please visit the COMET website.
Project Contributors
Program Manager
- Dr. Alan Bol — UCAR/COMET
Project Lead
- Vanessa Vincente — UCAR/COMET
Instructional Design
- Tsvetomir Ross-Lazarov — UCAR/COMET
- Dr. Alan Bol — UCAR/COMET
Science Advisors
- Aimee Fish — Regional Training Coordinator, Alaska Region Headquarters, NOAA National Weather Service
- Randy Graham — Meteorologist In Charge, NOAA National Weather Service Salt Lake City UT
- Richard Grumm — Scientific Operations Officer, NOAA National Weather Service State College PA
- James G. Ladue — Meteorologist, Warning Decision Training Branch, NOAA National Weather Service
- Andrew P. Noel — NOAA National Weather Service
- Paul Pisano — Team Leader for Road Weather Management, Federal Highway Administration
- David Soroka — National Winter Weather Program Leader, NOAA National Weather Service
Graphics/Animations
- Steve Deyo — UCAR/COMET
Multimedia Authoring/Interface Design
- Gary Pacheco — UCAR/COMET
COMET Staff, September 2017
Director's Office
- Dr. Elizabeth Mulvihill Page, Director
- Tim Alberta, Assistant Director Operations and IT
- Paul Kucera, Assistant Director International Programs
Business Administration
- Lorrie Alberta, Administrator
- Tara Torres, Program Coordinator
IT Services
- Bob Bubon, Systems Administrator
- Joshua Hepp, Student Assistant
- Joey Rener, Software Engineer
- Malte Winkler, Software Engineer
Instructional Services
- Dr. Alan Bol, Scientist/Instructional Designer
- Tsvetomir Ross-Lazarov, Instructional Designer
International Programs
- Rosario Alfaro Ocampo, Translator/Meteorologist
- Bruce Muller, Project Manager
- David Russi, Translations Coordinator
- Martin Steinson, Project Manager
Production and Media Services
- Steve Deyo, Graphic and 3D Designer
- Dolores Kiessling, Software Engineer
- Gary Pacheco, Web Designer and Developer
- Sylvia Quesada, Production Assistant
Science Group
- Dr. William Bua, Meteorologist
- Patrick Dills, Meteorologist
- Bryan Guarente, Instructional Designer/Meteorologist
- Matthew Kelsch, Hydrometeorologist
- Erin Regan, Student Assistant
- Andrea Smith, Meteorologist
- Amy Stevermer, Meteorologist
- Vanessa Vincente, Meteorologist